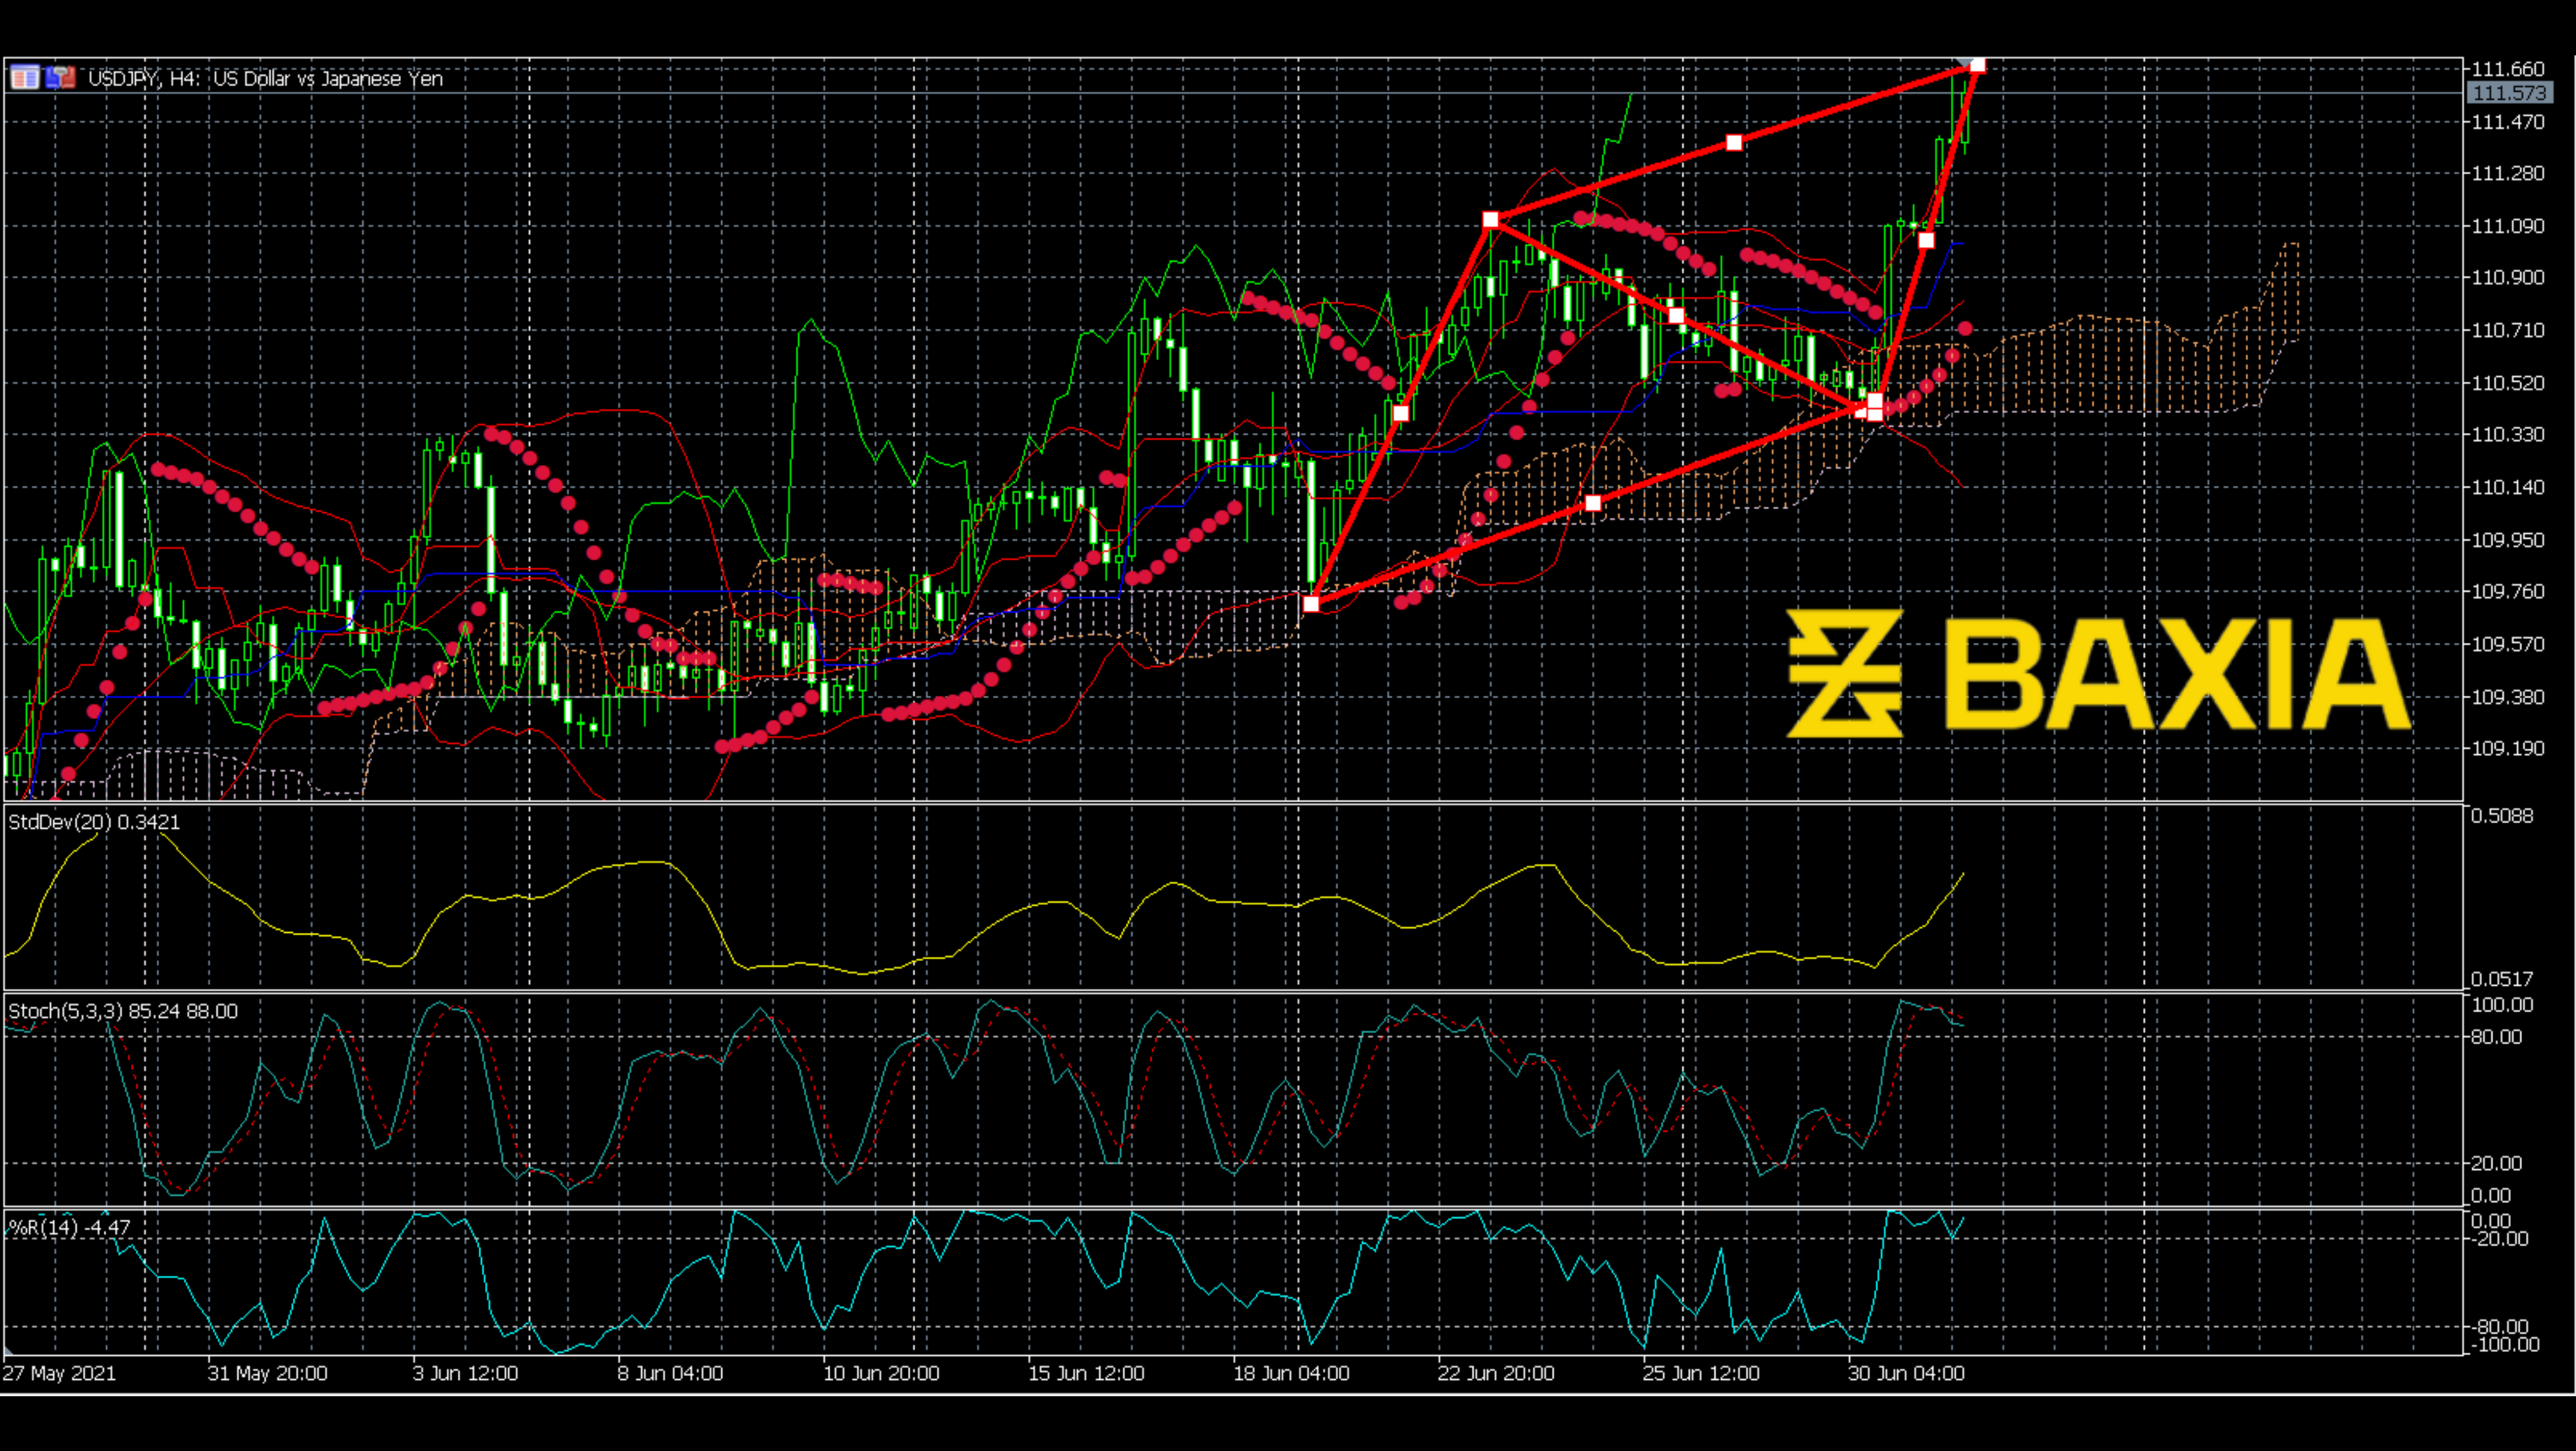

The price of USDJPY had been rising since the beginning of June. As we can see, the upward trend was comparatively stable. However, the price still went down on July 2nd. The downward trend was mild initially; then, the price turned down on July 8th, which was sharper and steeper. What does this sharp stark mean?
The price stopped going down after the sharp spark, and it touched the bottom Bollinger Band. As we can see, the price bounced back soon after it touched the band; this is the characteristic of the Bollinger Bands; it pushed the price back to the middle, which made the price reach the 38.2% level Fibonacci.
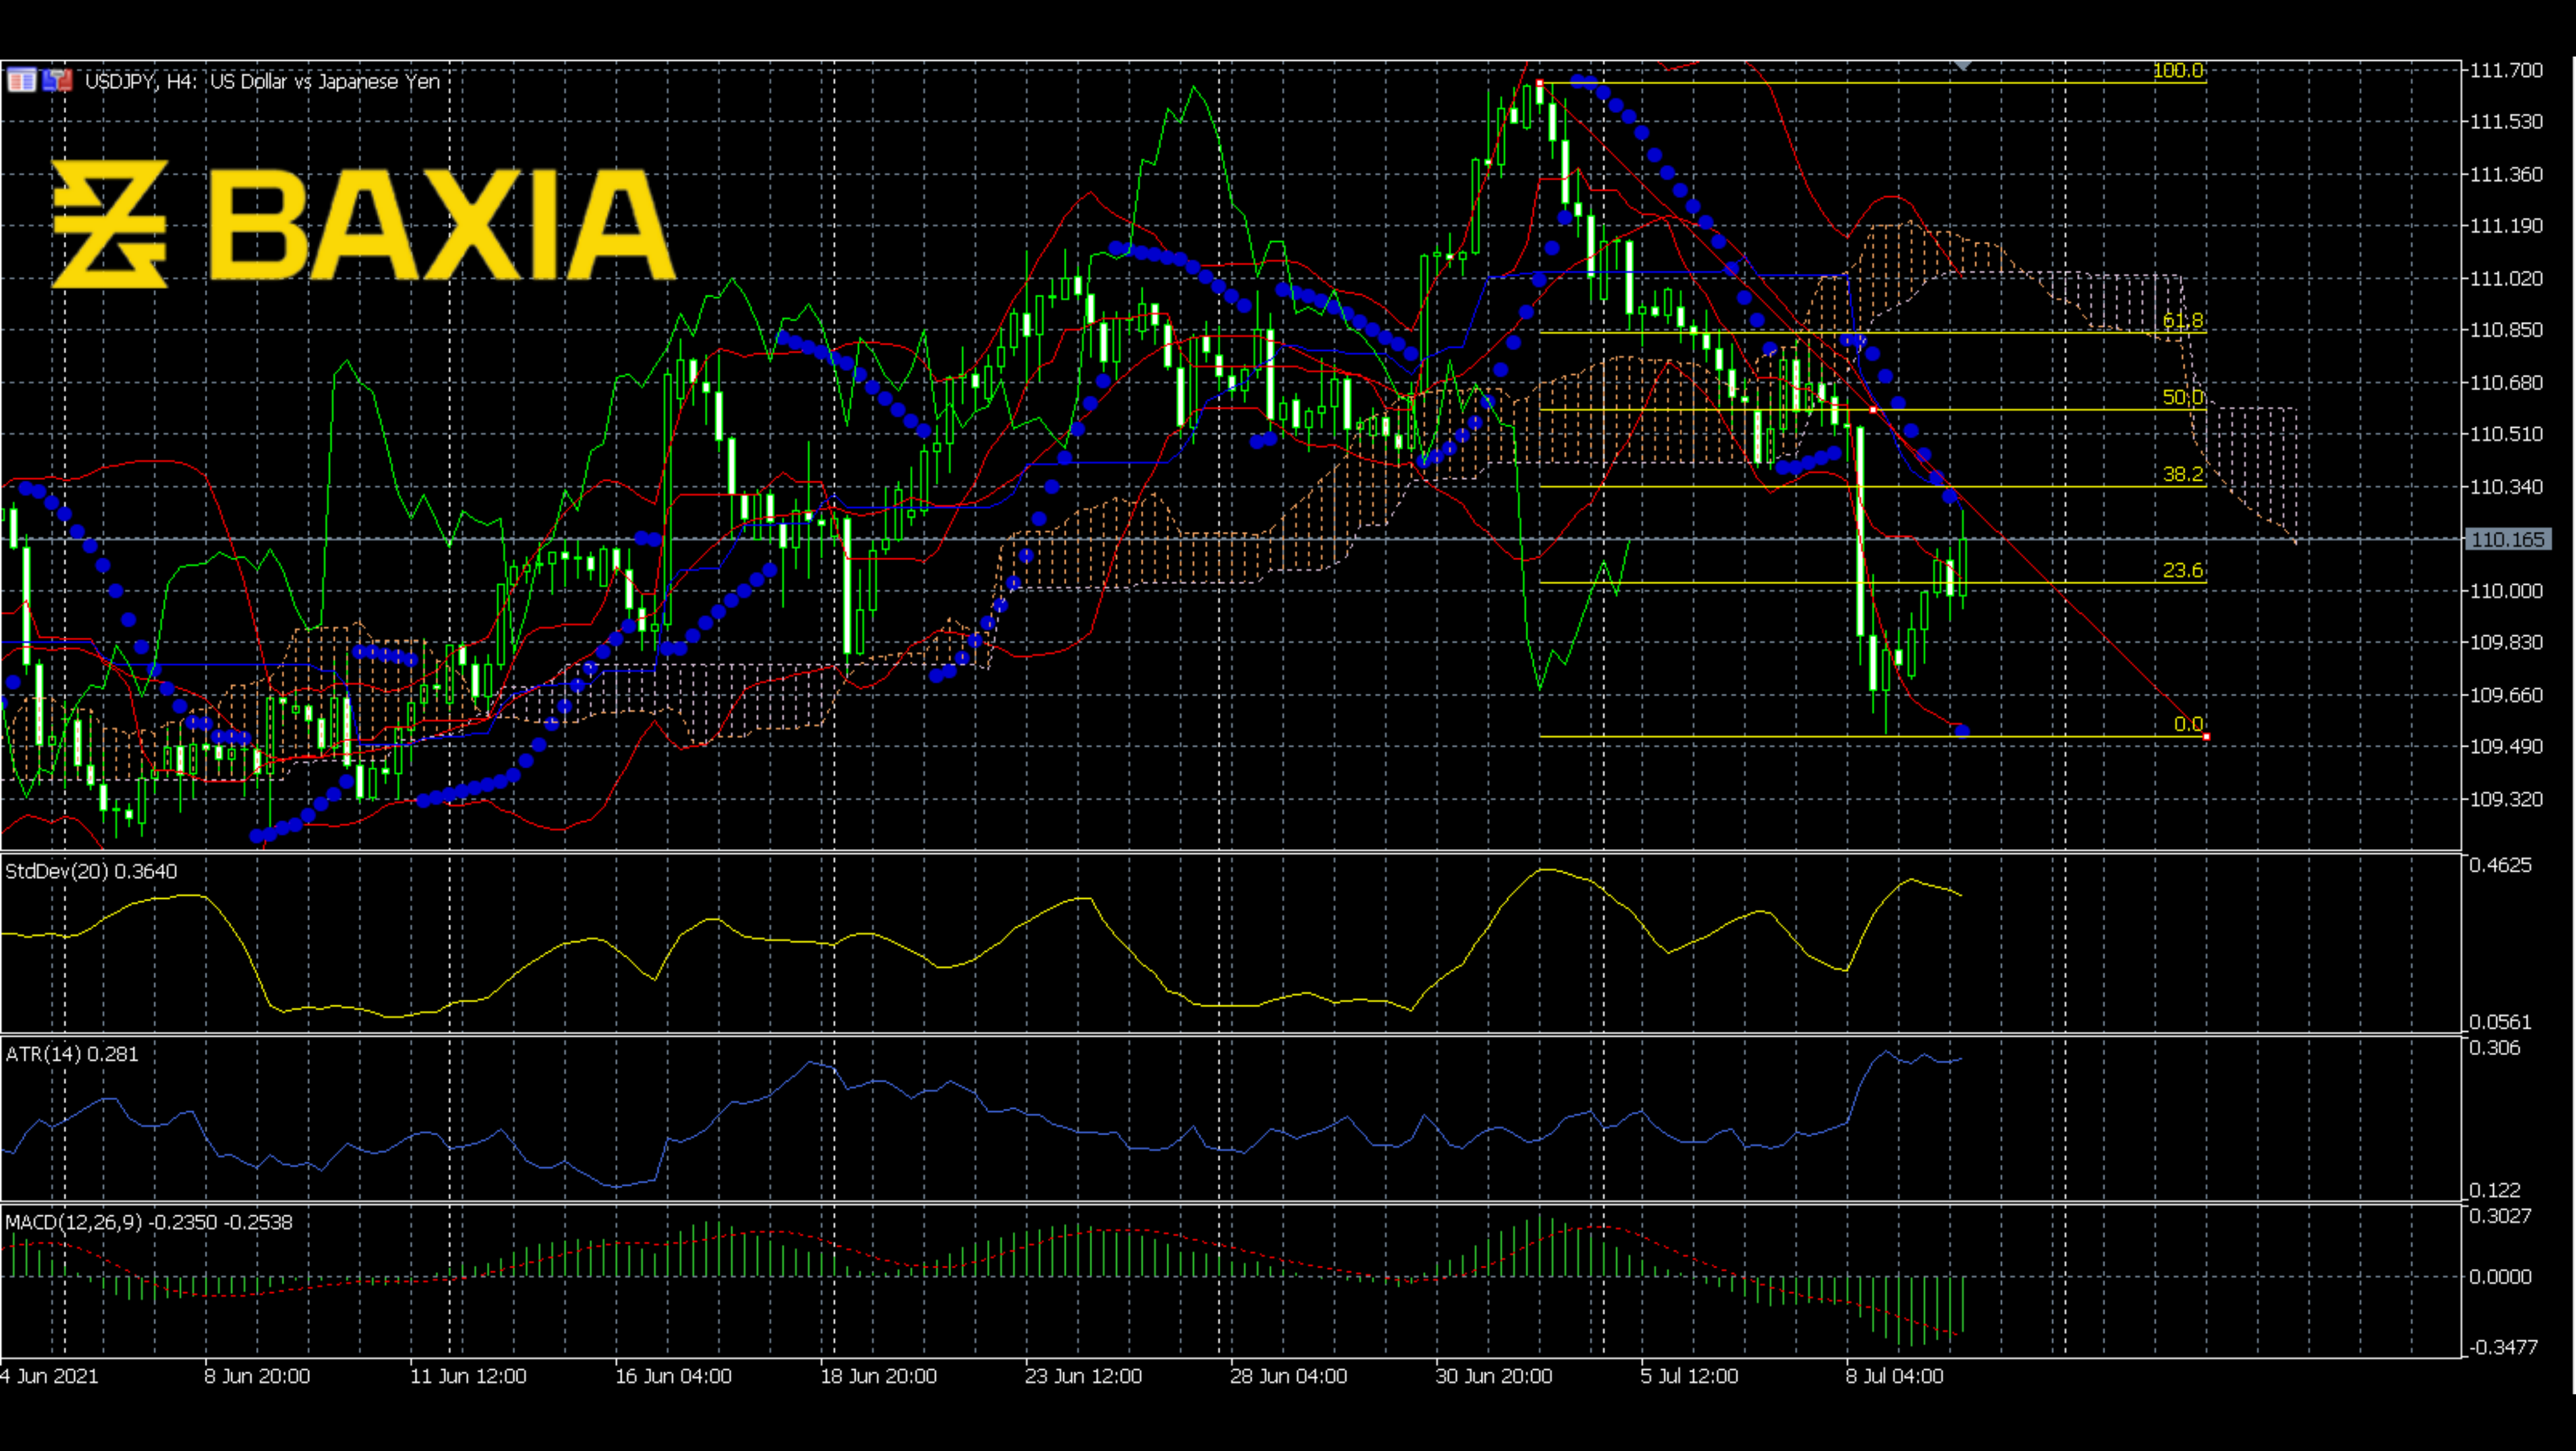
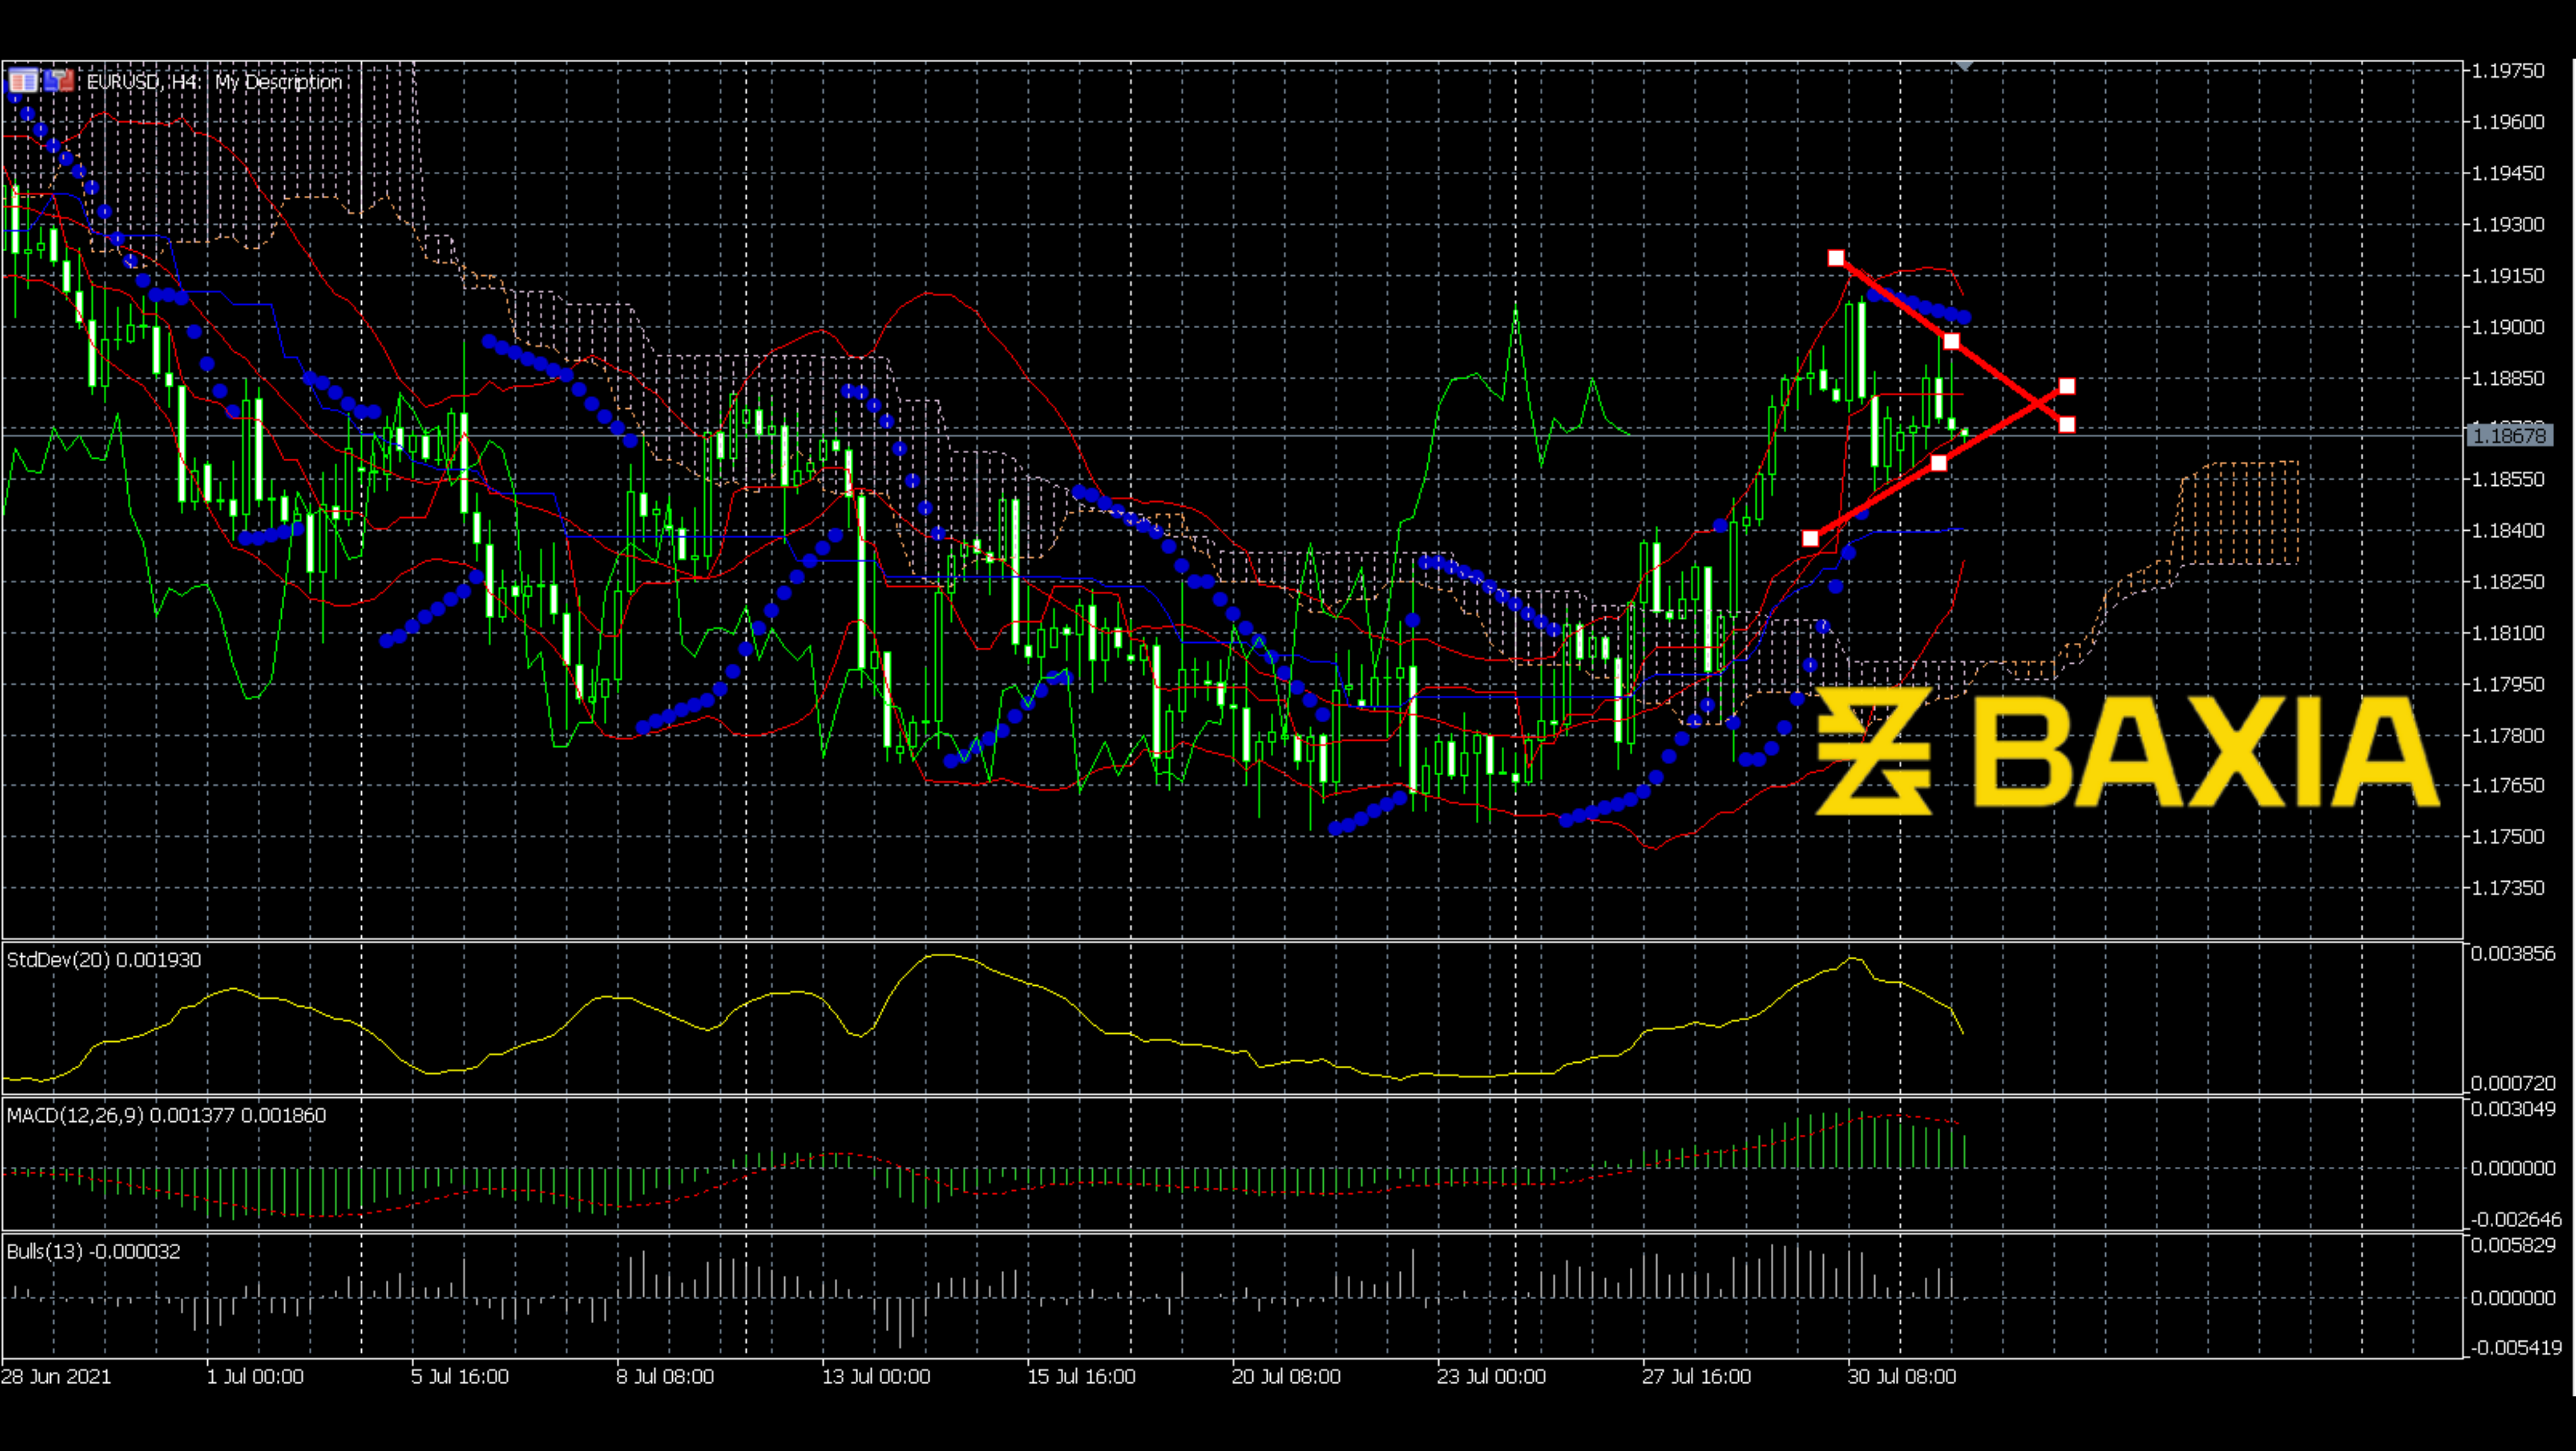
Although the 38.2% level Fibonacci could be a resistant level for the price, we can see the price is still rising. SAR just made a new upward trend. The MACD also made a bullish cross. ATR and Standard Deviation are both going down, which means the trend of the price is getting stable. Ichimoku is also going down, the price could cross the Ichimoku in the near future.
We love to hear new ideas from traders and want to know what you think!
If you like this topic and want to suggest future topics that you find helpful, let us know by clicking the ‘submit your feedback’ button below.

Trading foreign exchange on margin carries a high level of risk, and may not be suitable for all investors. Before deciding to trade foreign exchange you should carefully consider your investment objectives, level of experience, and risk appetite.
Nothing contained in this website should be construed as investment advice. Any reference to an investment's past or potential performance is not, and should not be construed as, a recommendation or as a guarantee of any specific outcome or profit.