
In the intricate tapestry of forex trading, NZDUSD has been a star performer, staging a remarkable bullish rally over the past nine weeks. This upward surge has propelled the currency pair by nearly 600 pips, showcasing the resilience and strength of the New Zealand Dollar against the US Dollar.
However, as markets are dynamic and ever-changing, NZDUSD currently finds itself navigating a phase of correction within the overarching bullish trend. The price action suggests the formation of a descending channel, a common pattern during corrective phases. This correction has retraced approximately 38.2% of the Fibonacci retracement level, providing traders with a valuable gauge of potential support and resistance zones.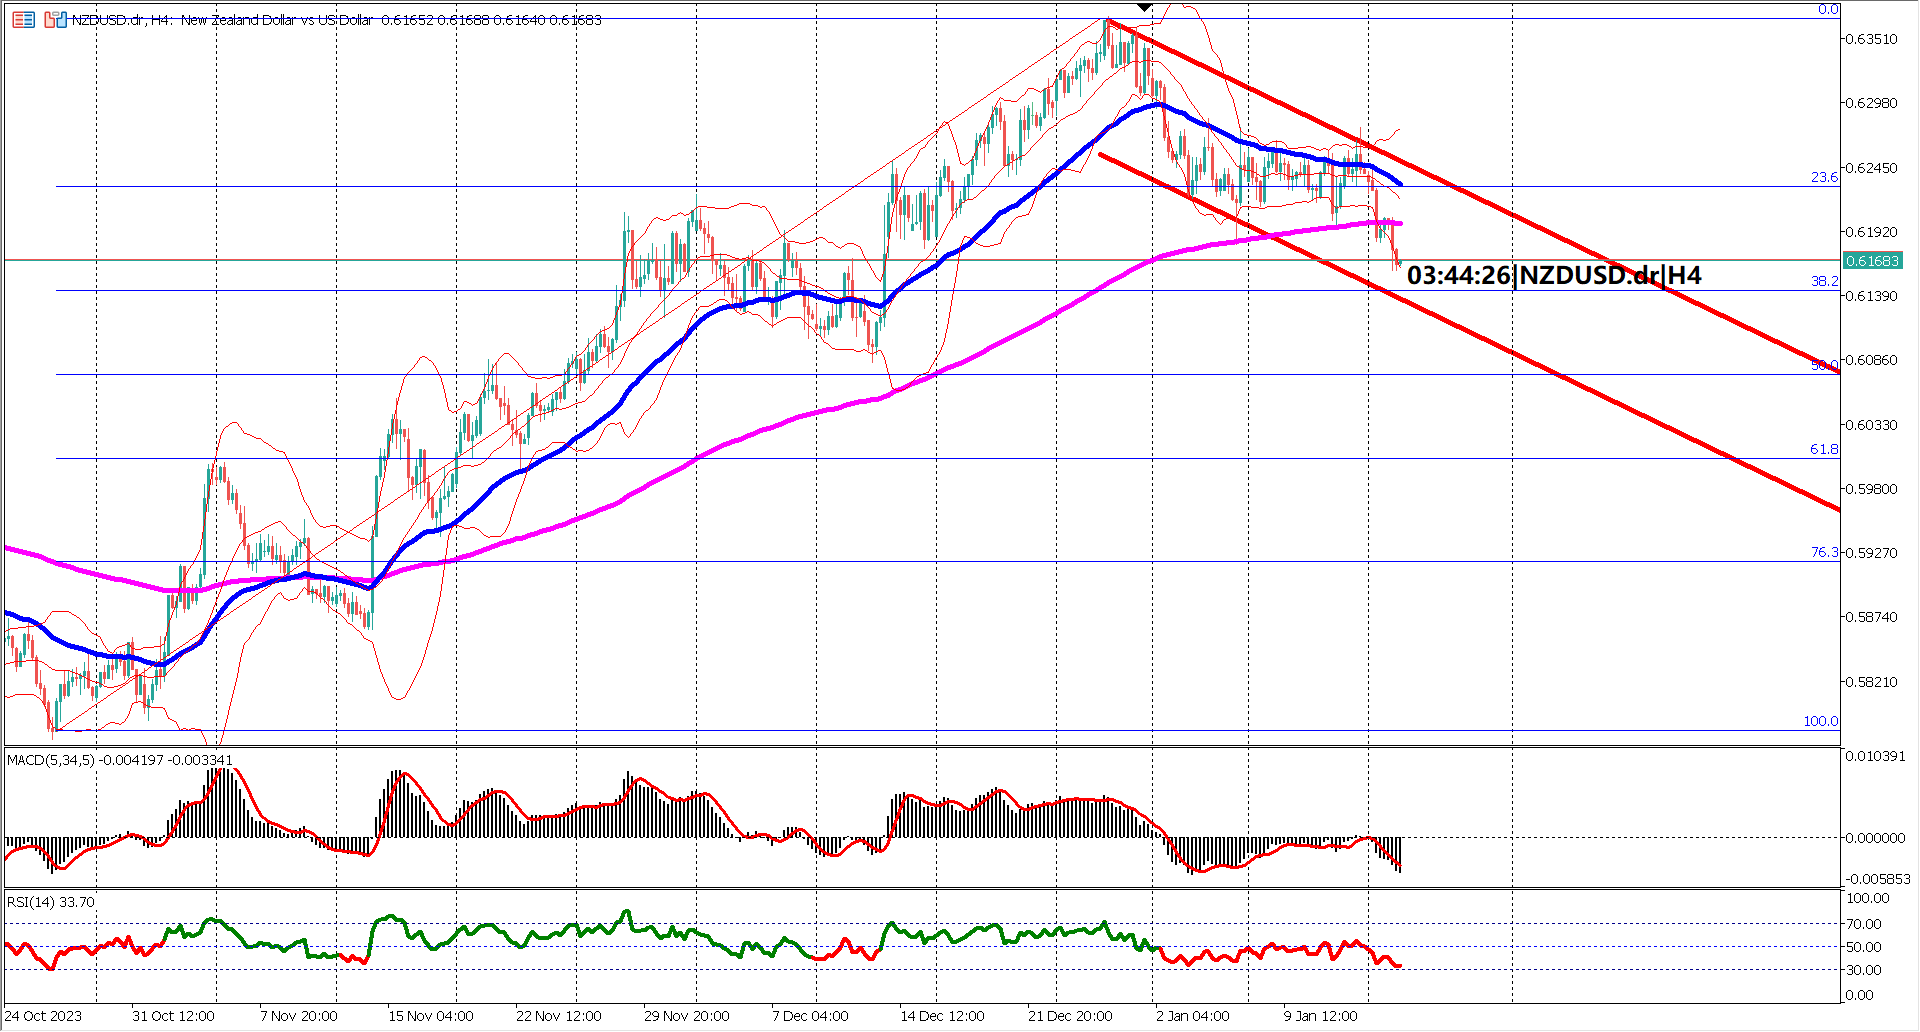
An essential level to keep a keen eye on is the 50% Fibonacci retracement, serving as a pivotal support level. A breach below this juncture could signify a more profound shift in market sentiment, hinting at a possible reversal from the recent bullish trajectory to a bearish one.
Adding another layer of complexity to the analysis, the Exponential Moving Averages (EMA) present a noteworthy development. The EMA 50 is on a trajectory converging towards the EMA 200, on the brink of forming a death cross. A continuation of lower prices that results in the actualization of a death cross might serve as an early signal for a bearish reversal, signaling potential shifts in market dynamics.
Venturing deeper into the technical landscape, the proximity of prices to oversold levels offers an intriguing dimension to the analysis. With prices residing below the EMA 200 and the Relative Strength Index (RSI) edging closer to the 30% threshold, conditions hint at the possibility of an impending bounce or reversal. The formation of a bullish engulfing candlestick pattern, or any bullish reversal candlestick pattern, could play a pivotal role in preventing the formation of a death cross.
In essence, the current juncture for NZDUSD demands a judicious and vigilant approach from traders. Monitoring key support levels, observing the interplay between EMAs, and being attuned to oversold conditions are crucial elements in deciphering the unfolding narrative. As the currency pair traverses through this intricate phase, traders must remain adaptive and discerning to navigate the complexities of the forex market.
Forecast 0.1% vs Previous -0.4%
Forecast -0.3% vs Previous 0.1%

Trading foreign exchange on margin carries a high level of risk, and may not be suitable for all investors. Before deciding to trade foreign exchange you should carefully consider your investment objectives, level of experience, and risk appetite.
Nothing contained in this website should be construed as investment advice. Any reference to an investment's past or potential performance is not, and should not be construed as, a recommendation or as a guarantee of any specific outcome or profit.