
The previous downward trend had lasted for thirteen days. The downward trend had been sharp at the beginning; then, the slope turned mild. After that, the price stopped at 1.2493 on Sep 3rd, where the price line broke the lower Bollinger Bands.
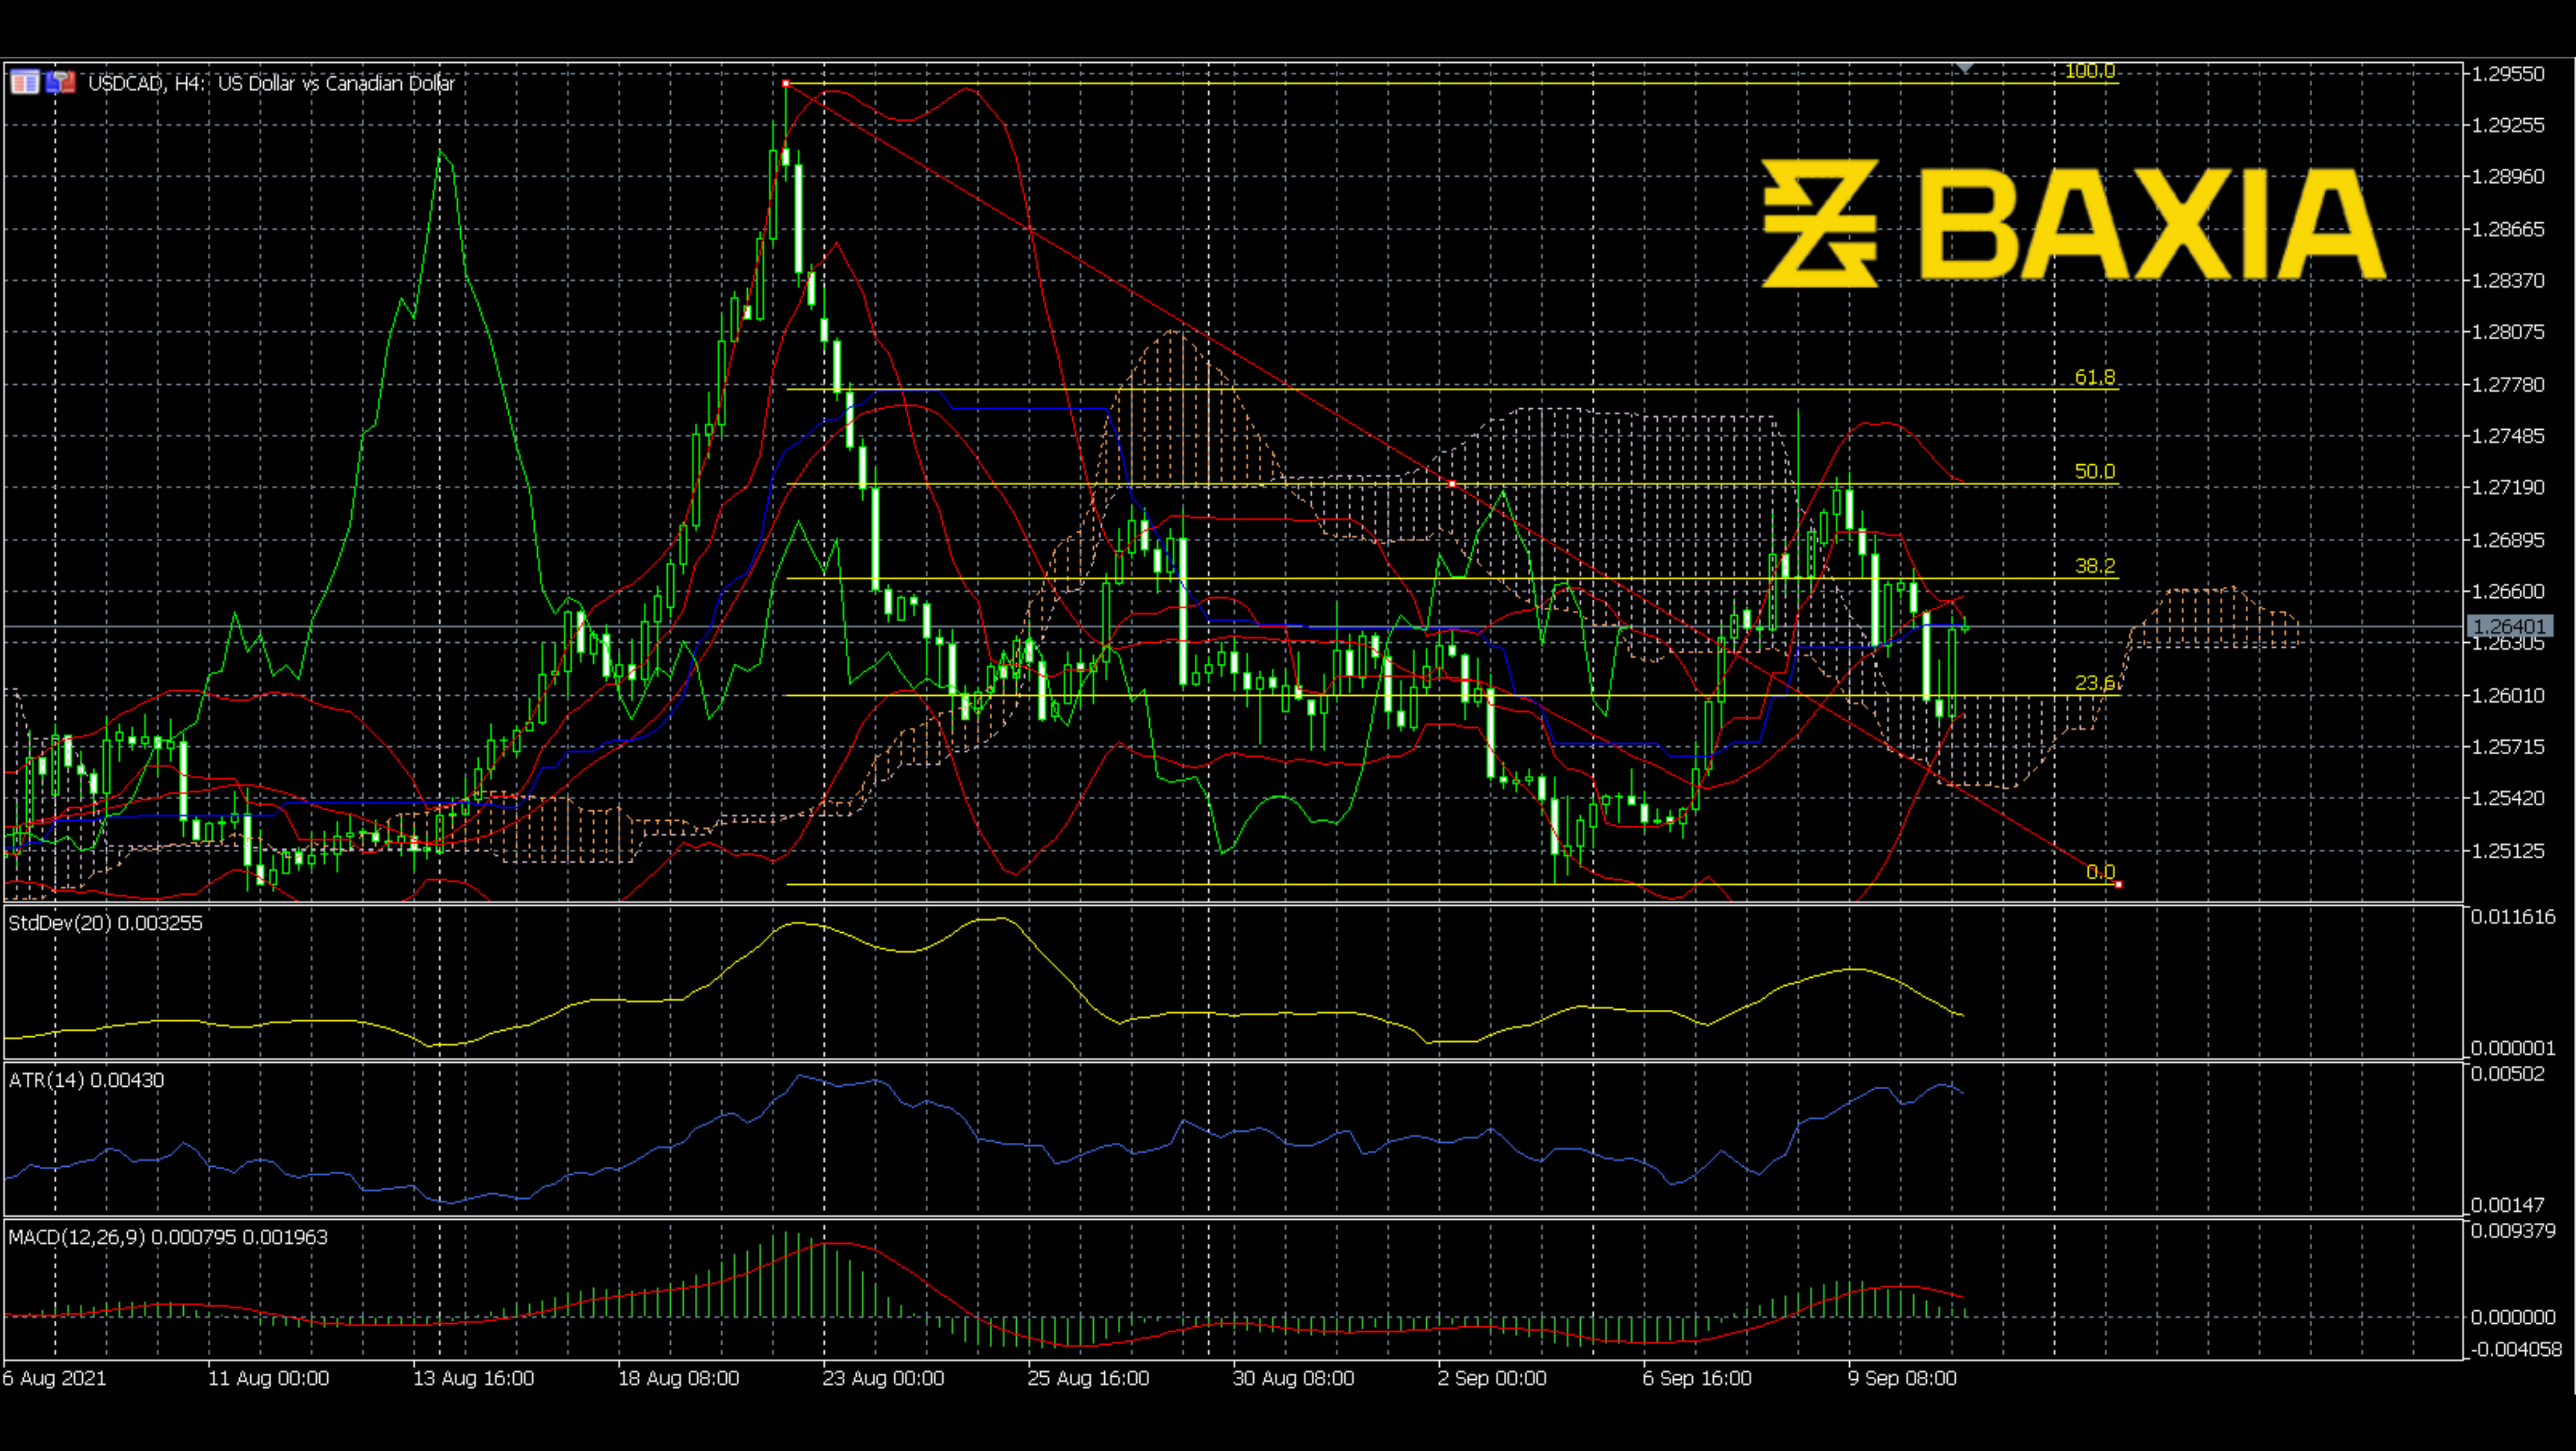
Although the price bounced up, the price touched the 50% Fibonacci level and turned down. This process was considered a retracement. Now, the price has turned down again since Sep 9th. Will this downward trend continue?
As can be seen from the plot, the Ichimoku clouds twist with the price line, so it is hard to see a signal here. The Bollinger Bands shrunk, which means fluctuations may come. MACD made a bearish cross earlier; now, the angle is still sharp. ATR went up to a high level, which shows the same signal as Bollinger Bands.
We love to hear new ideas from traders and want to know what you think!
If you like this topic and want to suggest future topics that you find helpful, let us know by clicking the ‘submit your feedback’ button below.

Trading foreign exchange on margin carries a high level of risk, and may not be suitable for all investors. Before deciding to trade foreign exchange you should carefully consider your investment objectives, level of experience, and risk appetite.
Nothing contained in this website should be construed as investment advice. Any reference to an investment's past or potential performance is not, and should not be construed as, a recommendation or as a guarantee of any specific outcome or profit.