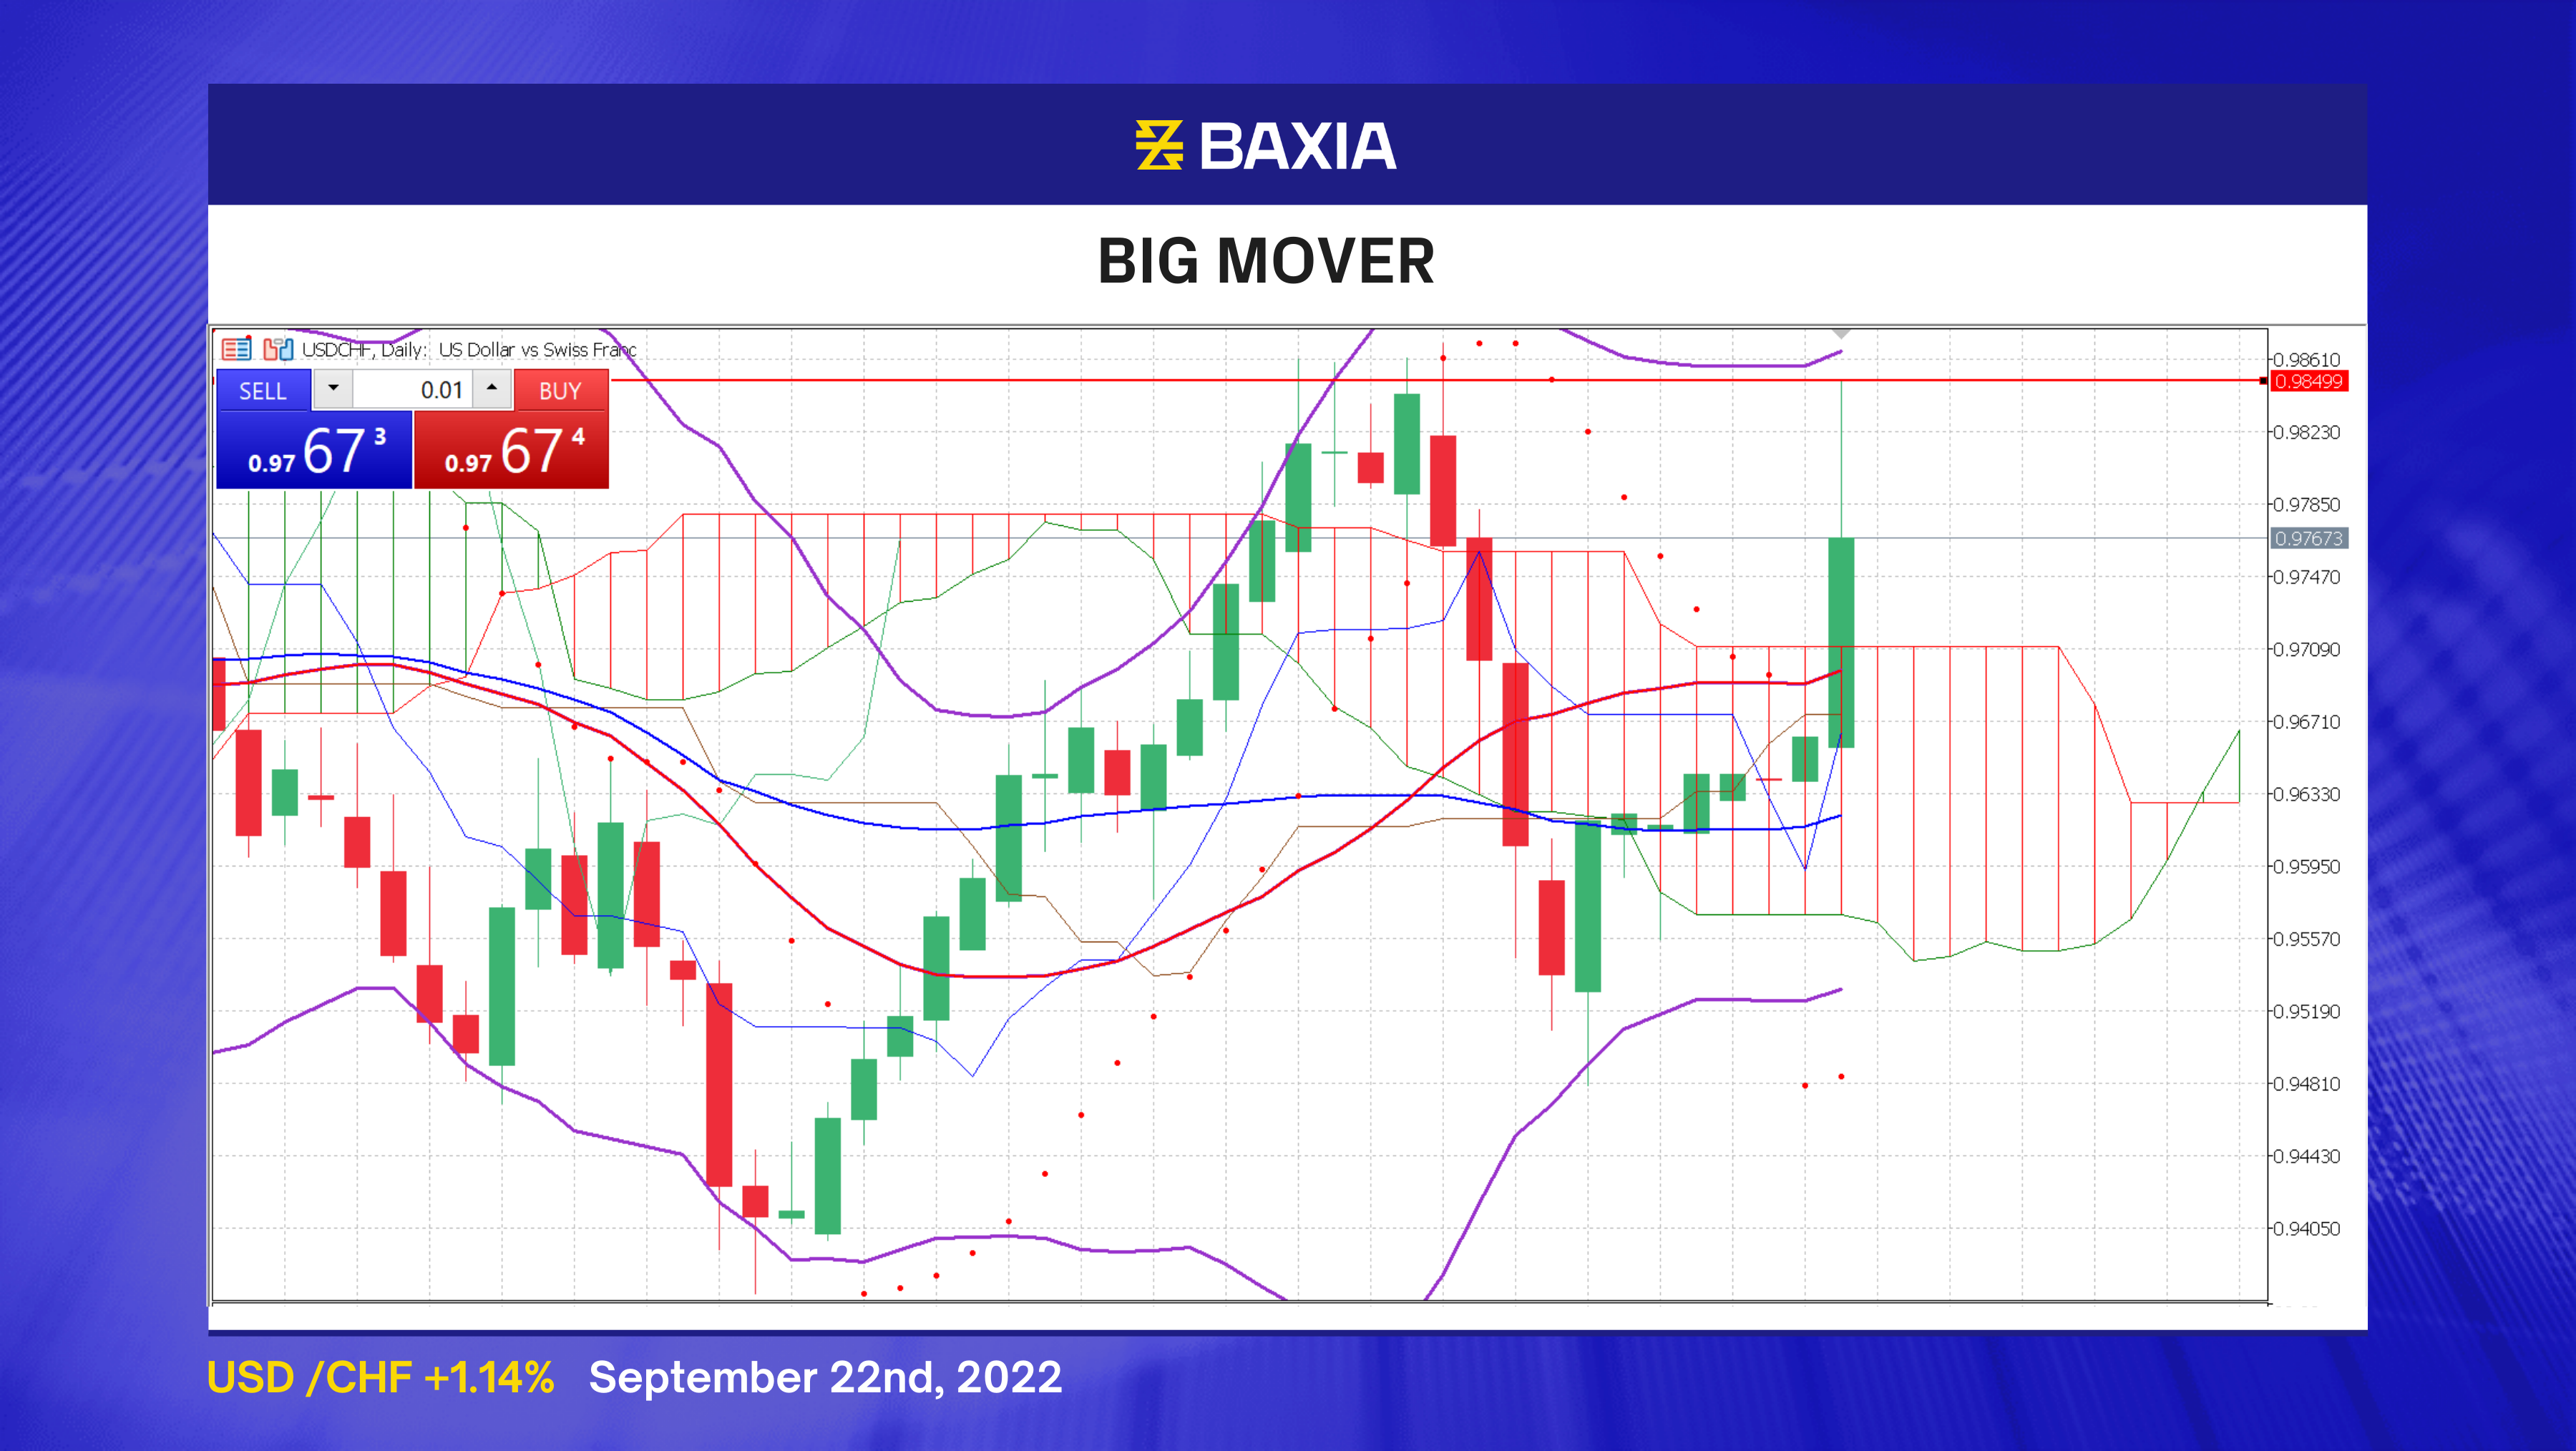

As can be seen from the 4-hour chart, the price has risen by 2.6% in seven days. This jump began on Sep 22nd, where the Bollinger Bands did not make any significant moves. Although the Ichimoku became thin and twisted with the price line, the situation lasted for a while. So there was no signal warning for this spurt upwards; it was too abrupt.
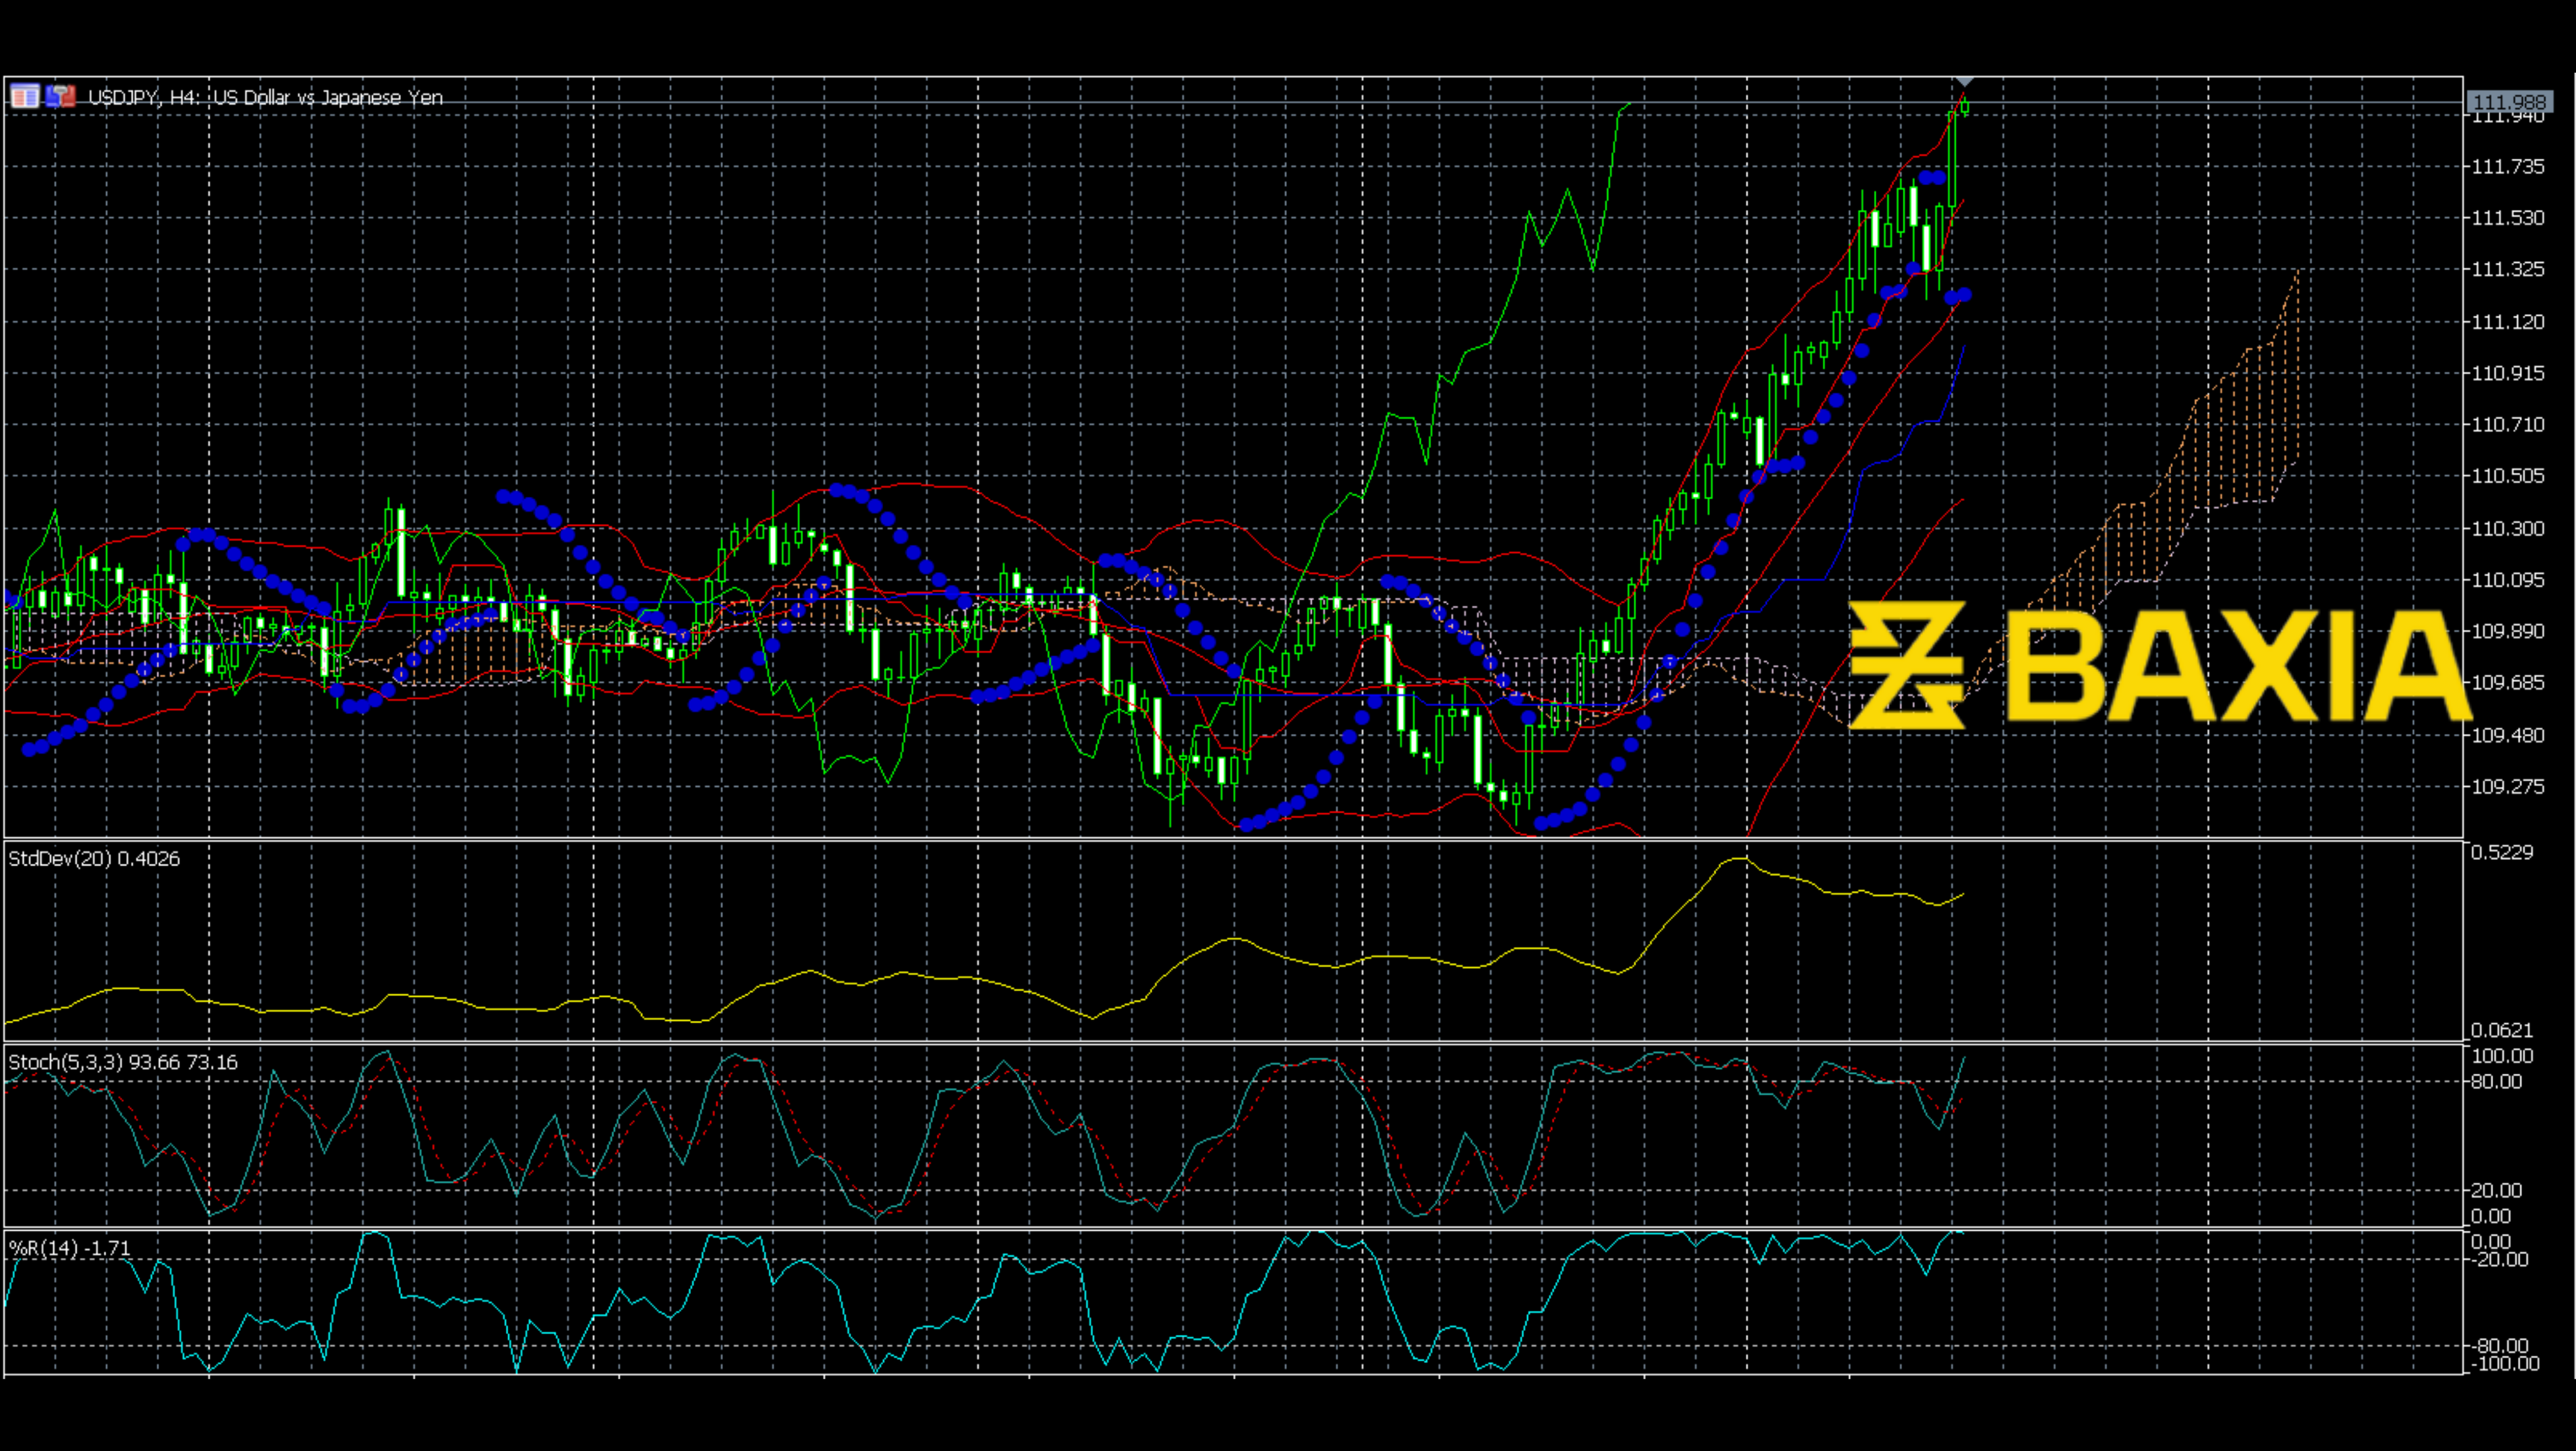
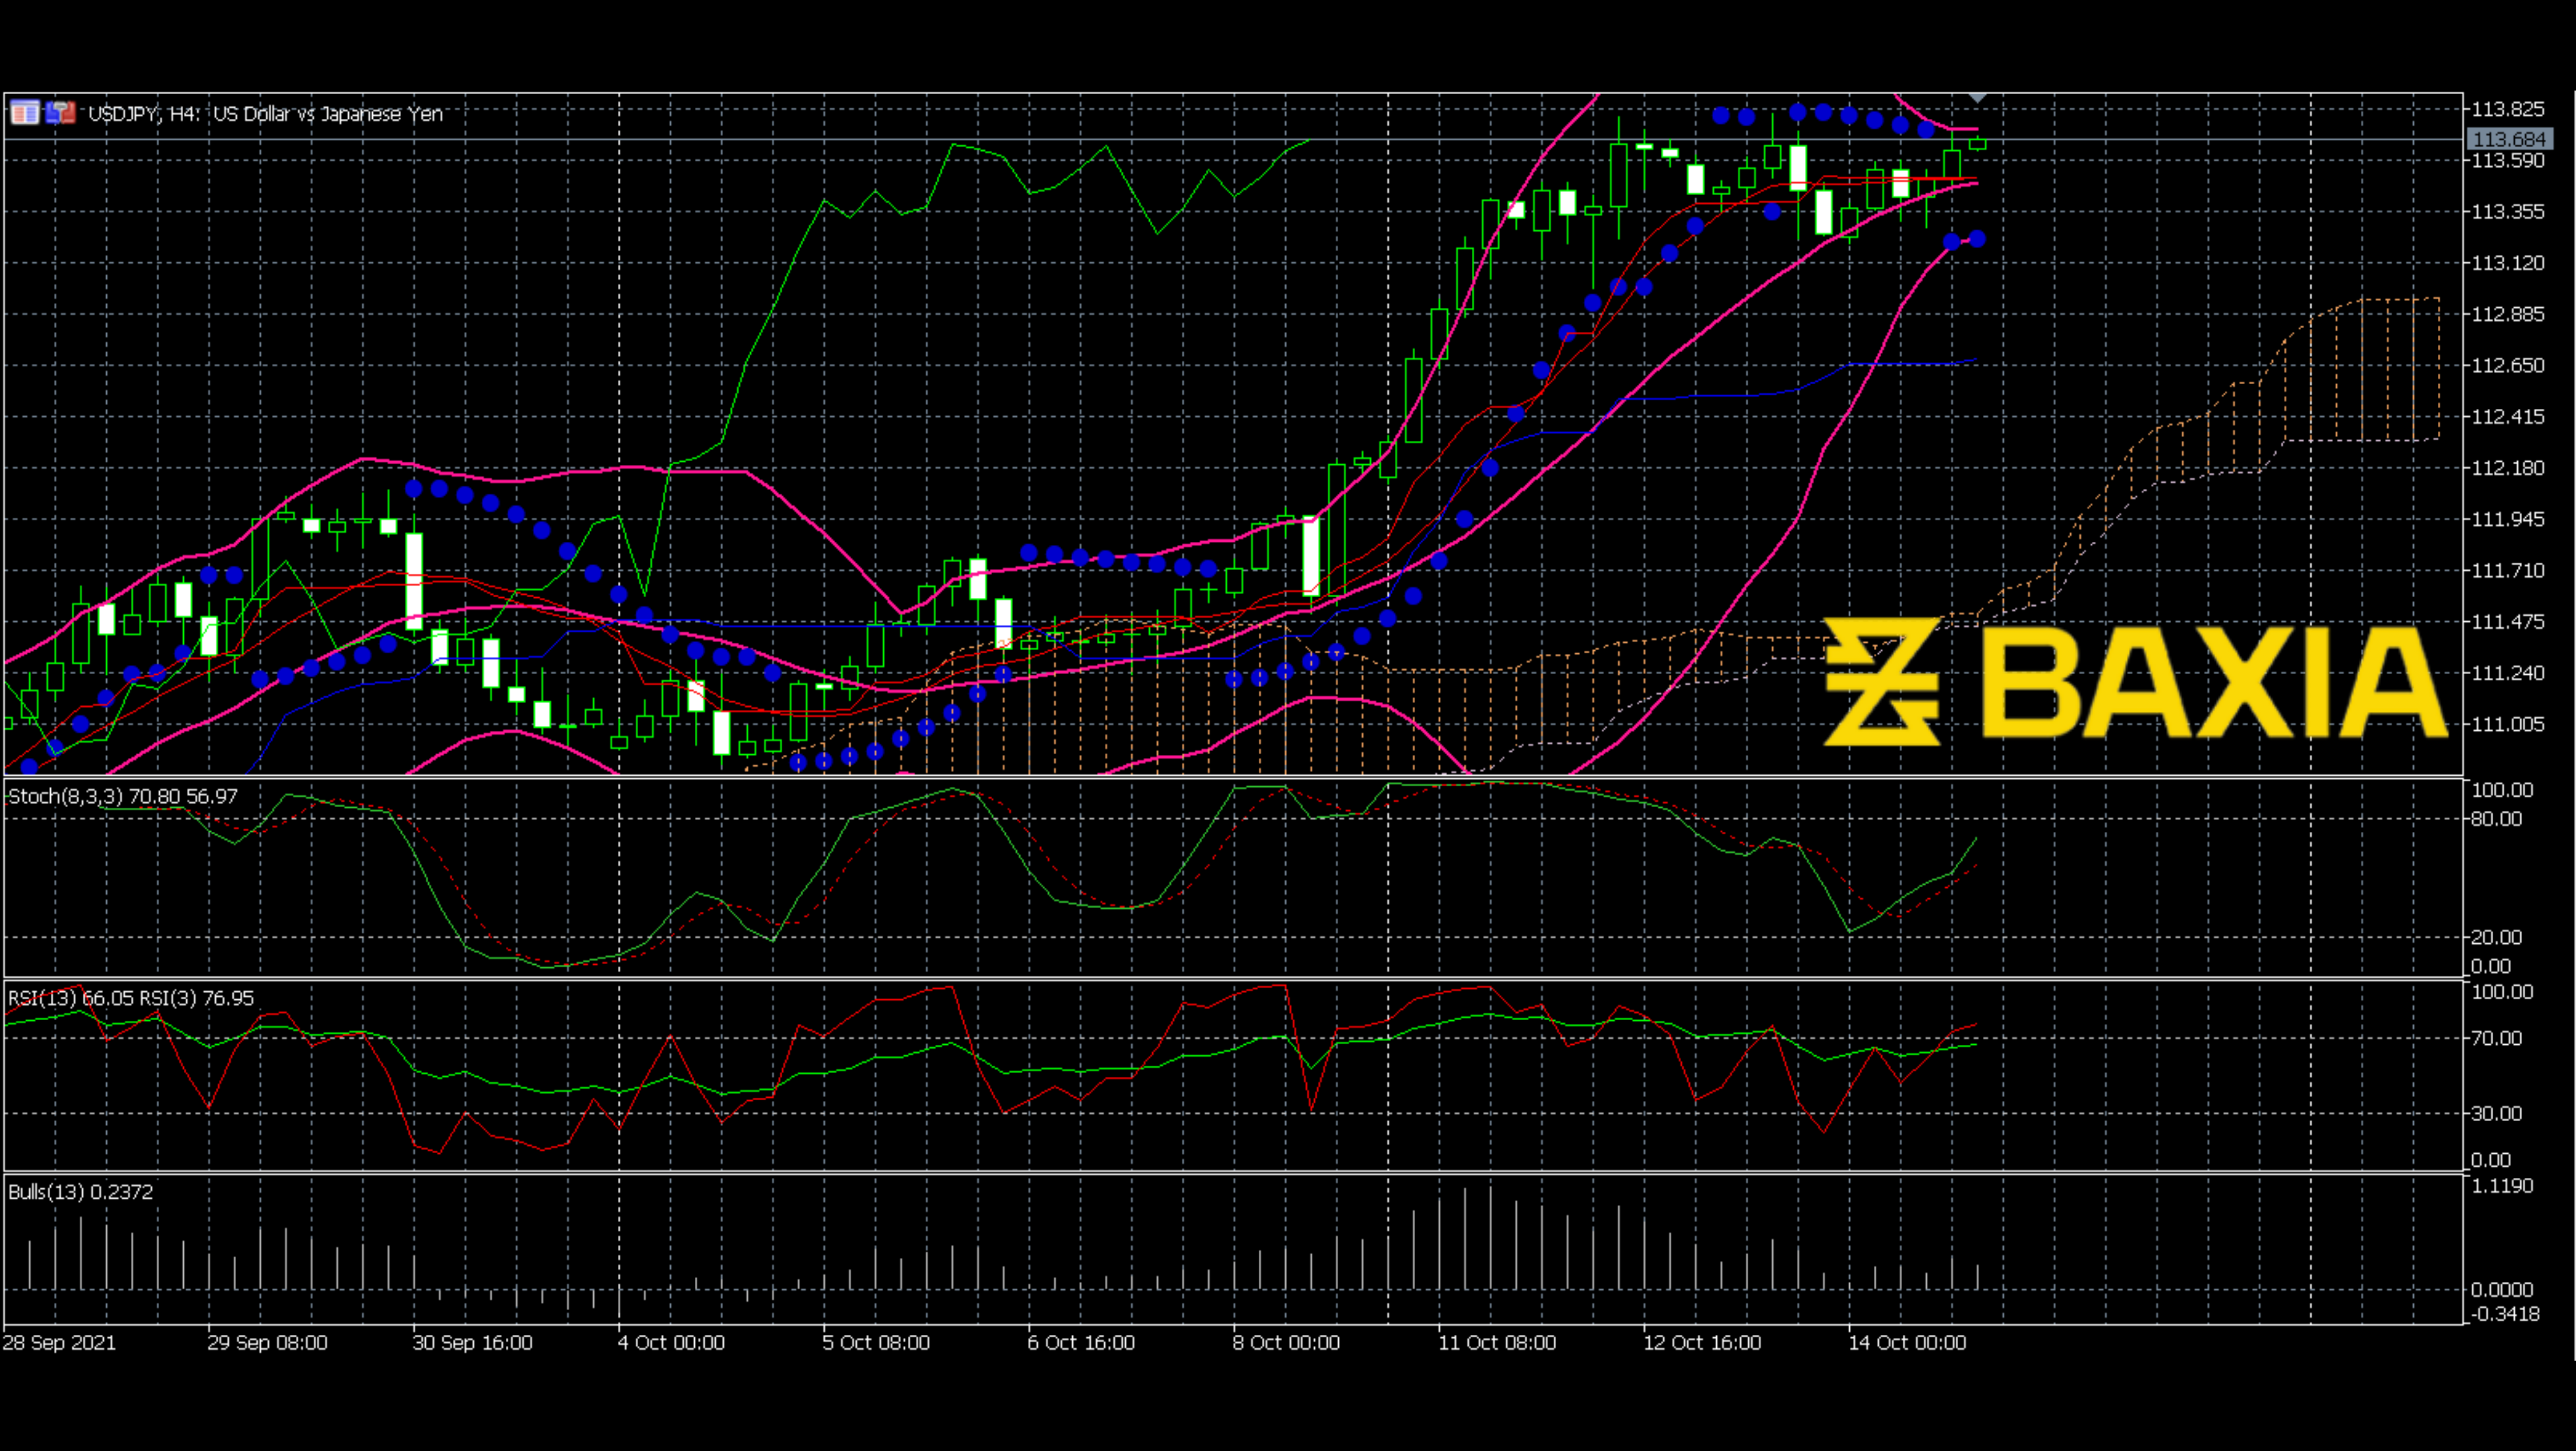
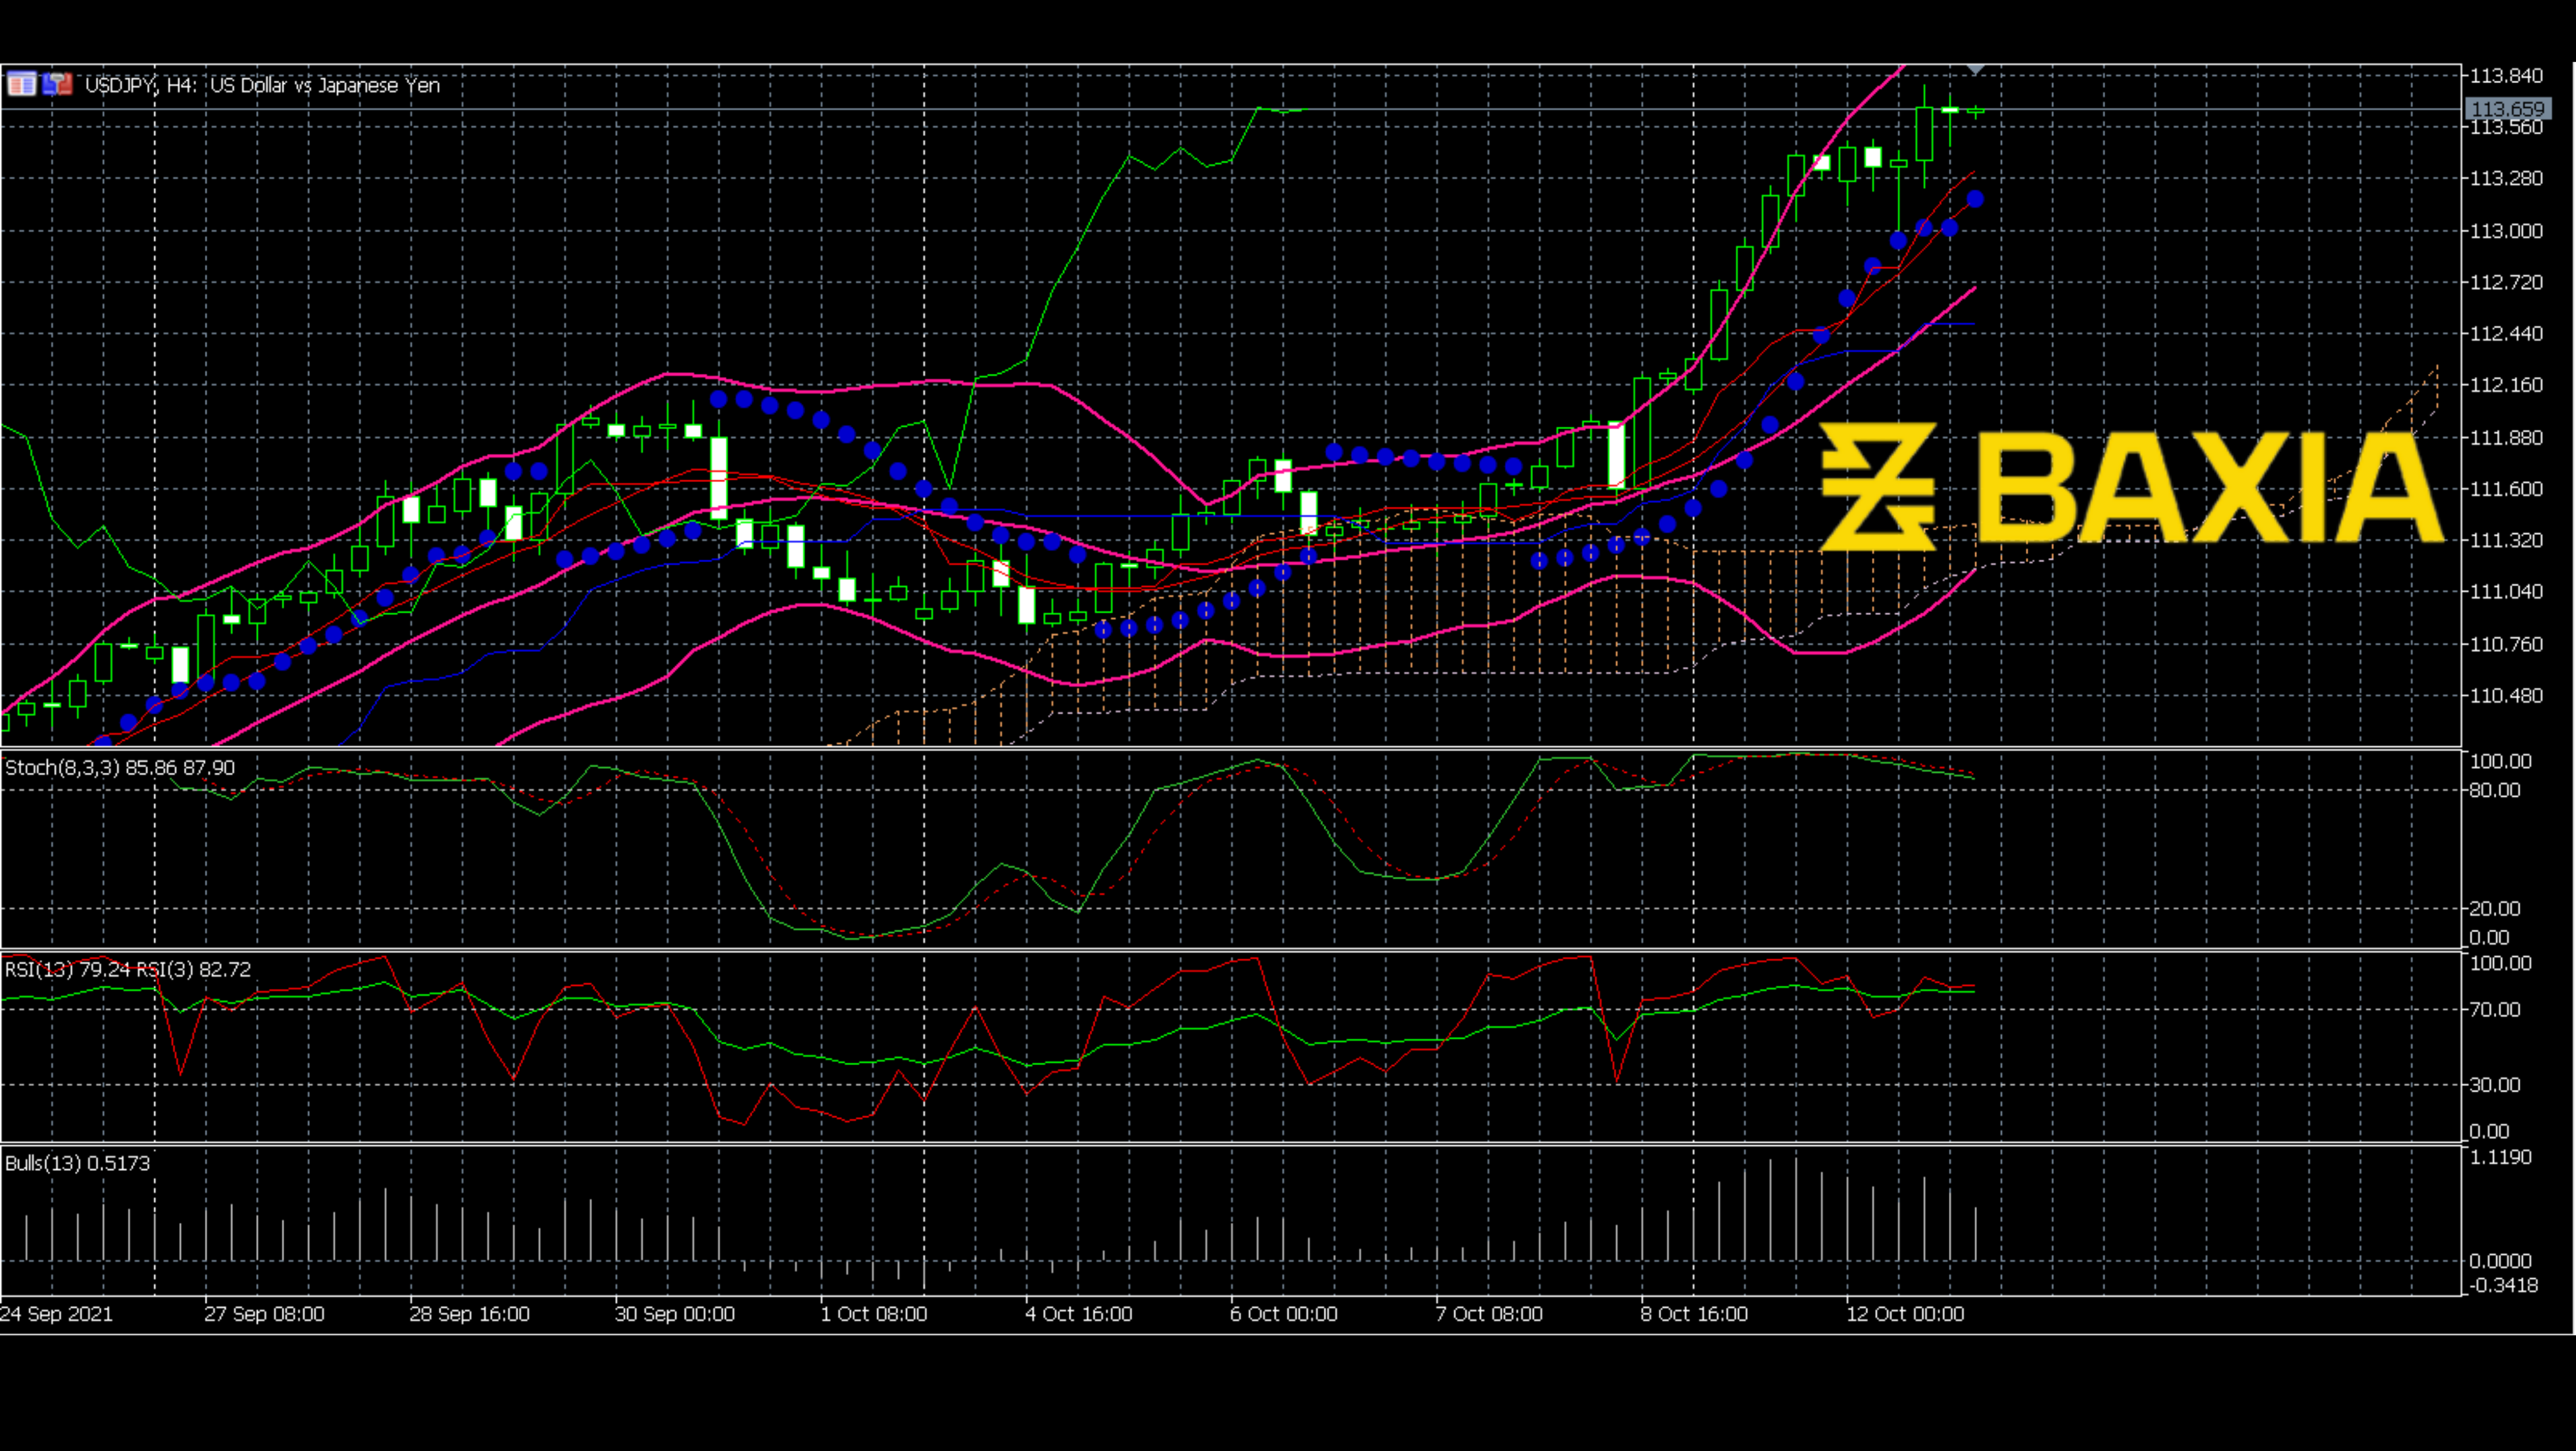
The move up is continuing. The price even reached 112.049. So, will this condition last? I would say it could. Although the Stochastics and Williams R% have already been overbought since the beginning of this move, the price kept going up, and the indicators remain overbought. Ichimoku has gone up and thickened; however, it still has not caught up with the price line; also, when the Ichimoku becomes thick, the price may continue in the same direction. The Parabolic SAR has been making a stable upward trend, which means this upward trend has become a “mild” trend to the SAR.
We love to hear new ideas from traders and want to know what you think!
If you like this topic and want to suggest future topics that you find helpful, let us know by clicking the ‘submit your feedback’ button below.

Trading foreign exchange on margin carries a high level of risk, and may not be suitable for all investors. Before deciding to trade foreign exchange you should carefully consider your investment objectives, level of experience, and risk appetite.
Nothing contained in this website should be construed as investment advice. Any reference to an investment's past or potential performance is not, and should not be construed as, a recommendation or as a guarantee of any specific outcome or profit.