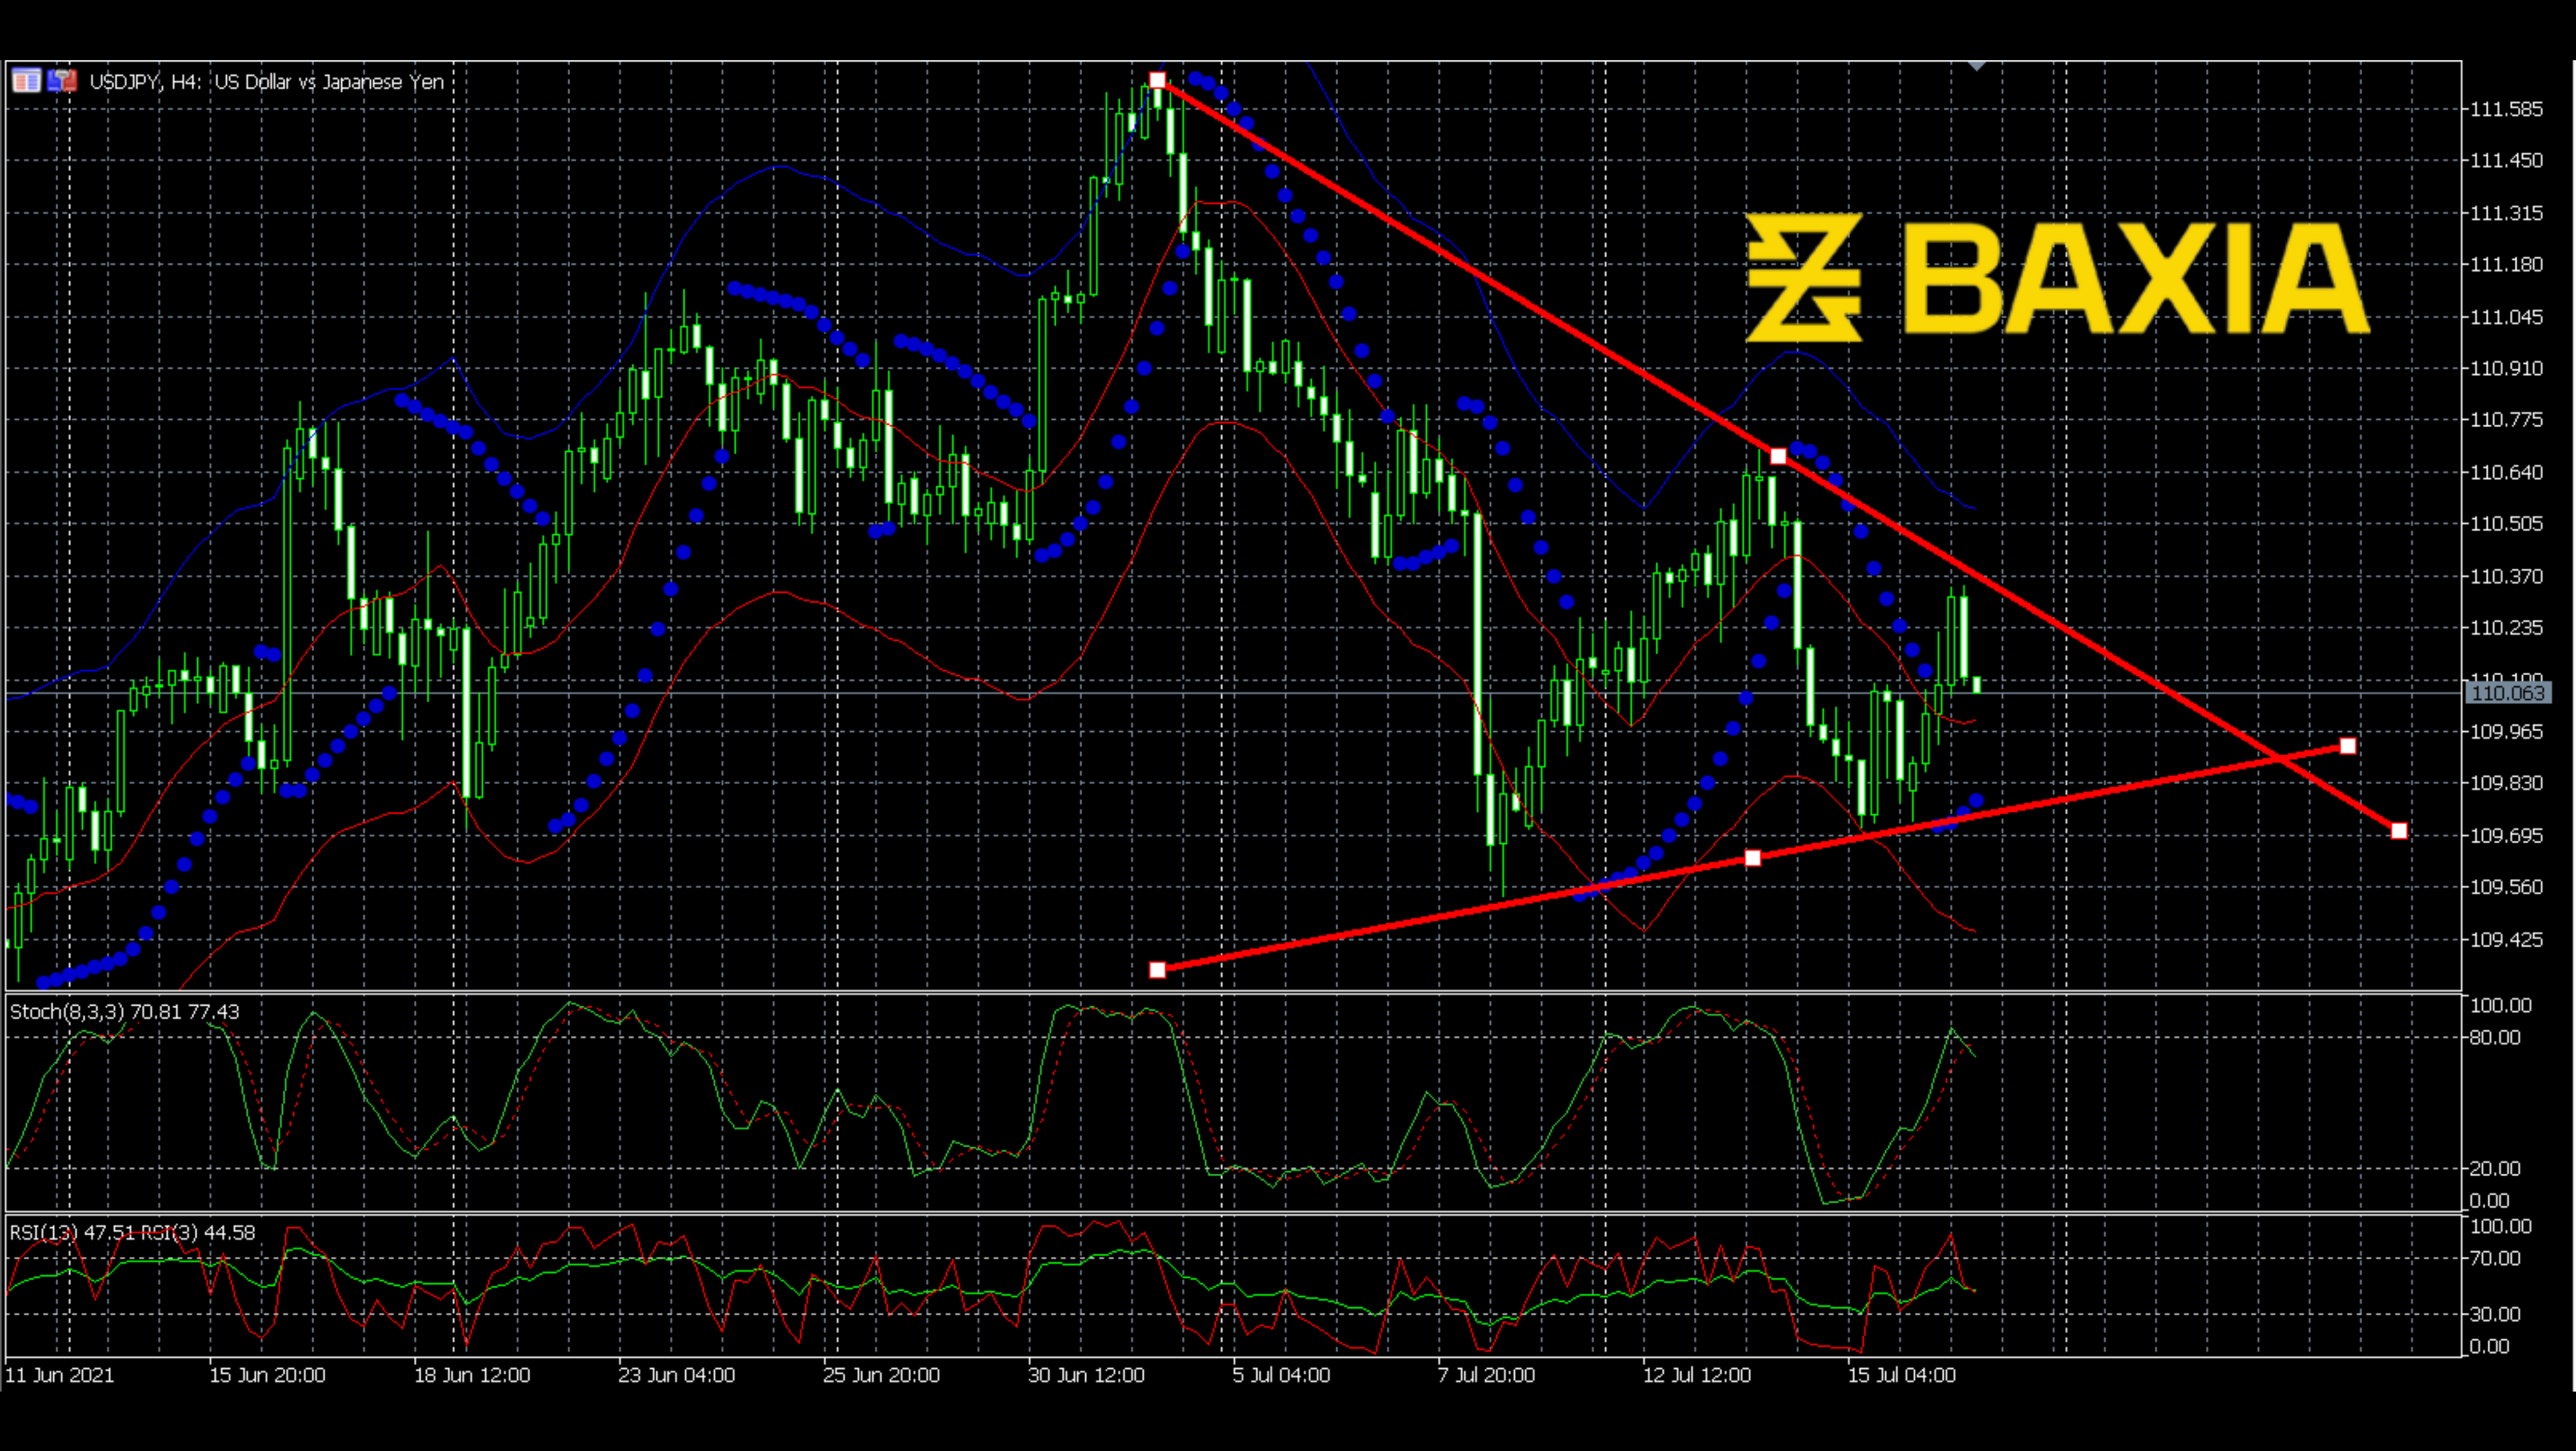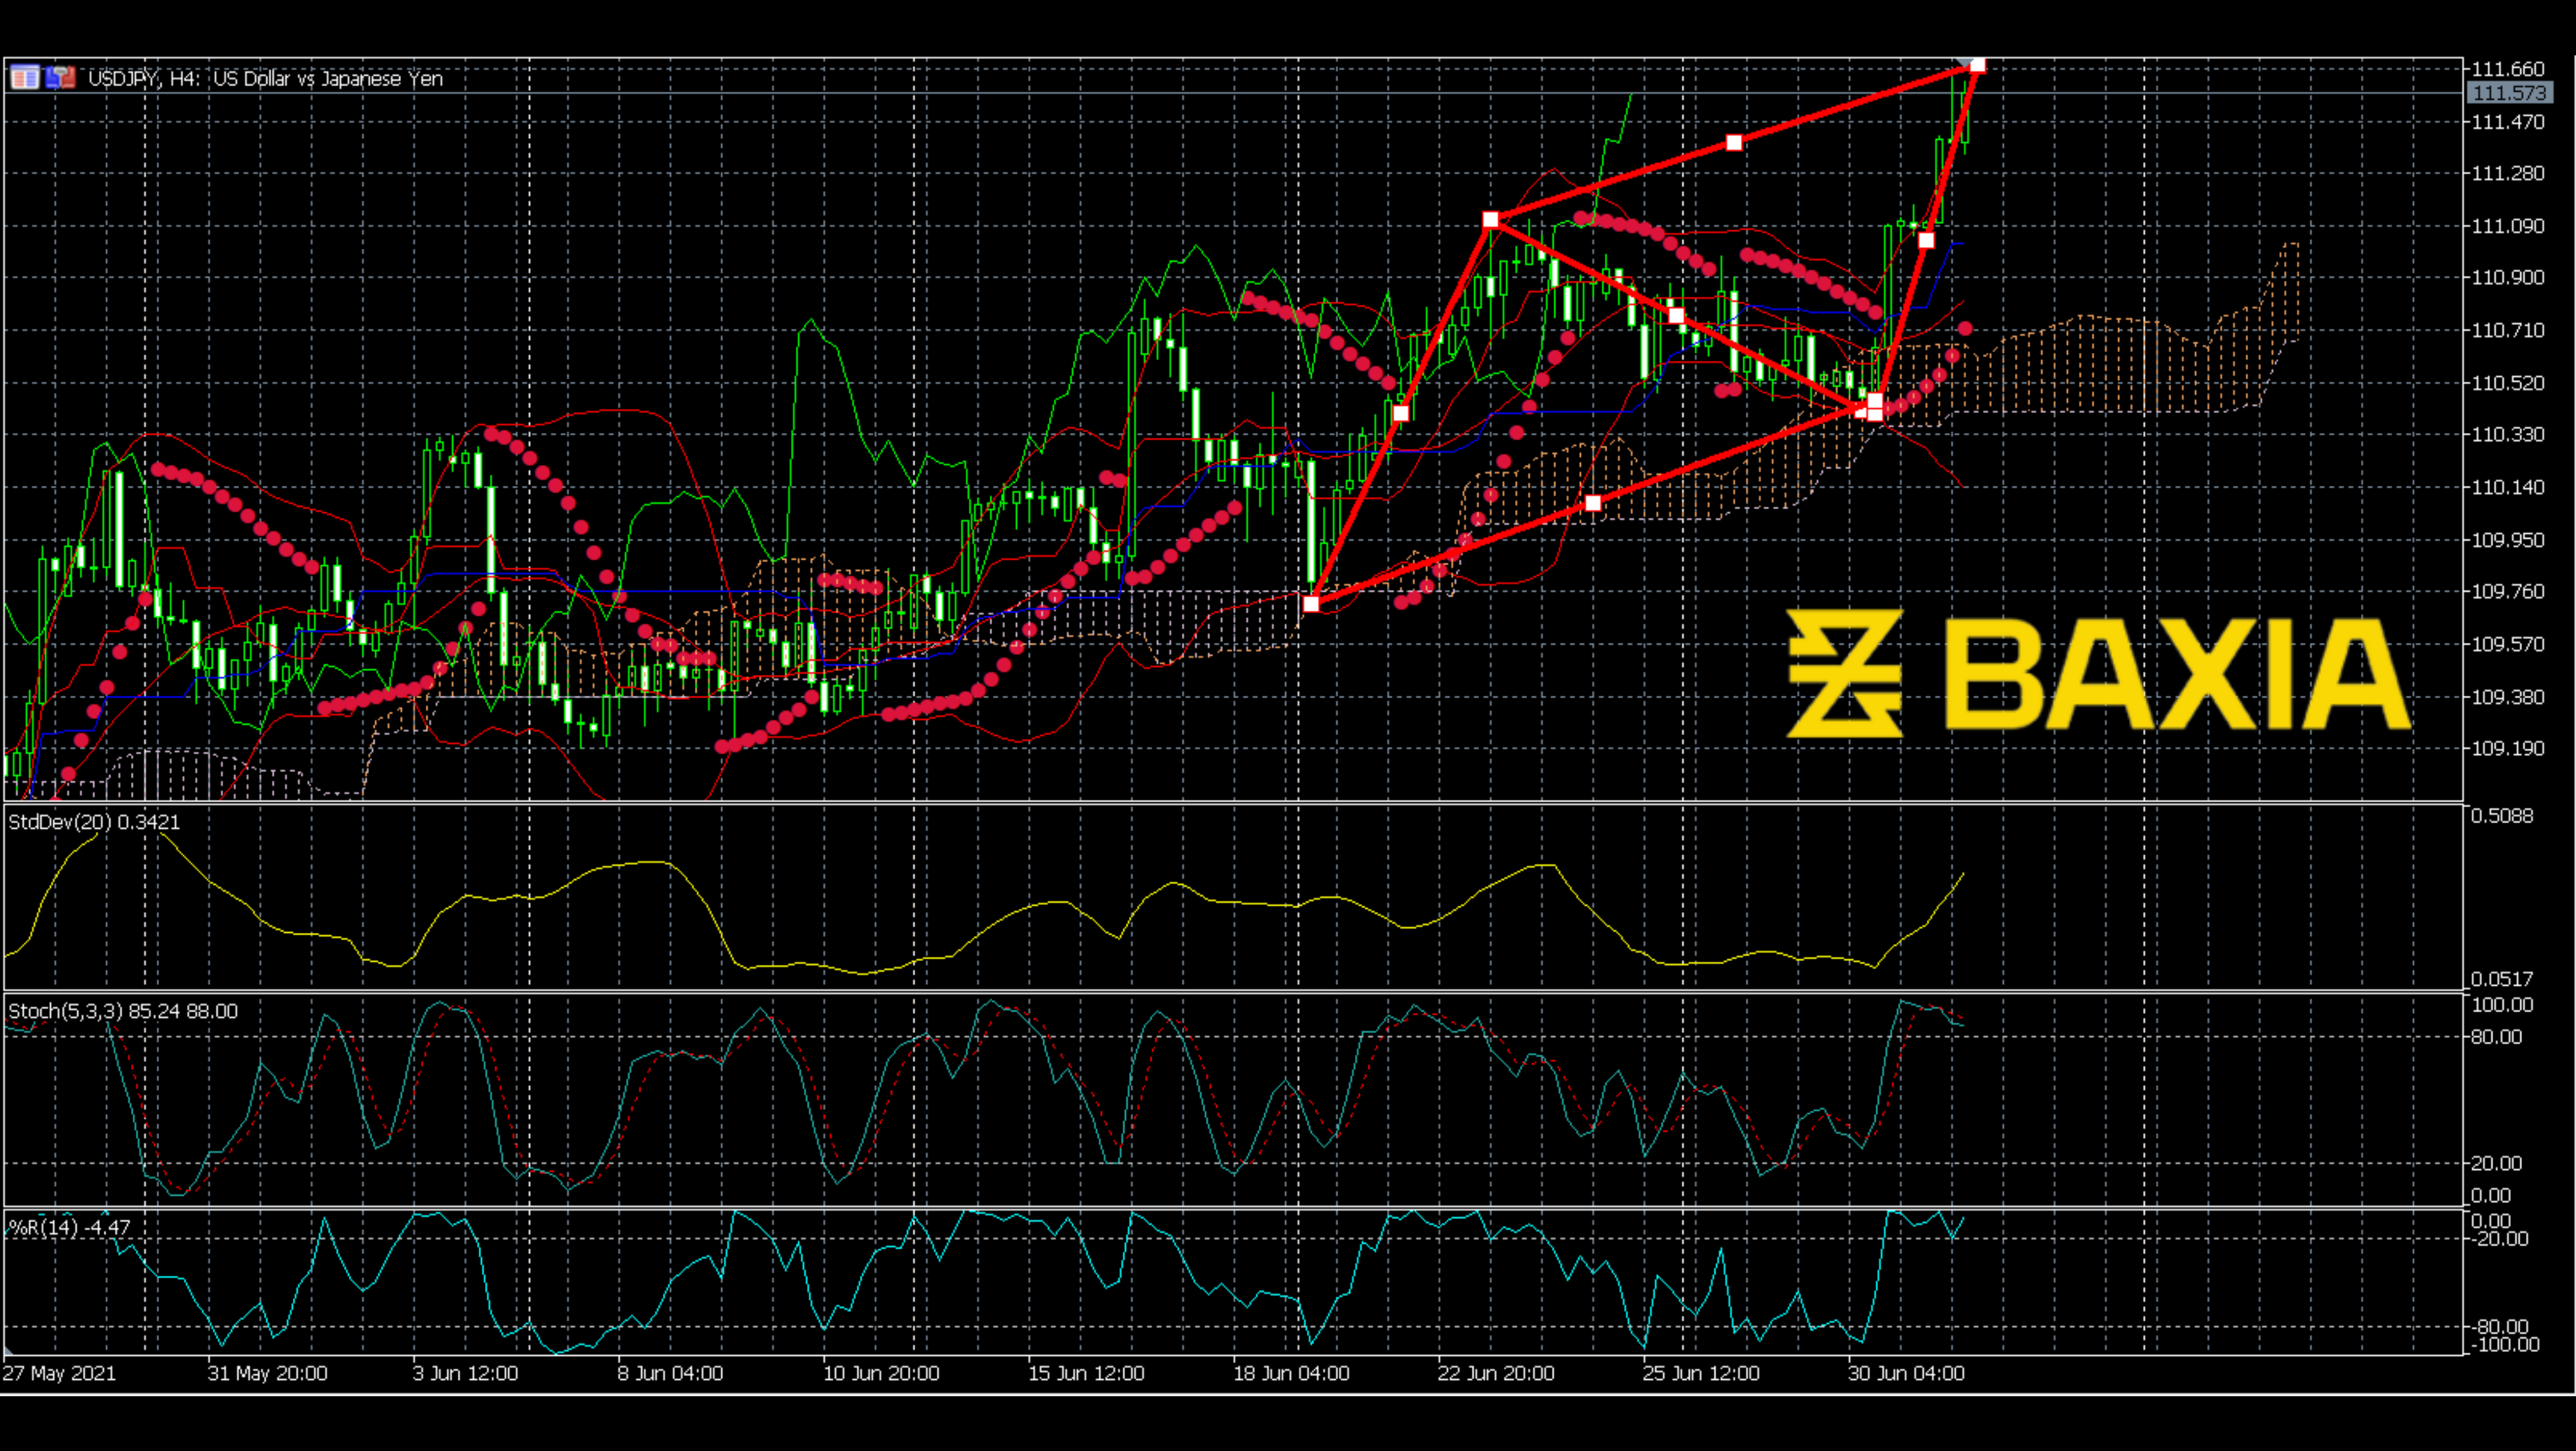

From the 4 hour chart, we can see that the price has been hovering around 109.768 for fifteen days. During these fifteen days, the fluctuation has become smaller and smaller; then, we saw a pennant pattern emerge. As we all know, the pennant pattern is a breakout signal, which means if we see a pennant pattern here, a breakout could be near.
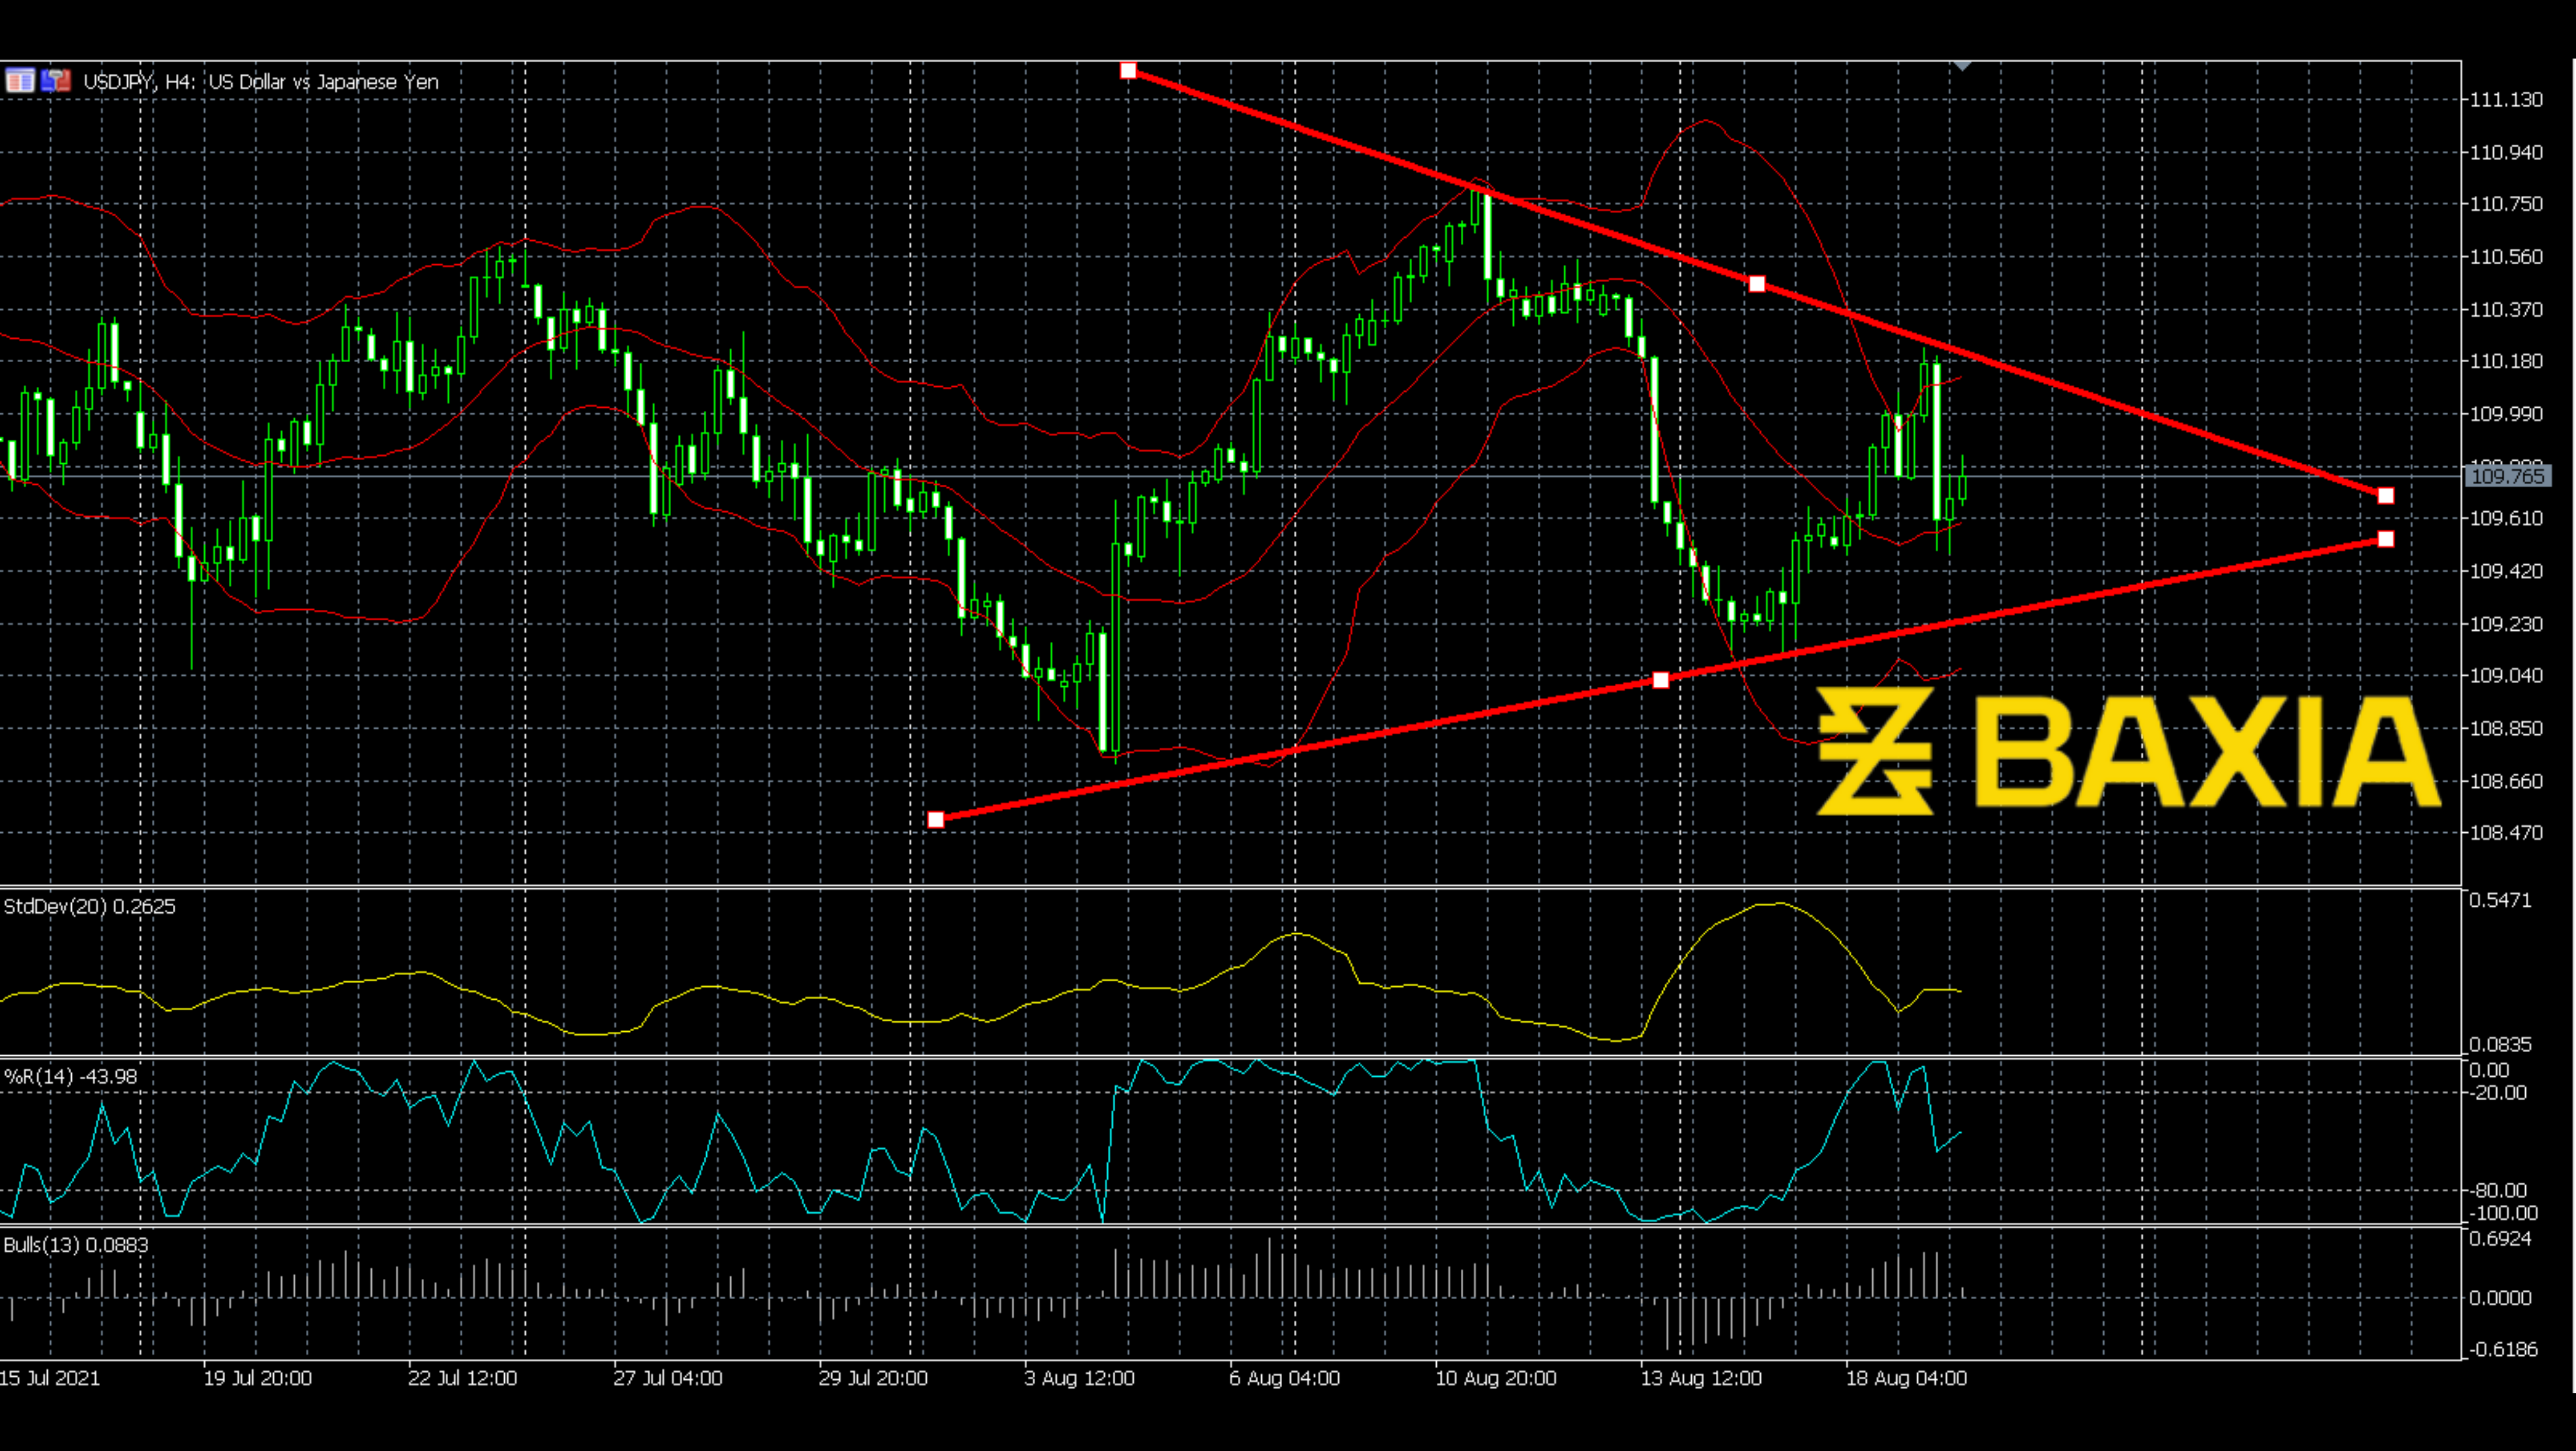
William R% stays at an average level, which is good for preparing breakout. And Standard Deviation is in the middle level; it just went down from a peak. So we can say that this means the price comparatively fluctuates less in recent times, which tells us the price is ready for another wave.
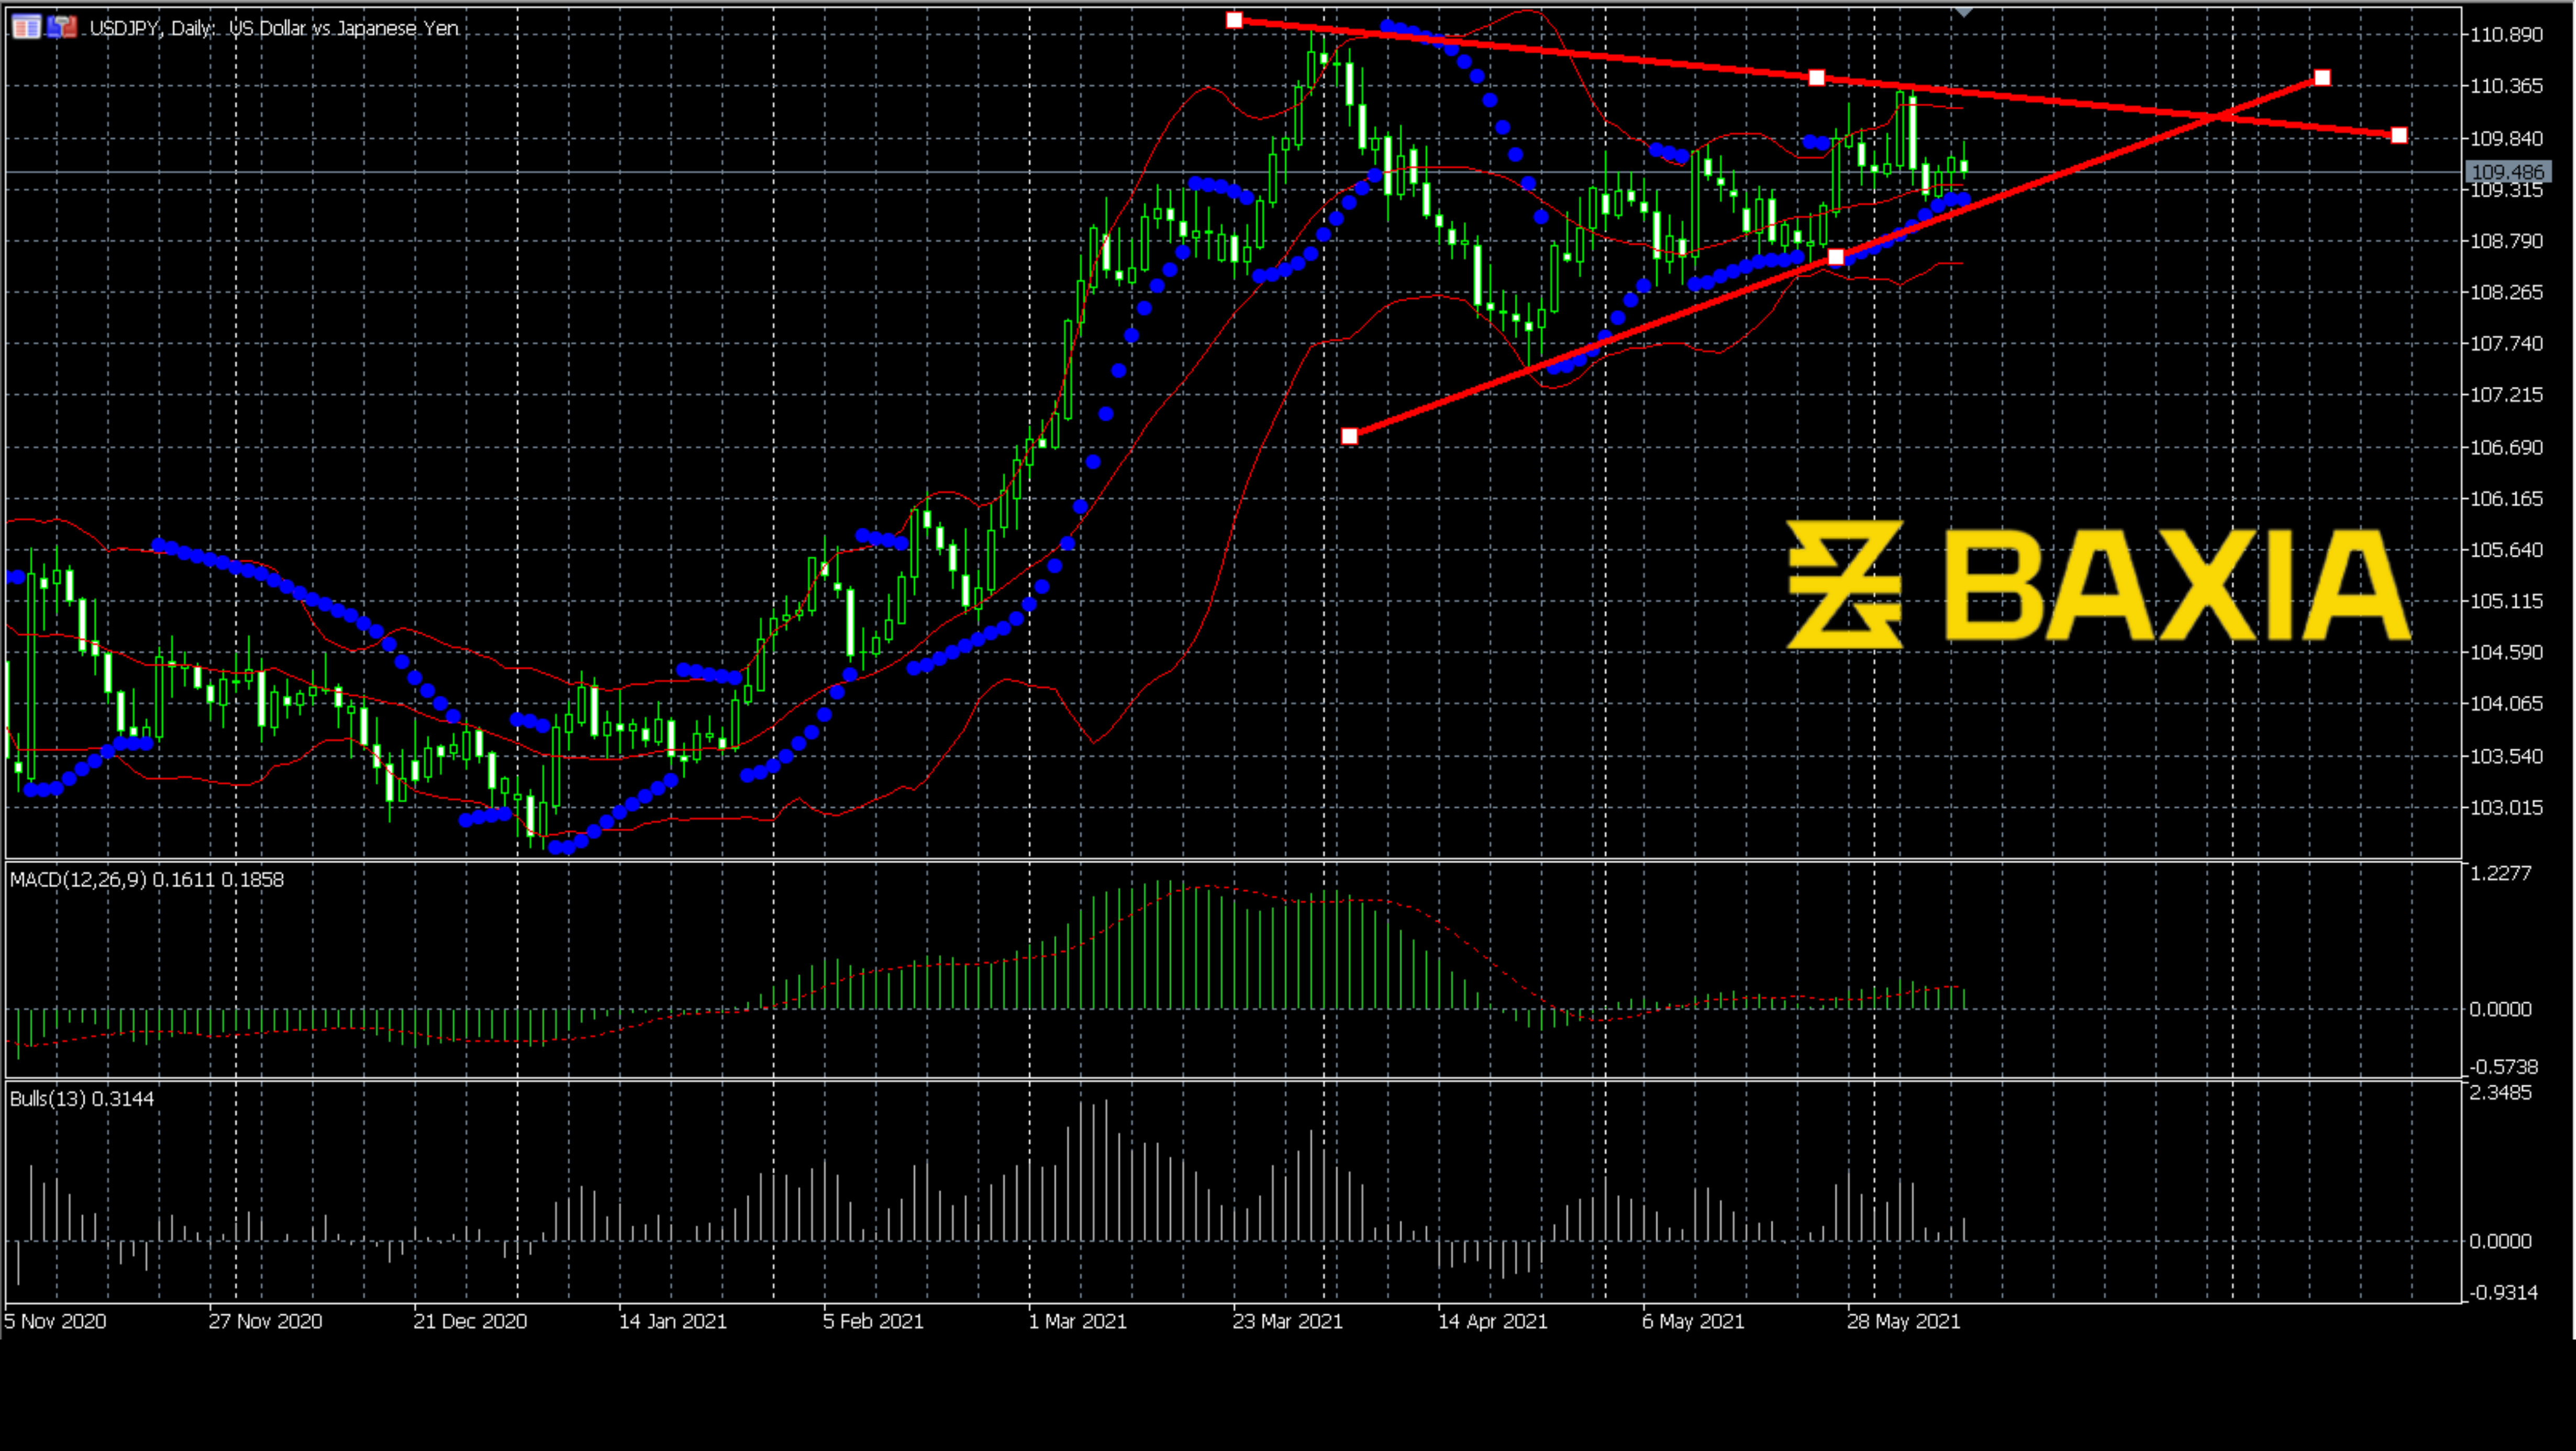
The direction of a pennant breakout always depends on the previous trend. If we see the big picture like the daily chart or the weekly chart, the price is upward. So for now, we can expect that the price would break up.
We love to hear new ideas from traders and want to know what you think!
If you like this topic and want to suggest future topics that you find helpful, let us know by clicking the ‘submit your feedback’ button below.

Trading foreign exchange on margin carries a high level of risk, and may not be suitable for all investors. Before deciding to trade foreign exchange you should carefully consider your investment objectives, level of experience, and risk appetite.
Nothing contained in this website should be construed as investment advice. Any reference to an investment's past or potential performance is not, and should not be construed as, a recommendation or as a guarantee of any specific outcome or profit.