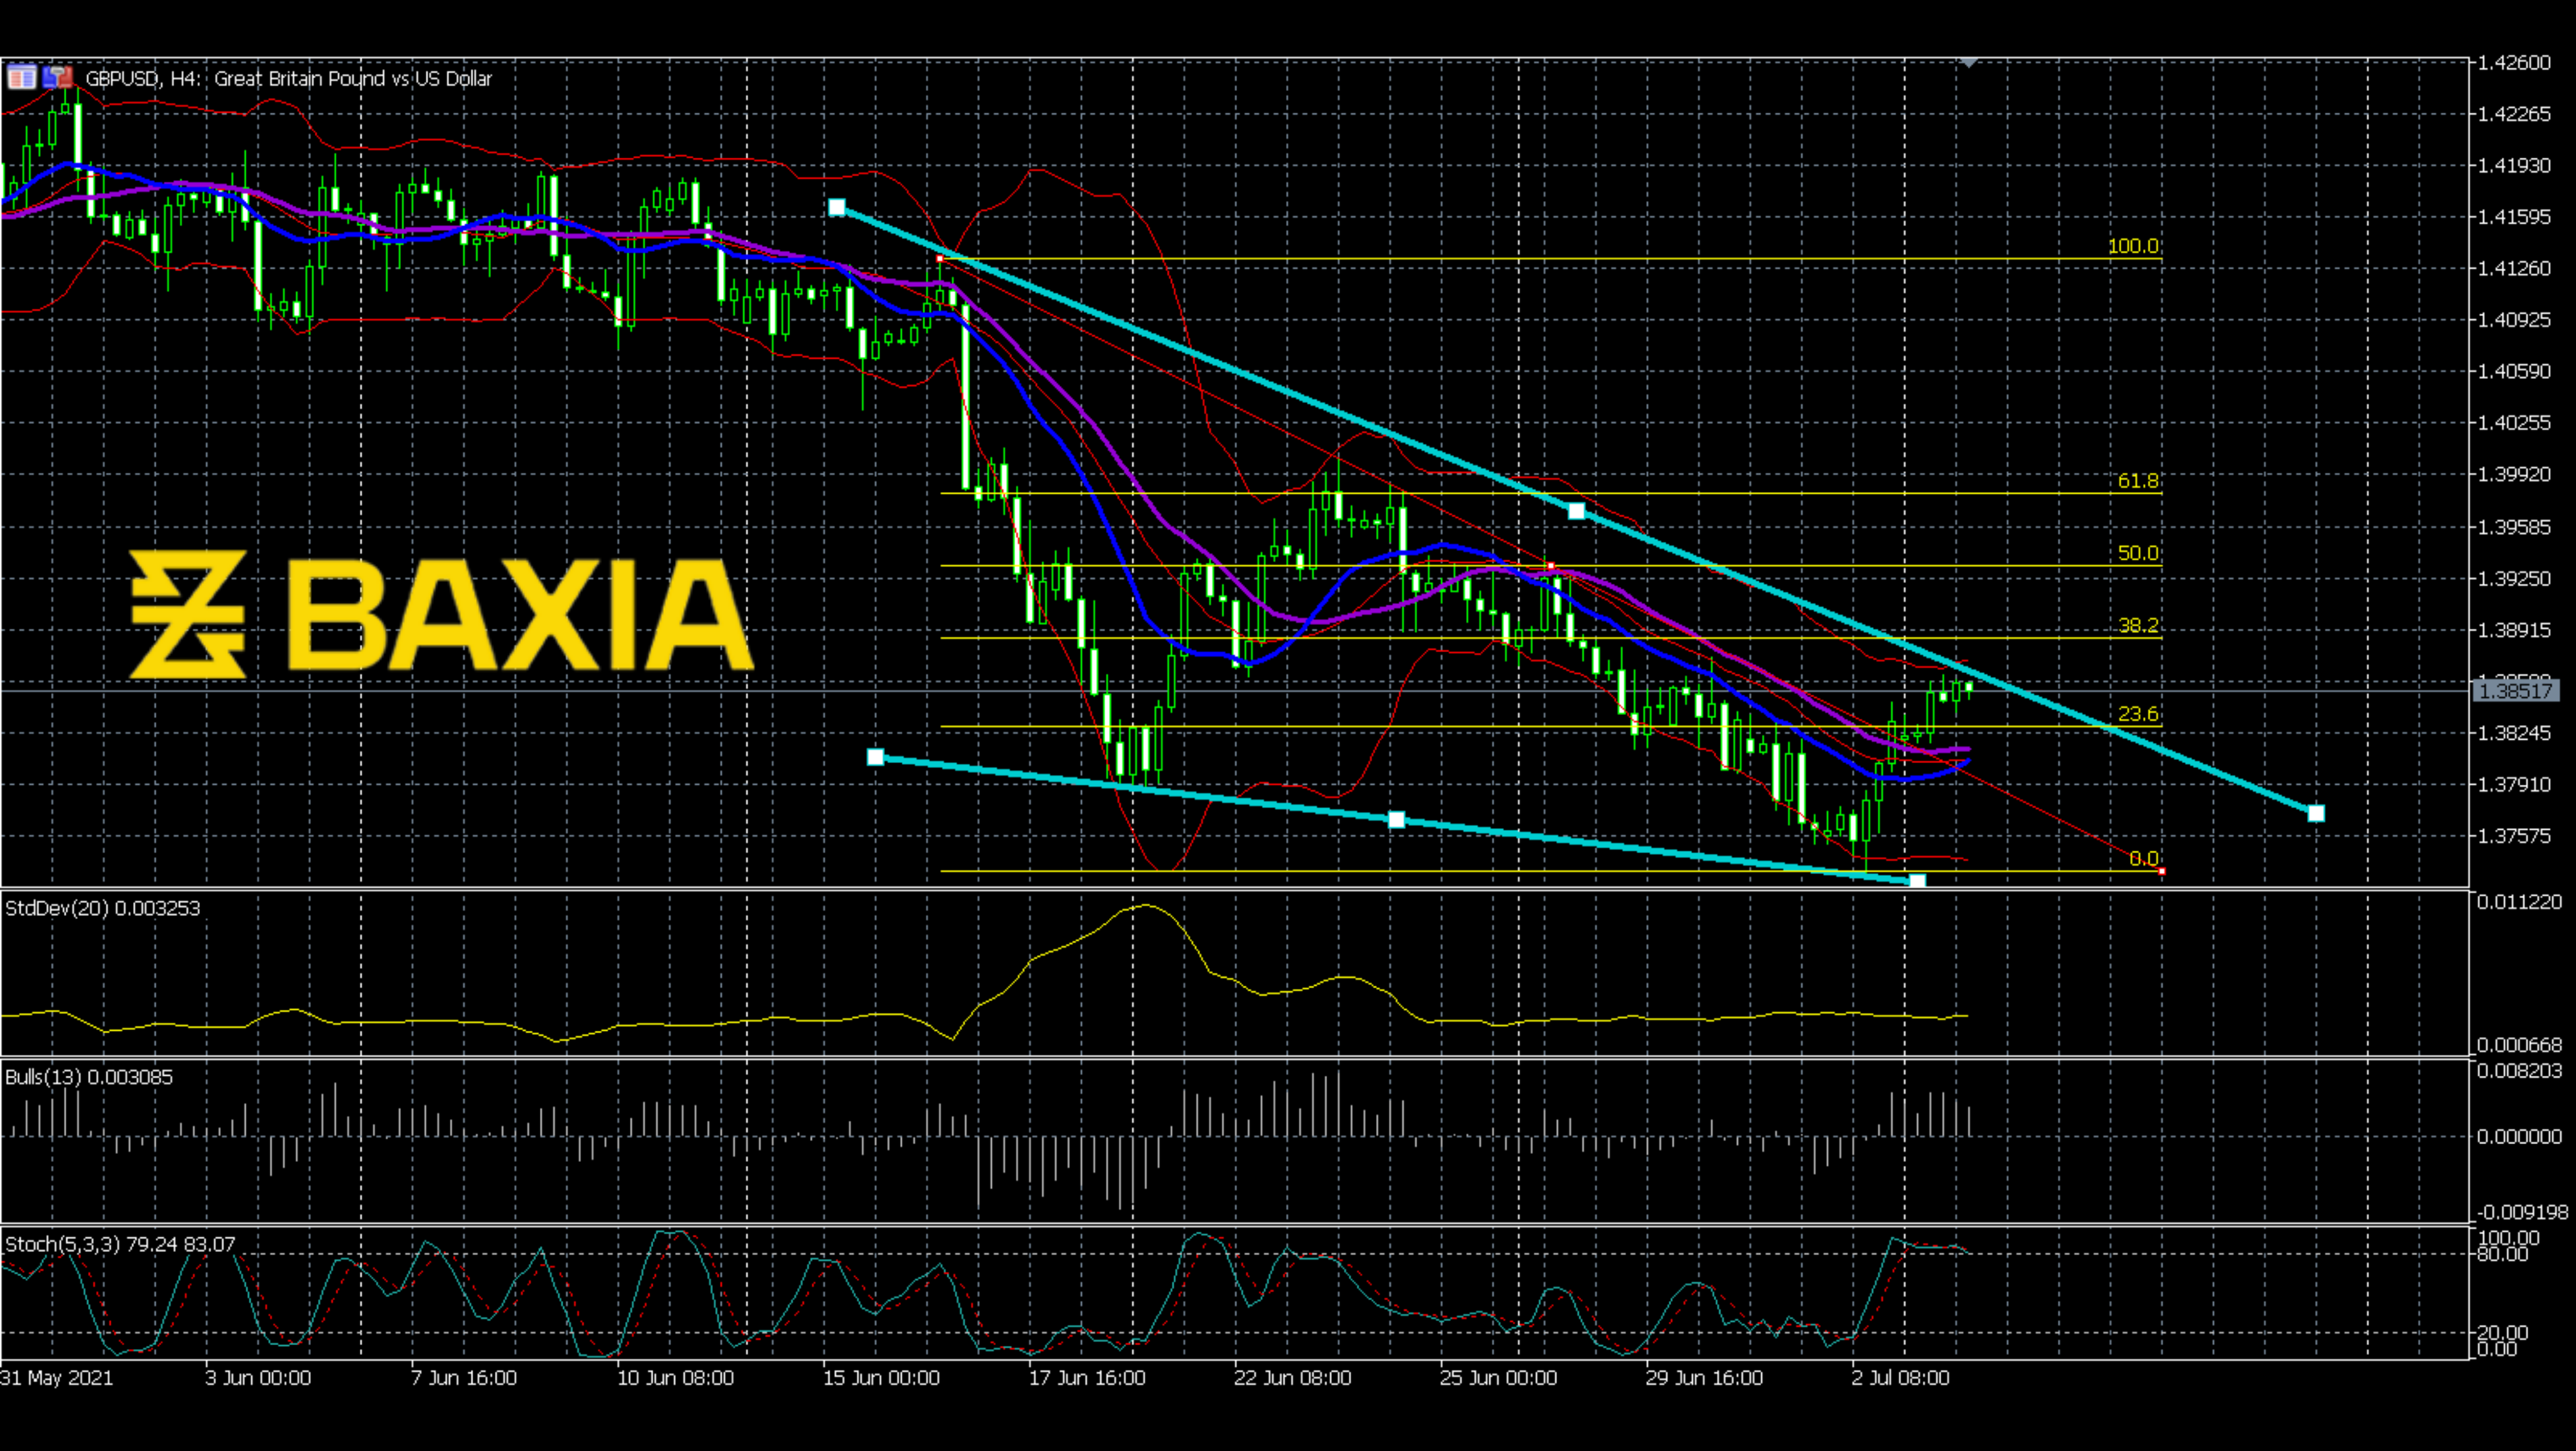

As can be seen, the price has been through a long downward trend since Aug 20th. The downward trend started with a sharp slope, followed by some mild waves. Finally, it reached 1.249 on Sep 3rd, which was also a support point. After this support point, the price soon went up; however, the upward trend stopped around the 61.8% Fibonacci level. What’s the next step of the price line?
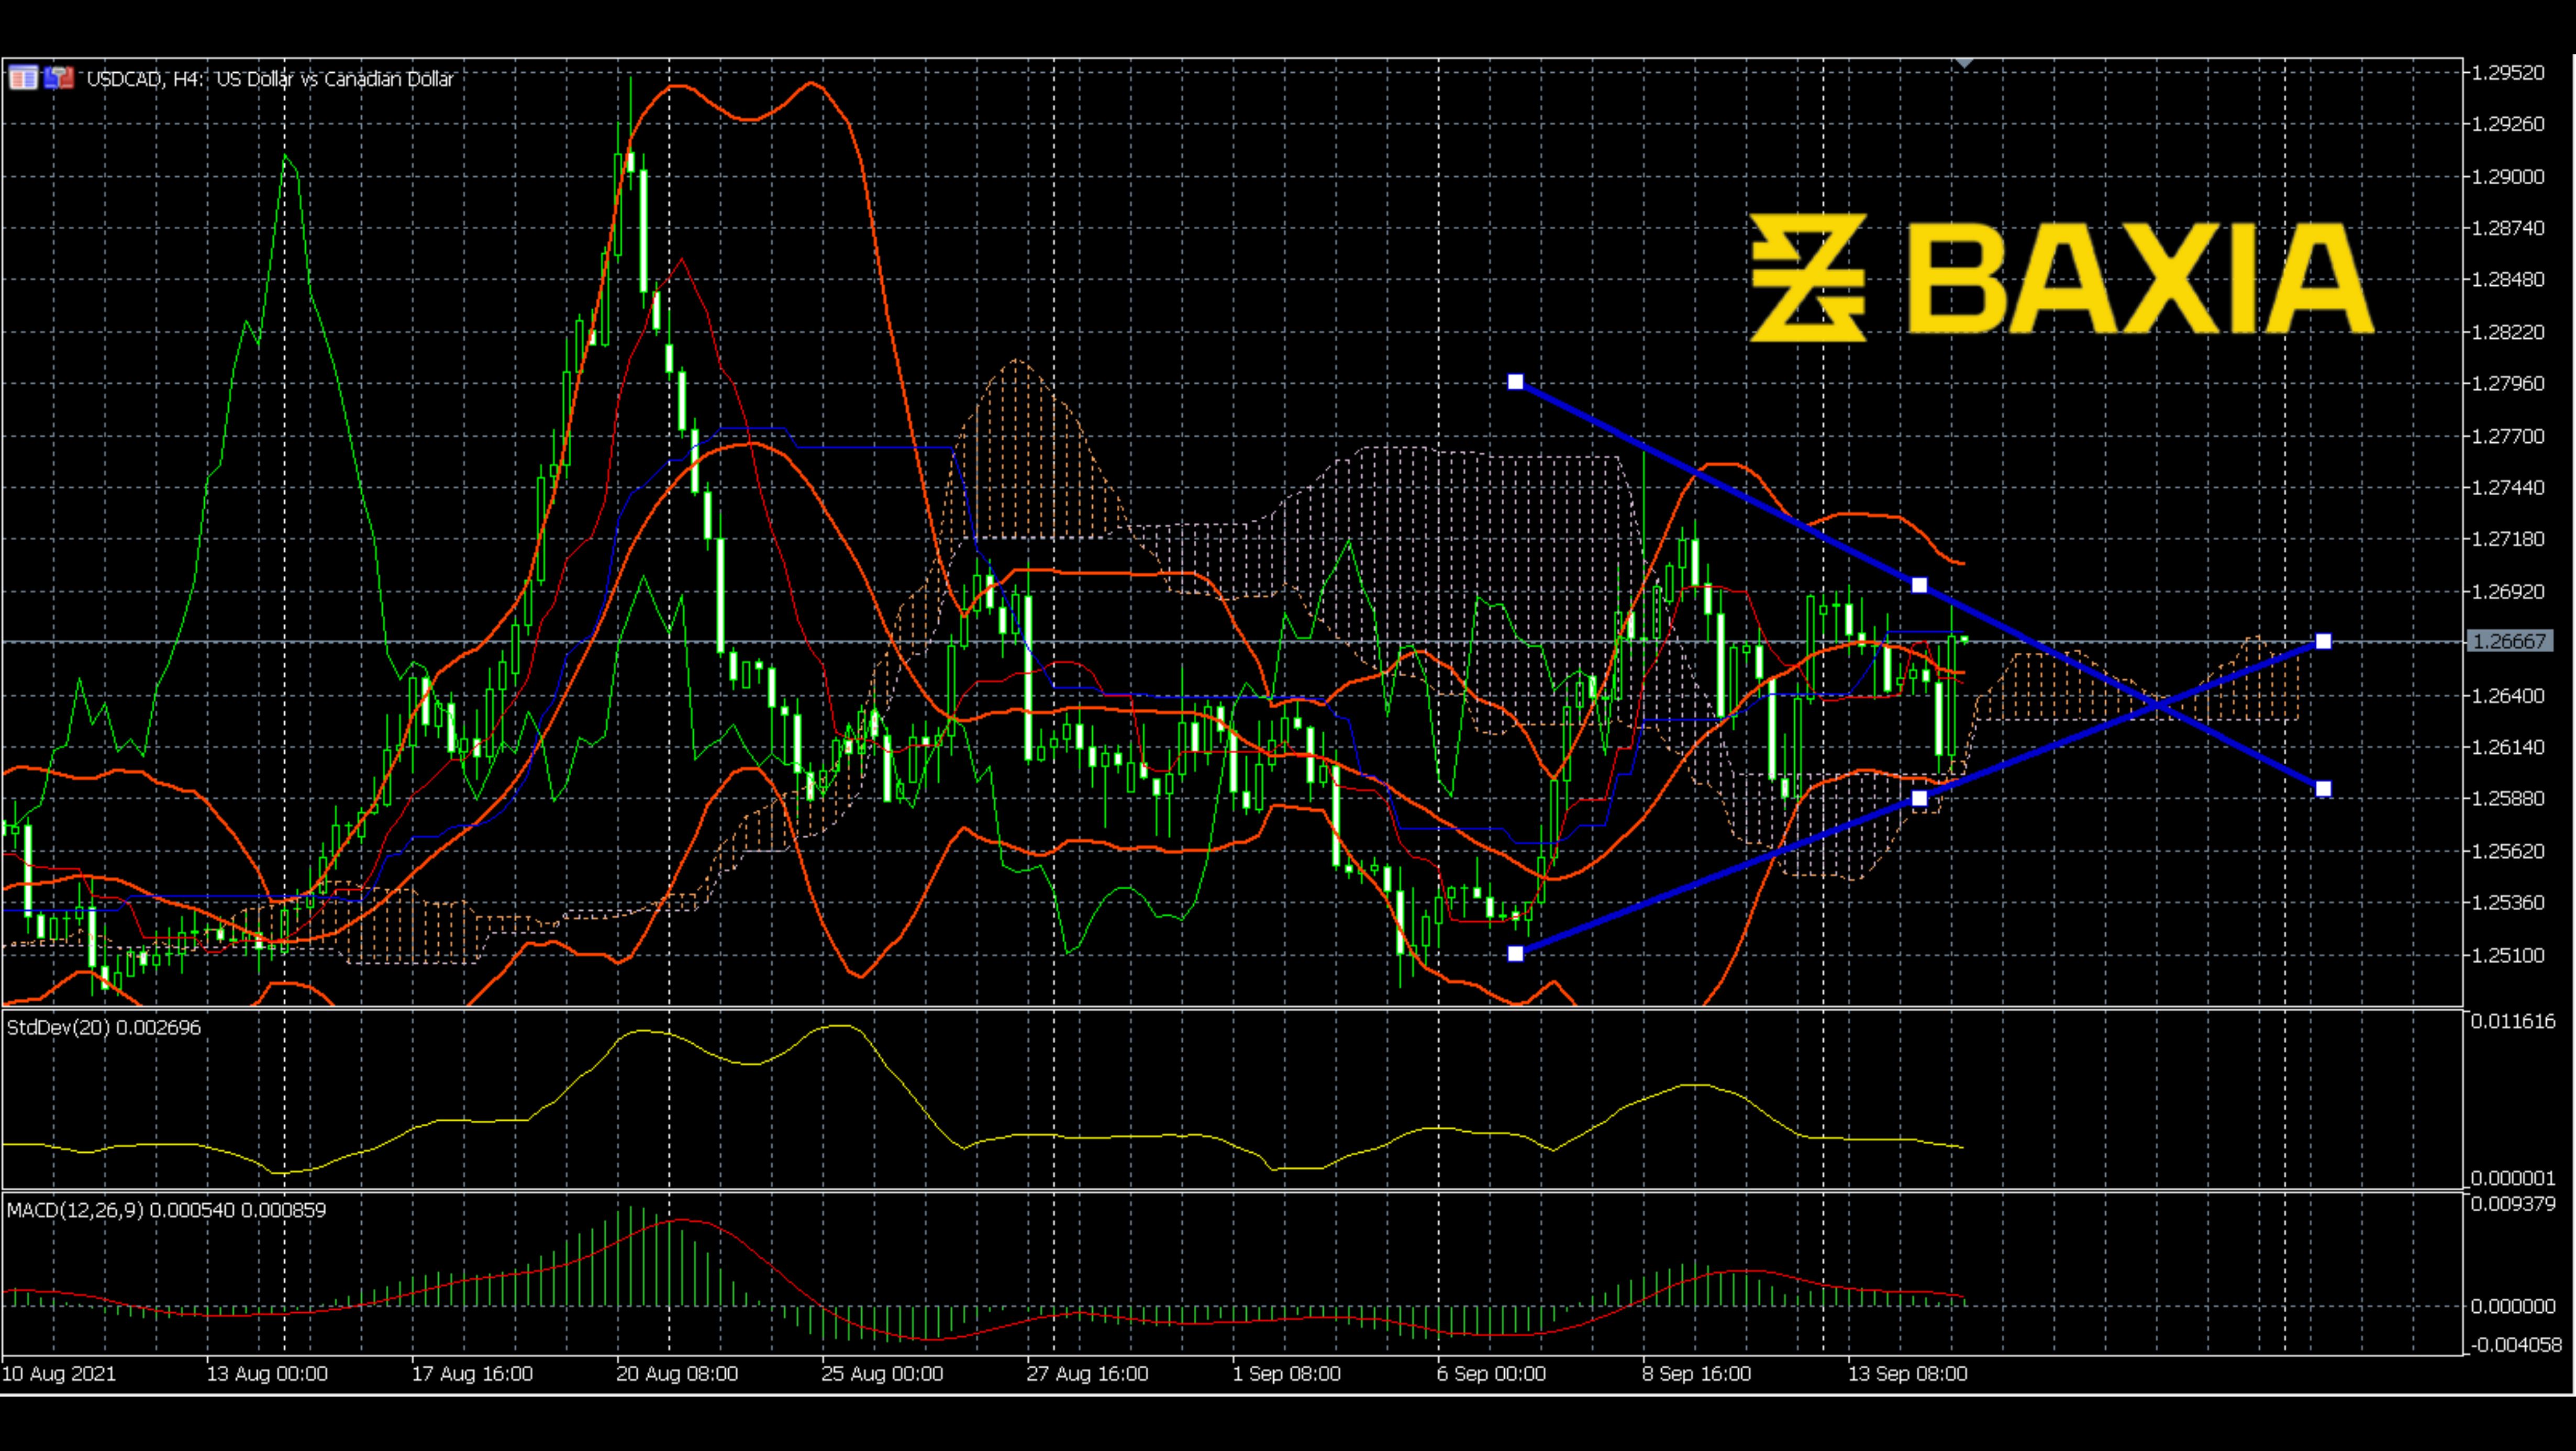
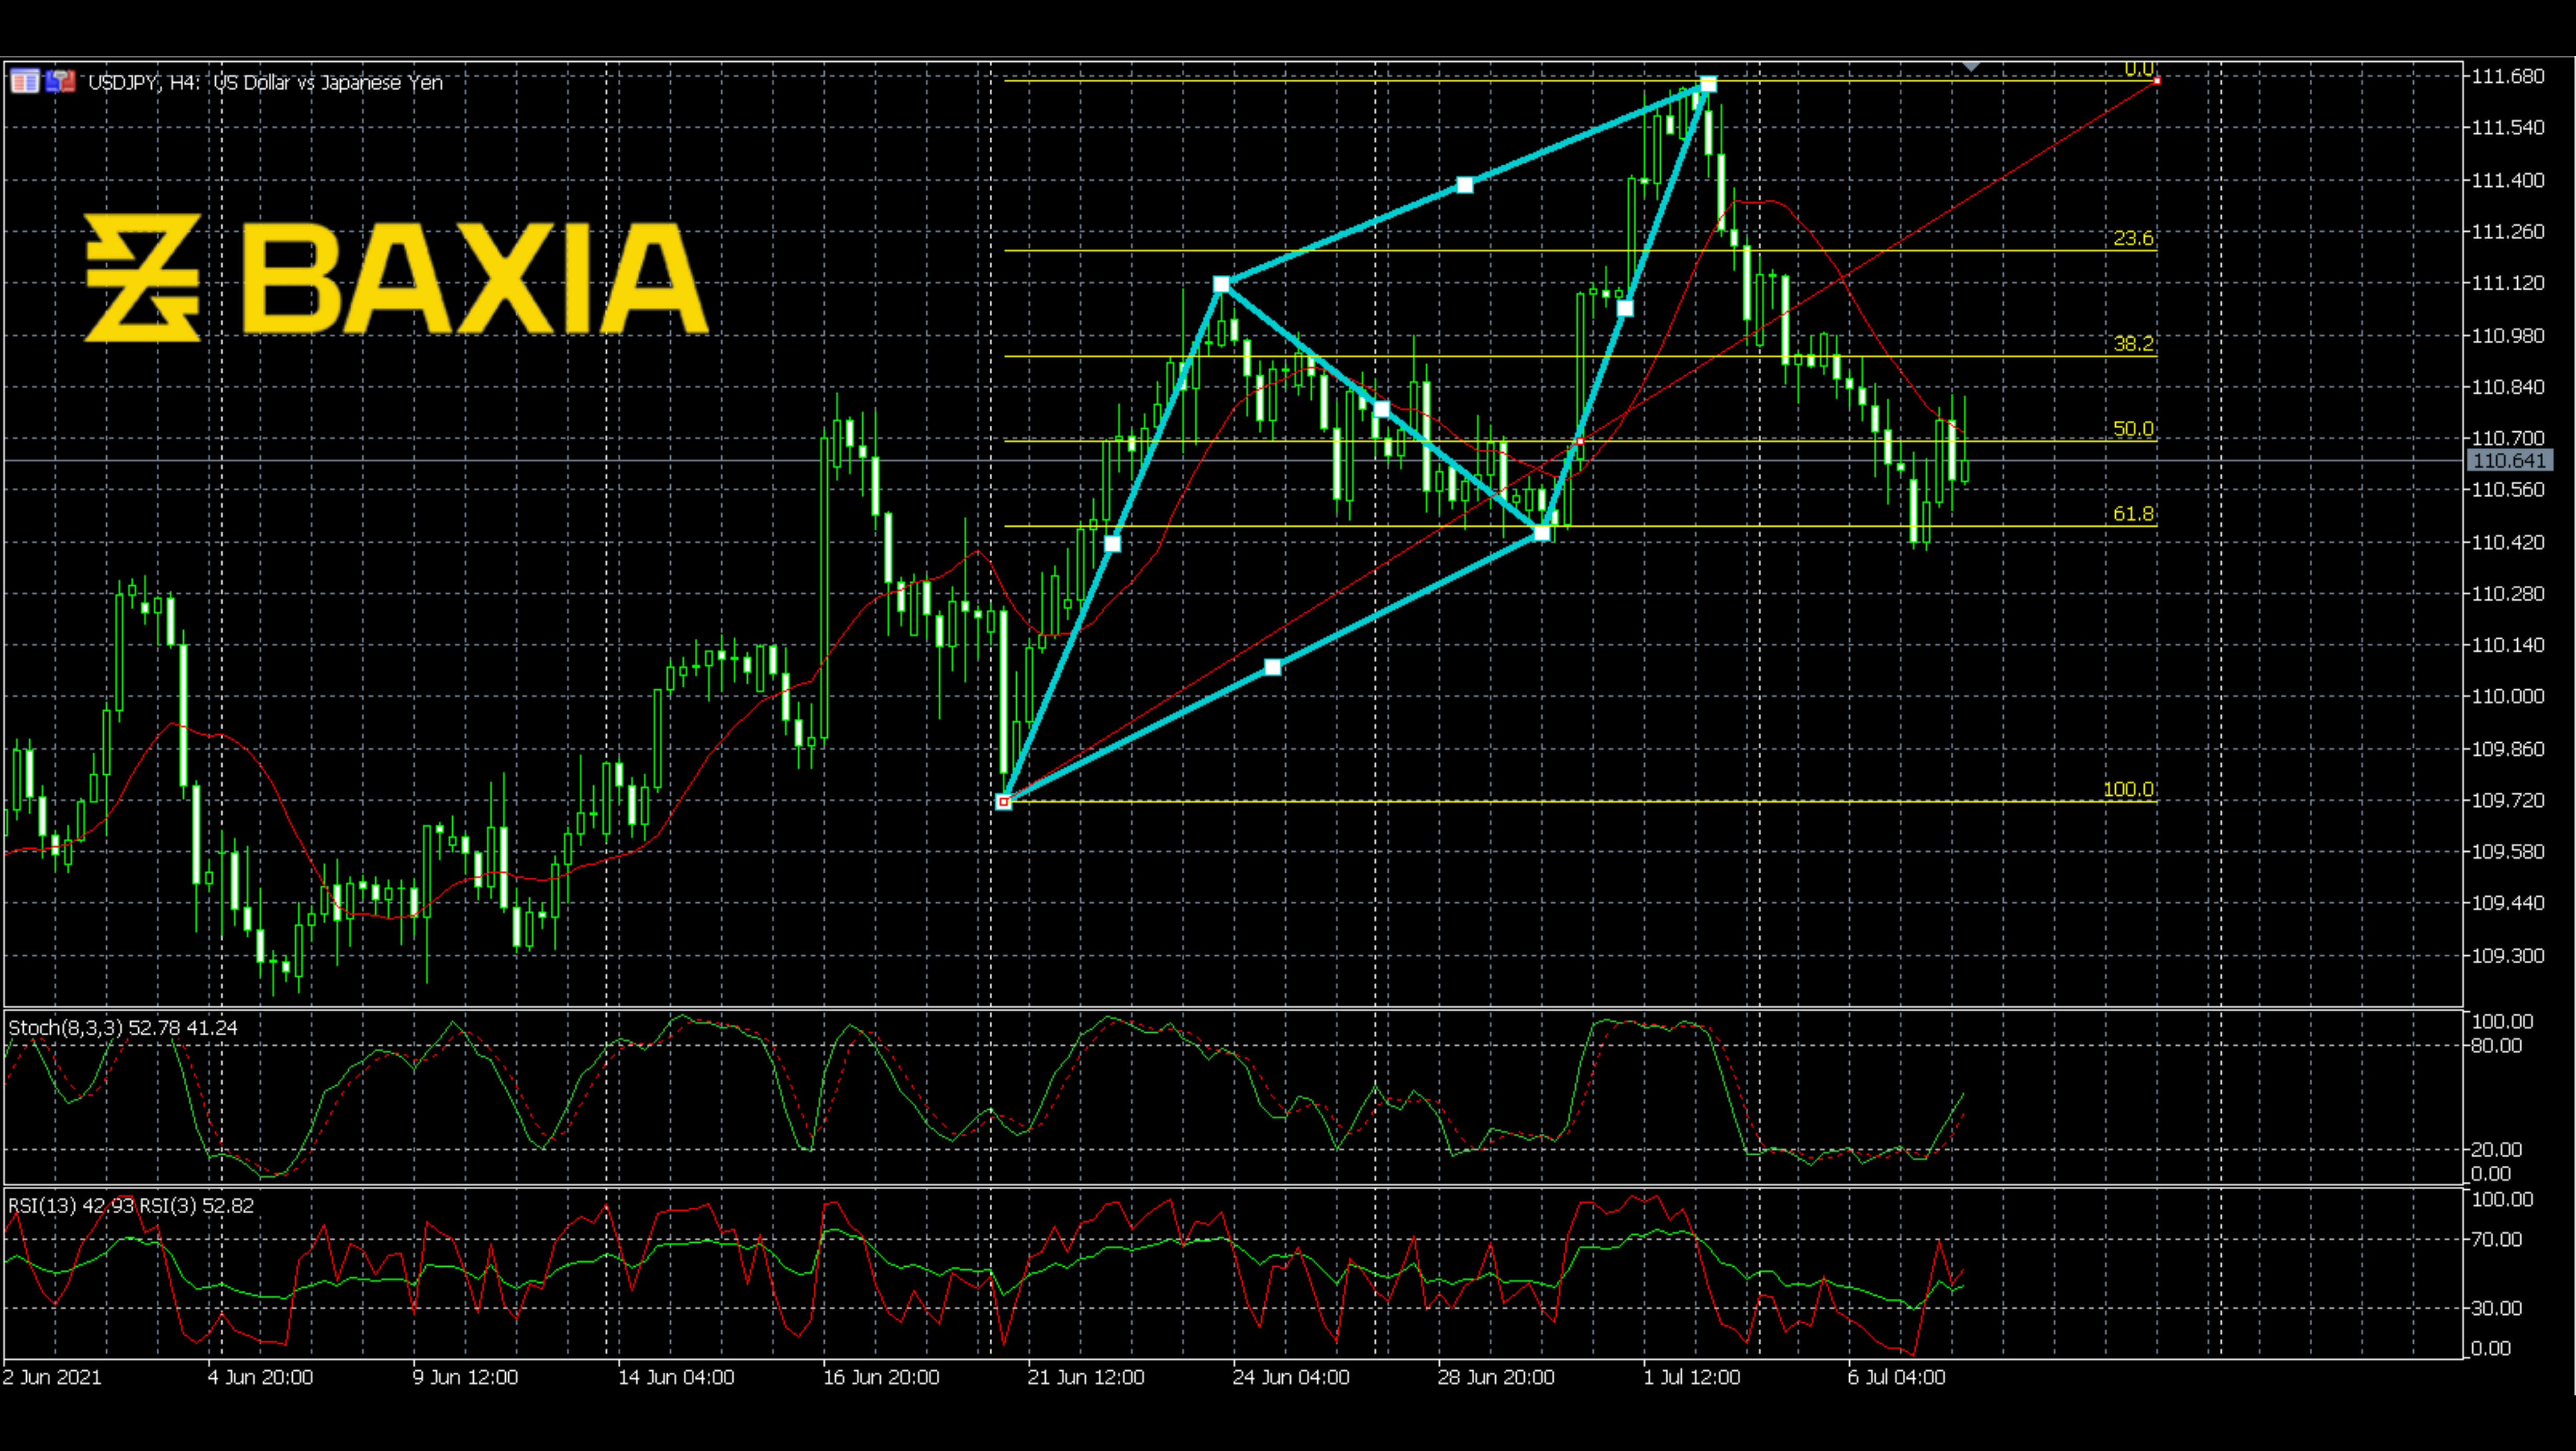
The price has been making a pennant since Sep 7th. Pennant pattern is a breakout signal; the breakout direction is the same as the previous trend. According to the past, the breakout direction is most likely to be downward.
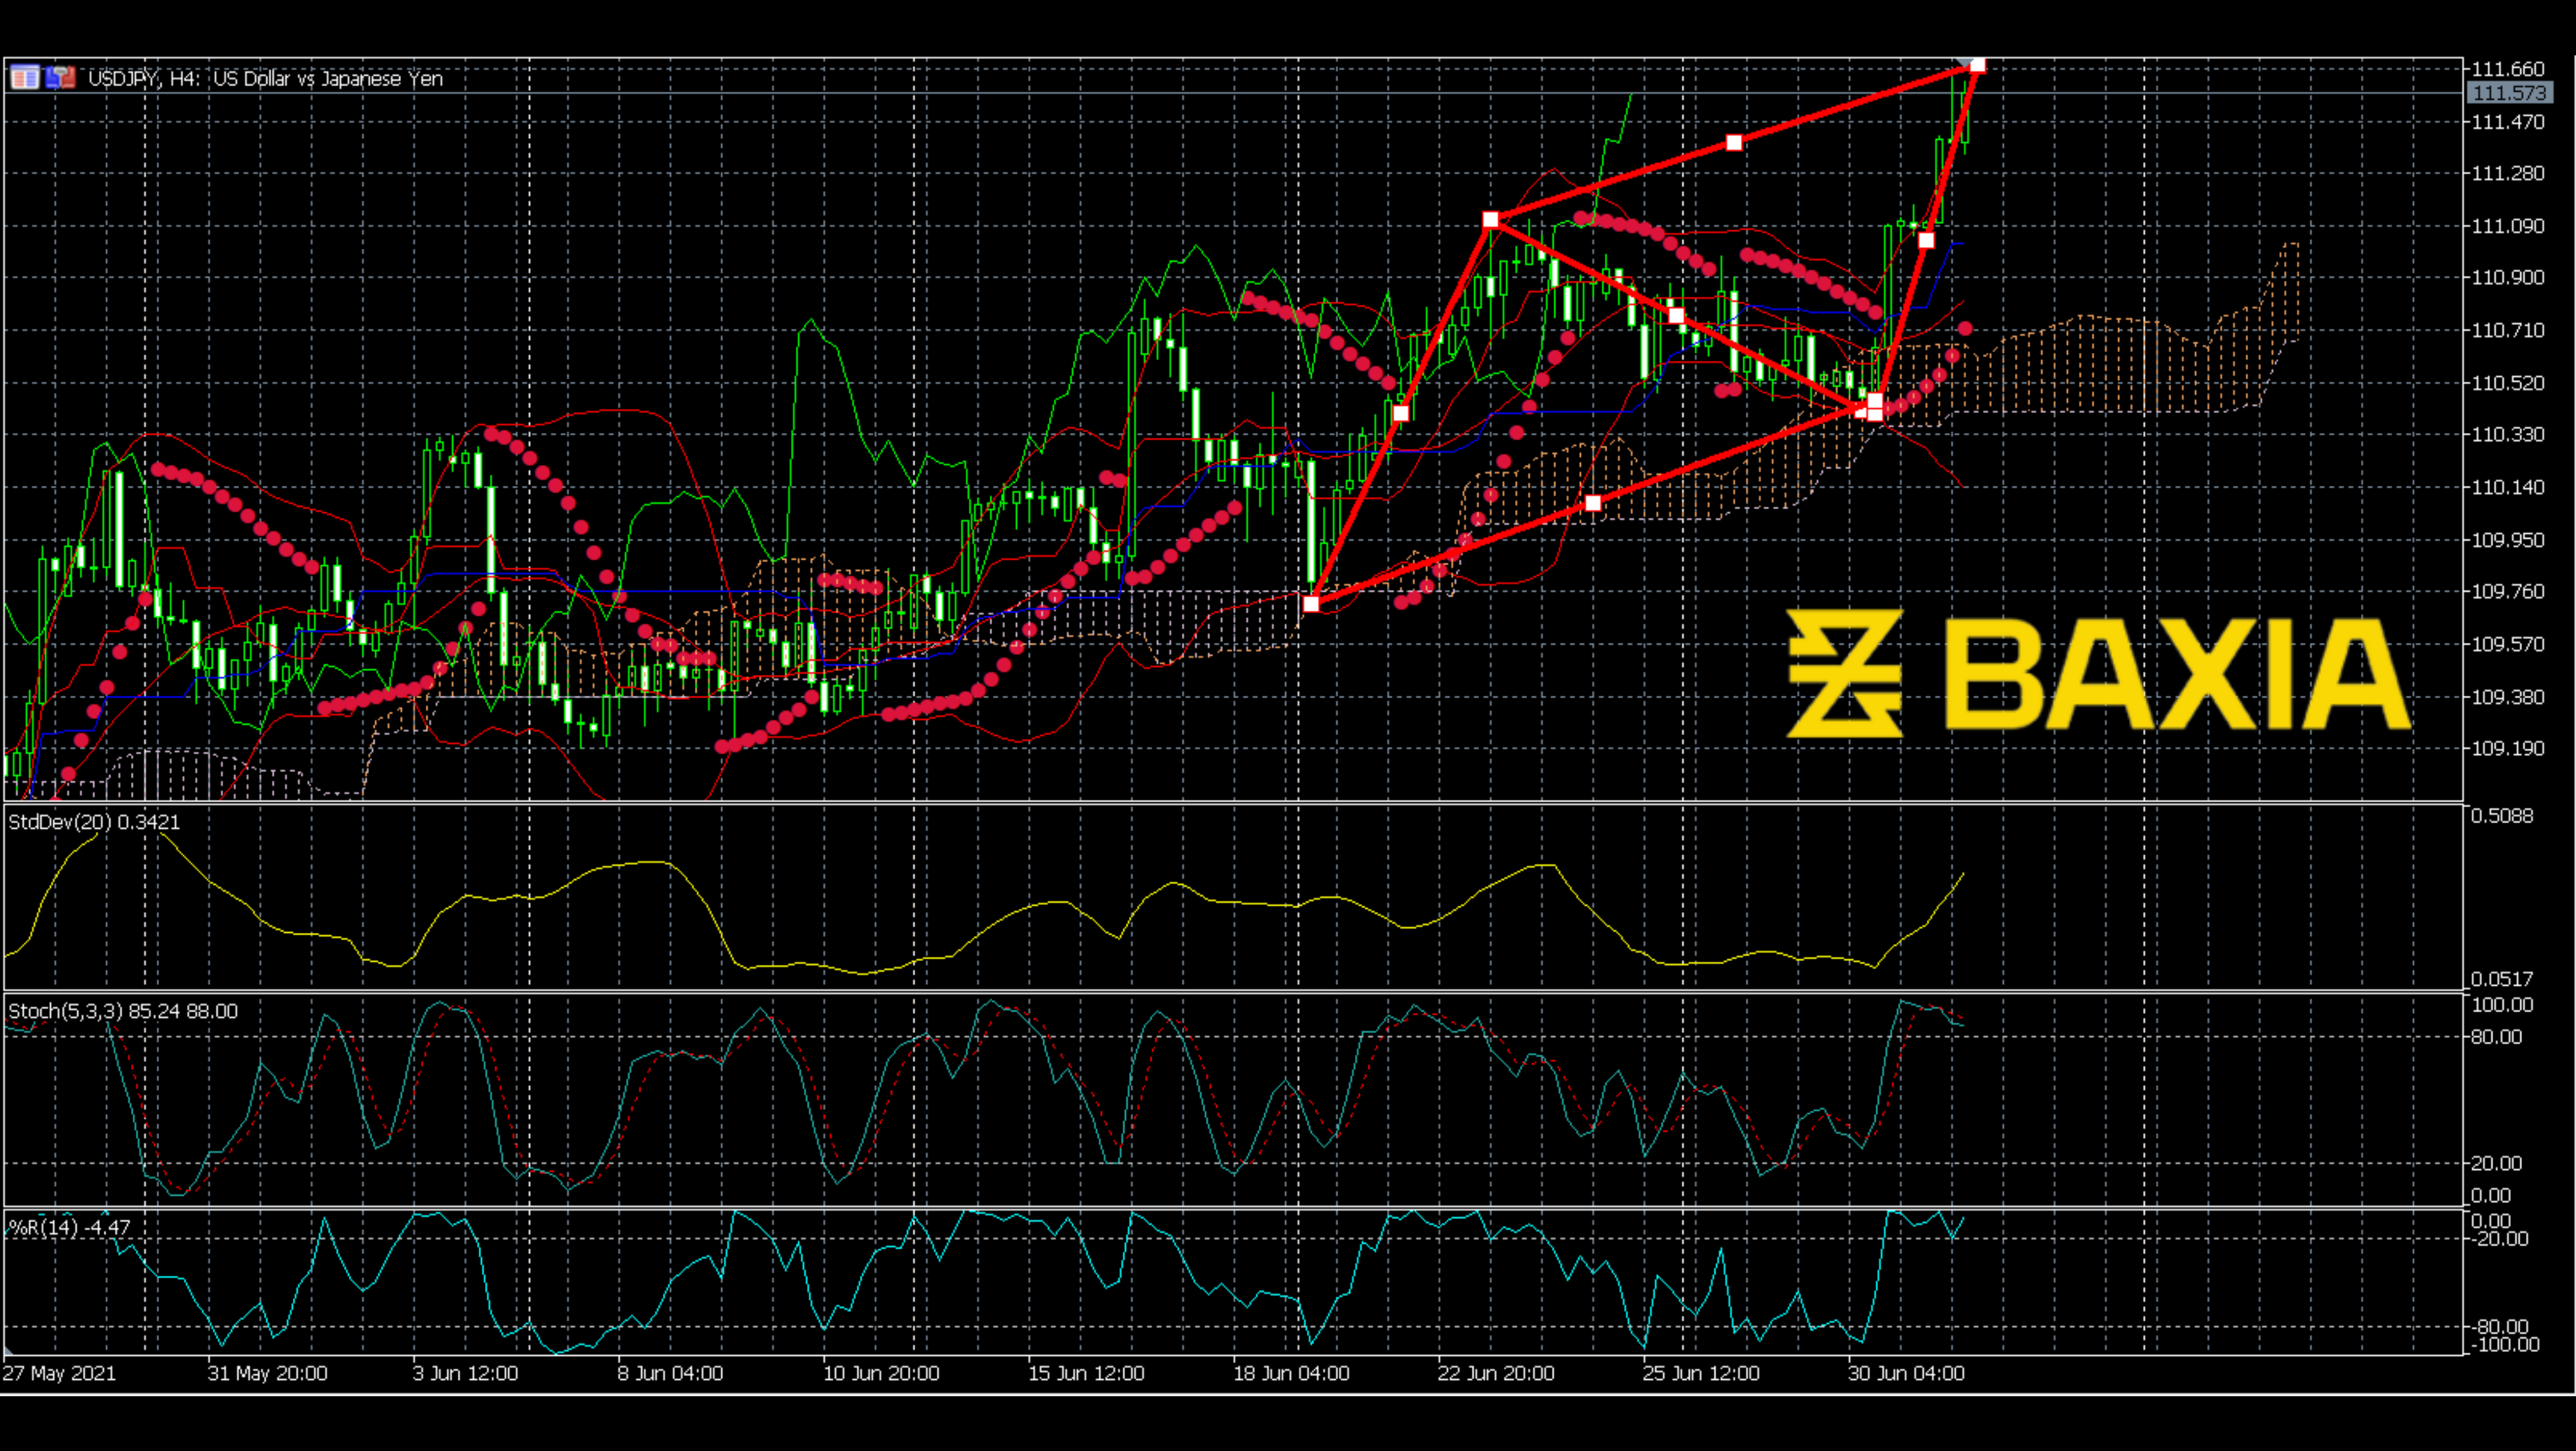
Recently, MACD is still showing a bearish signal. Although the Ichimoku still overlaps the price line, the cloud is going up now, which is a bearish signal. The pennant is now about to end. Let's keep our eyes on the price line, wait for the breakout.
We love to hear new ideas from traders and want to know what you think!
If you like this topic and want to suggest future topics that you find helpful, let us know by clicking the ‘submit your feedback’ button below.

Trading foreign exchange on margin carries a high level of risk, and may not be suitable for all investors. Before deciding to trade foreign exchange you should carefully consider your investment objectives, level of experience, and risk appetite.
Nothing contained in this website should be construed as investment advice. Any reference to an investment's past or potential performance is not, and should not be construed as, a recommendation or as a guarantee of any specific outcome or profit.