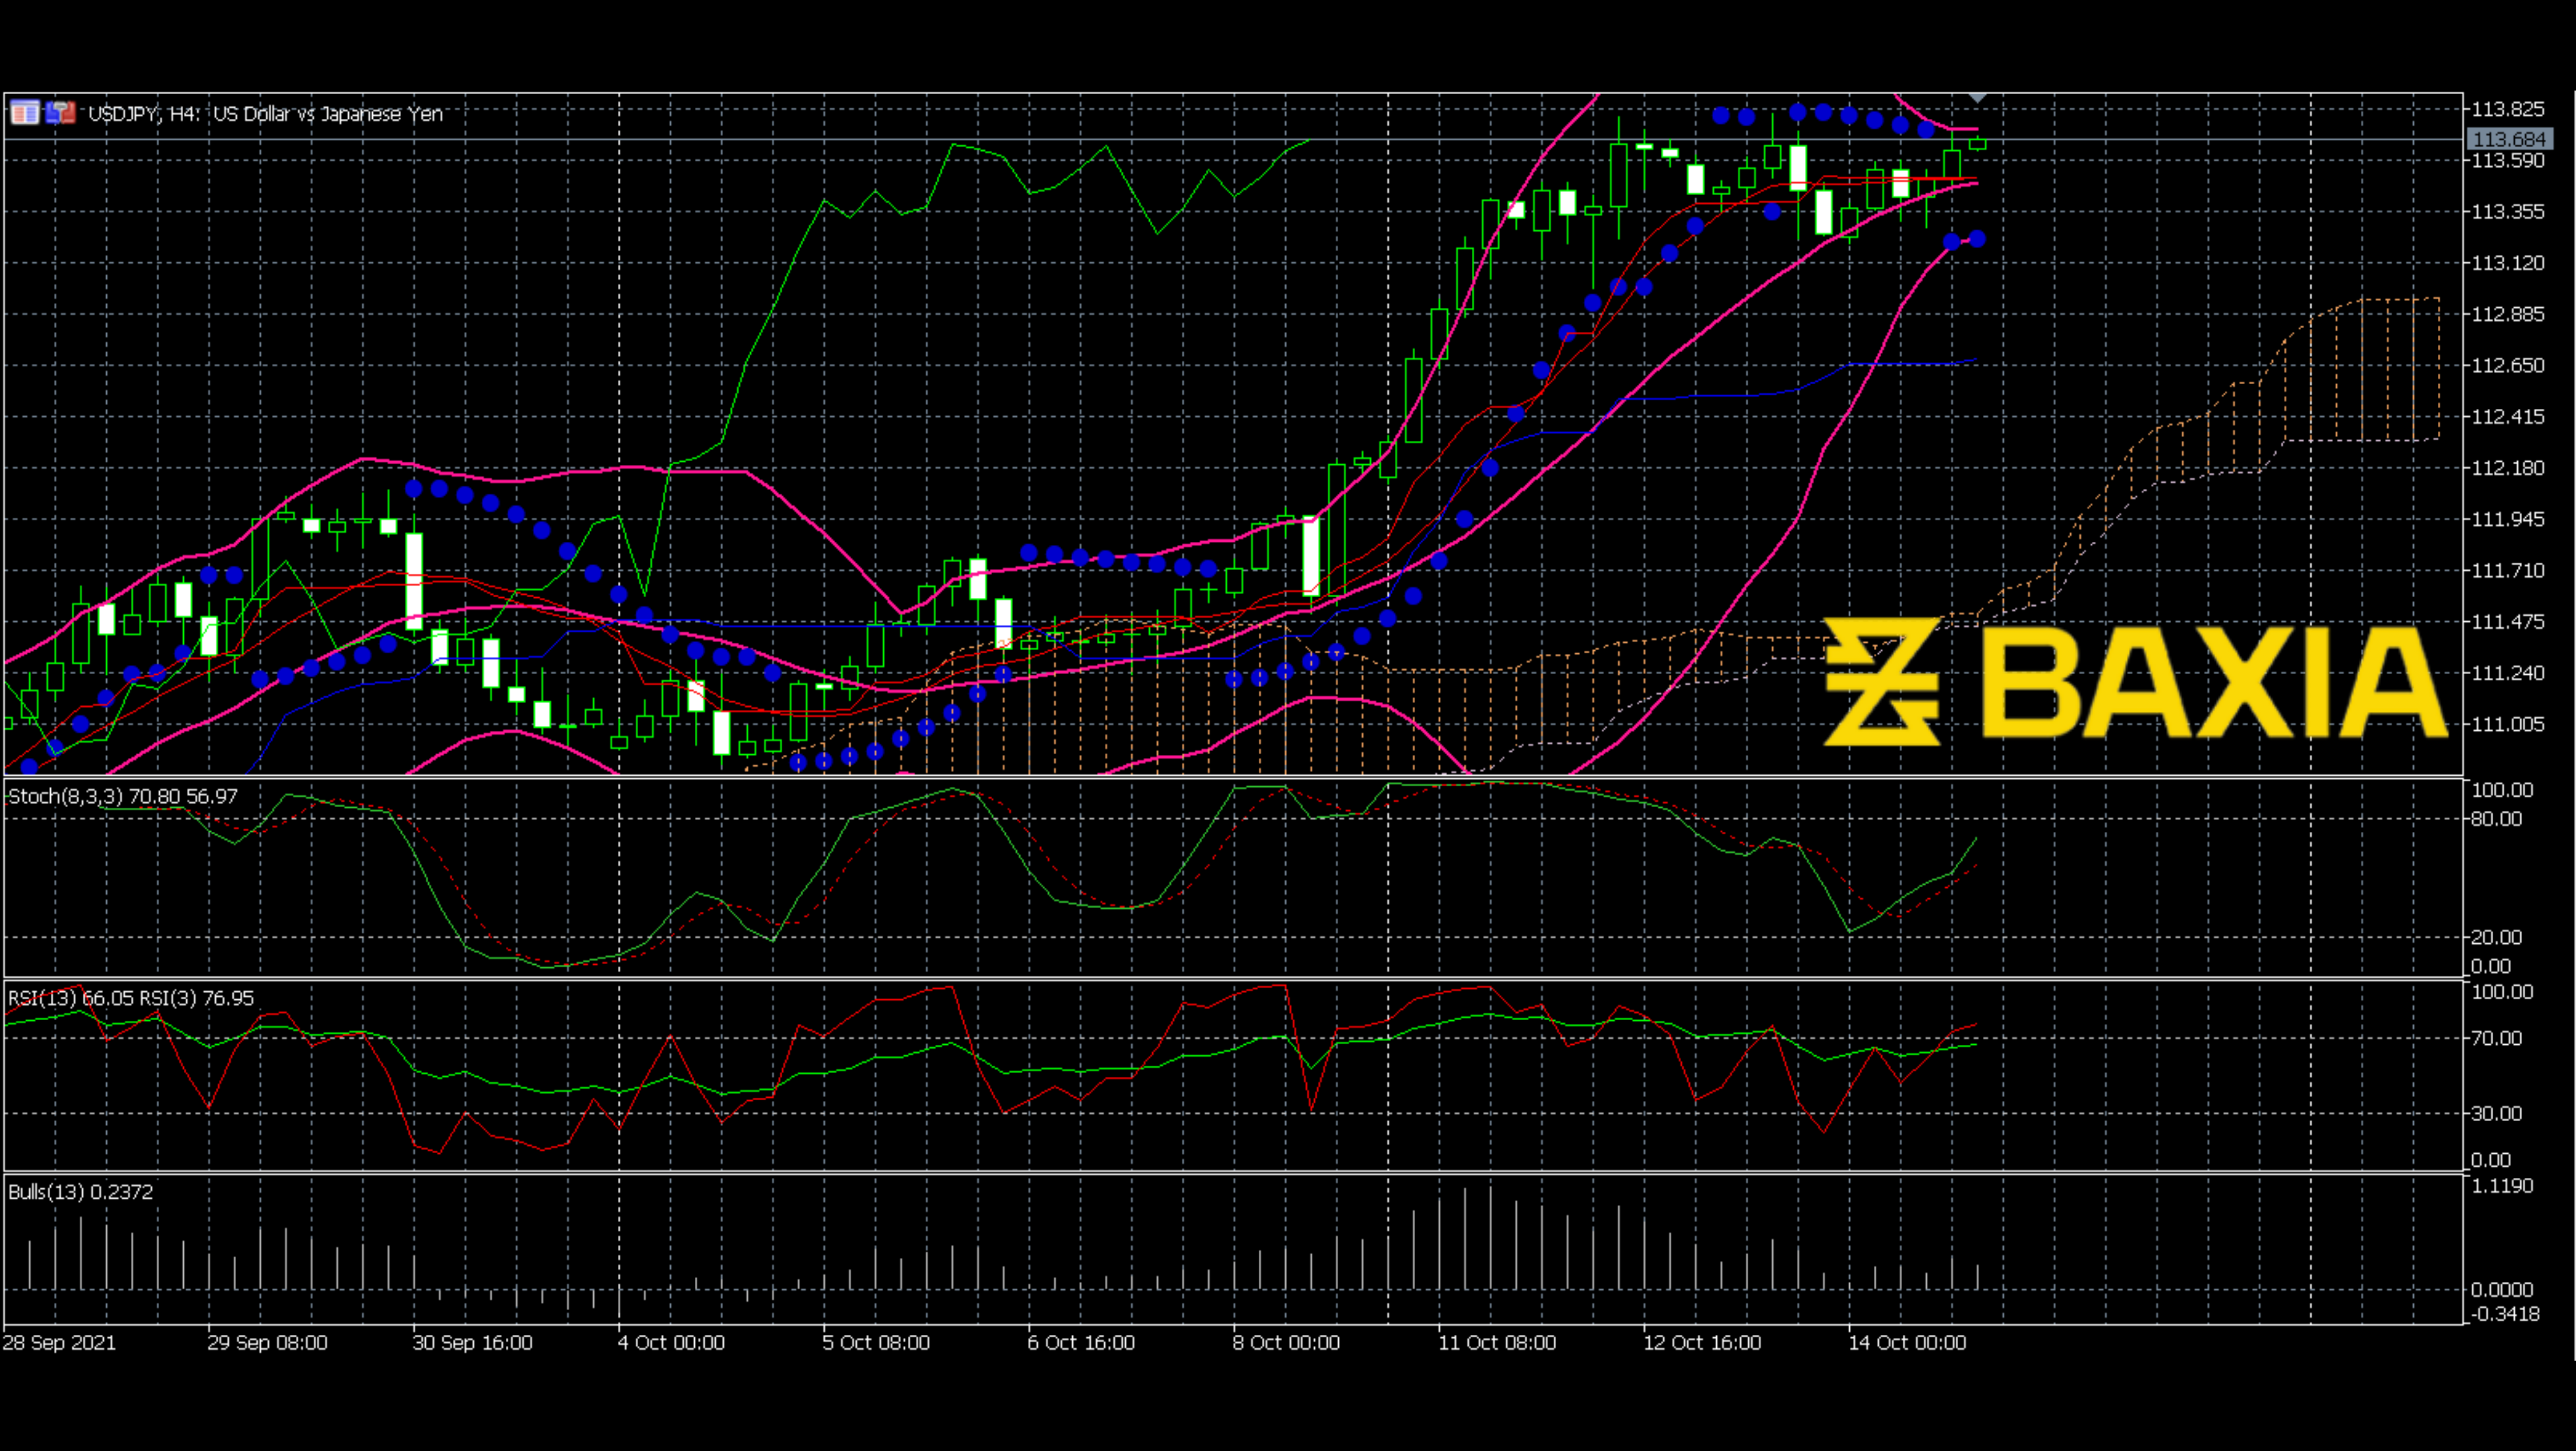

Several sharp sparks brought the price to 111.65, which is almost the highest since the beginning of June. The US dollar is getting stronger; however, the fast-rising price line may bring some retracement to the price.
The price seems to make an ABCD pattern here. As we know, once the pattern is finished, the price will break down. Although the pattern is not very precise, we can still consider it a bearish signal. The price has been breaking out the Bollinger Bands since the beginning of the latest upward wave. The Bollinger Bands always like to push the price back to the middle line, which means the resistance shows up.
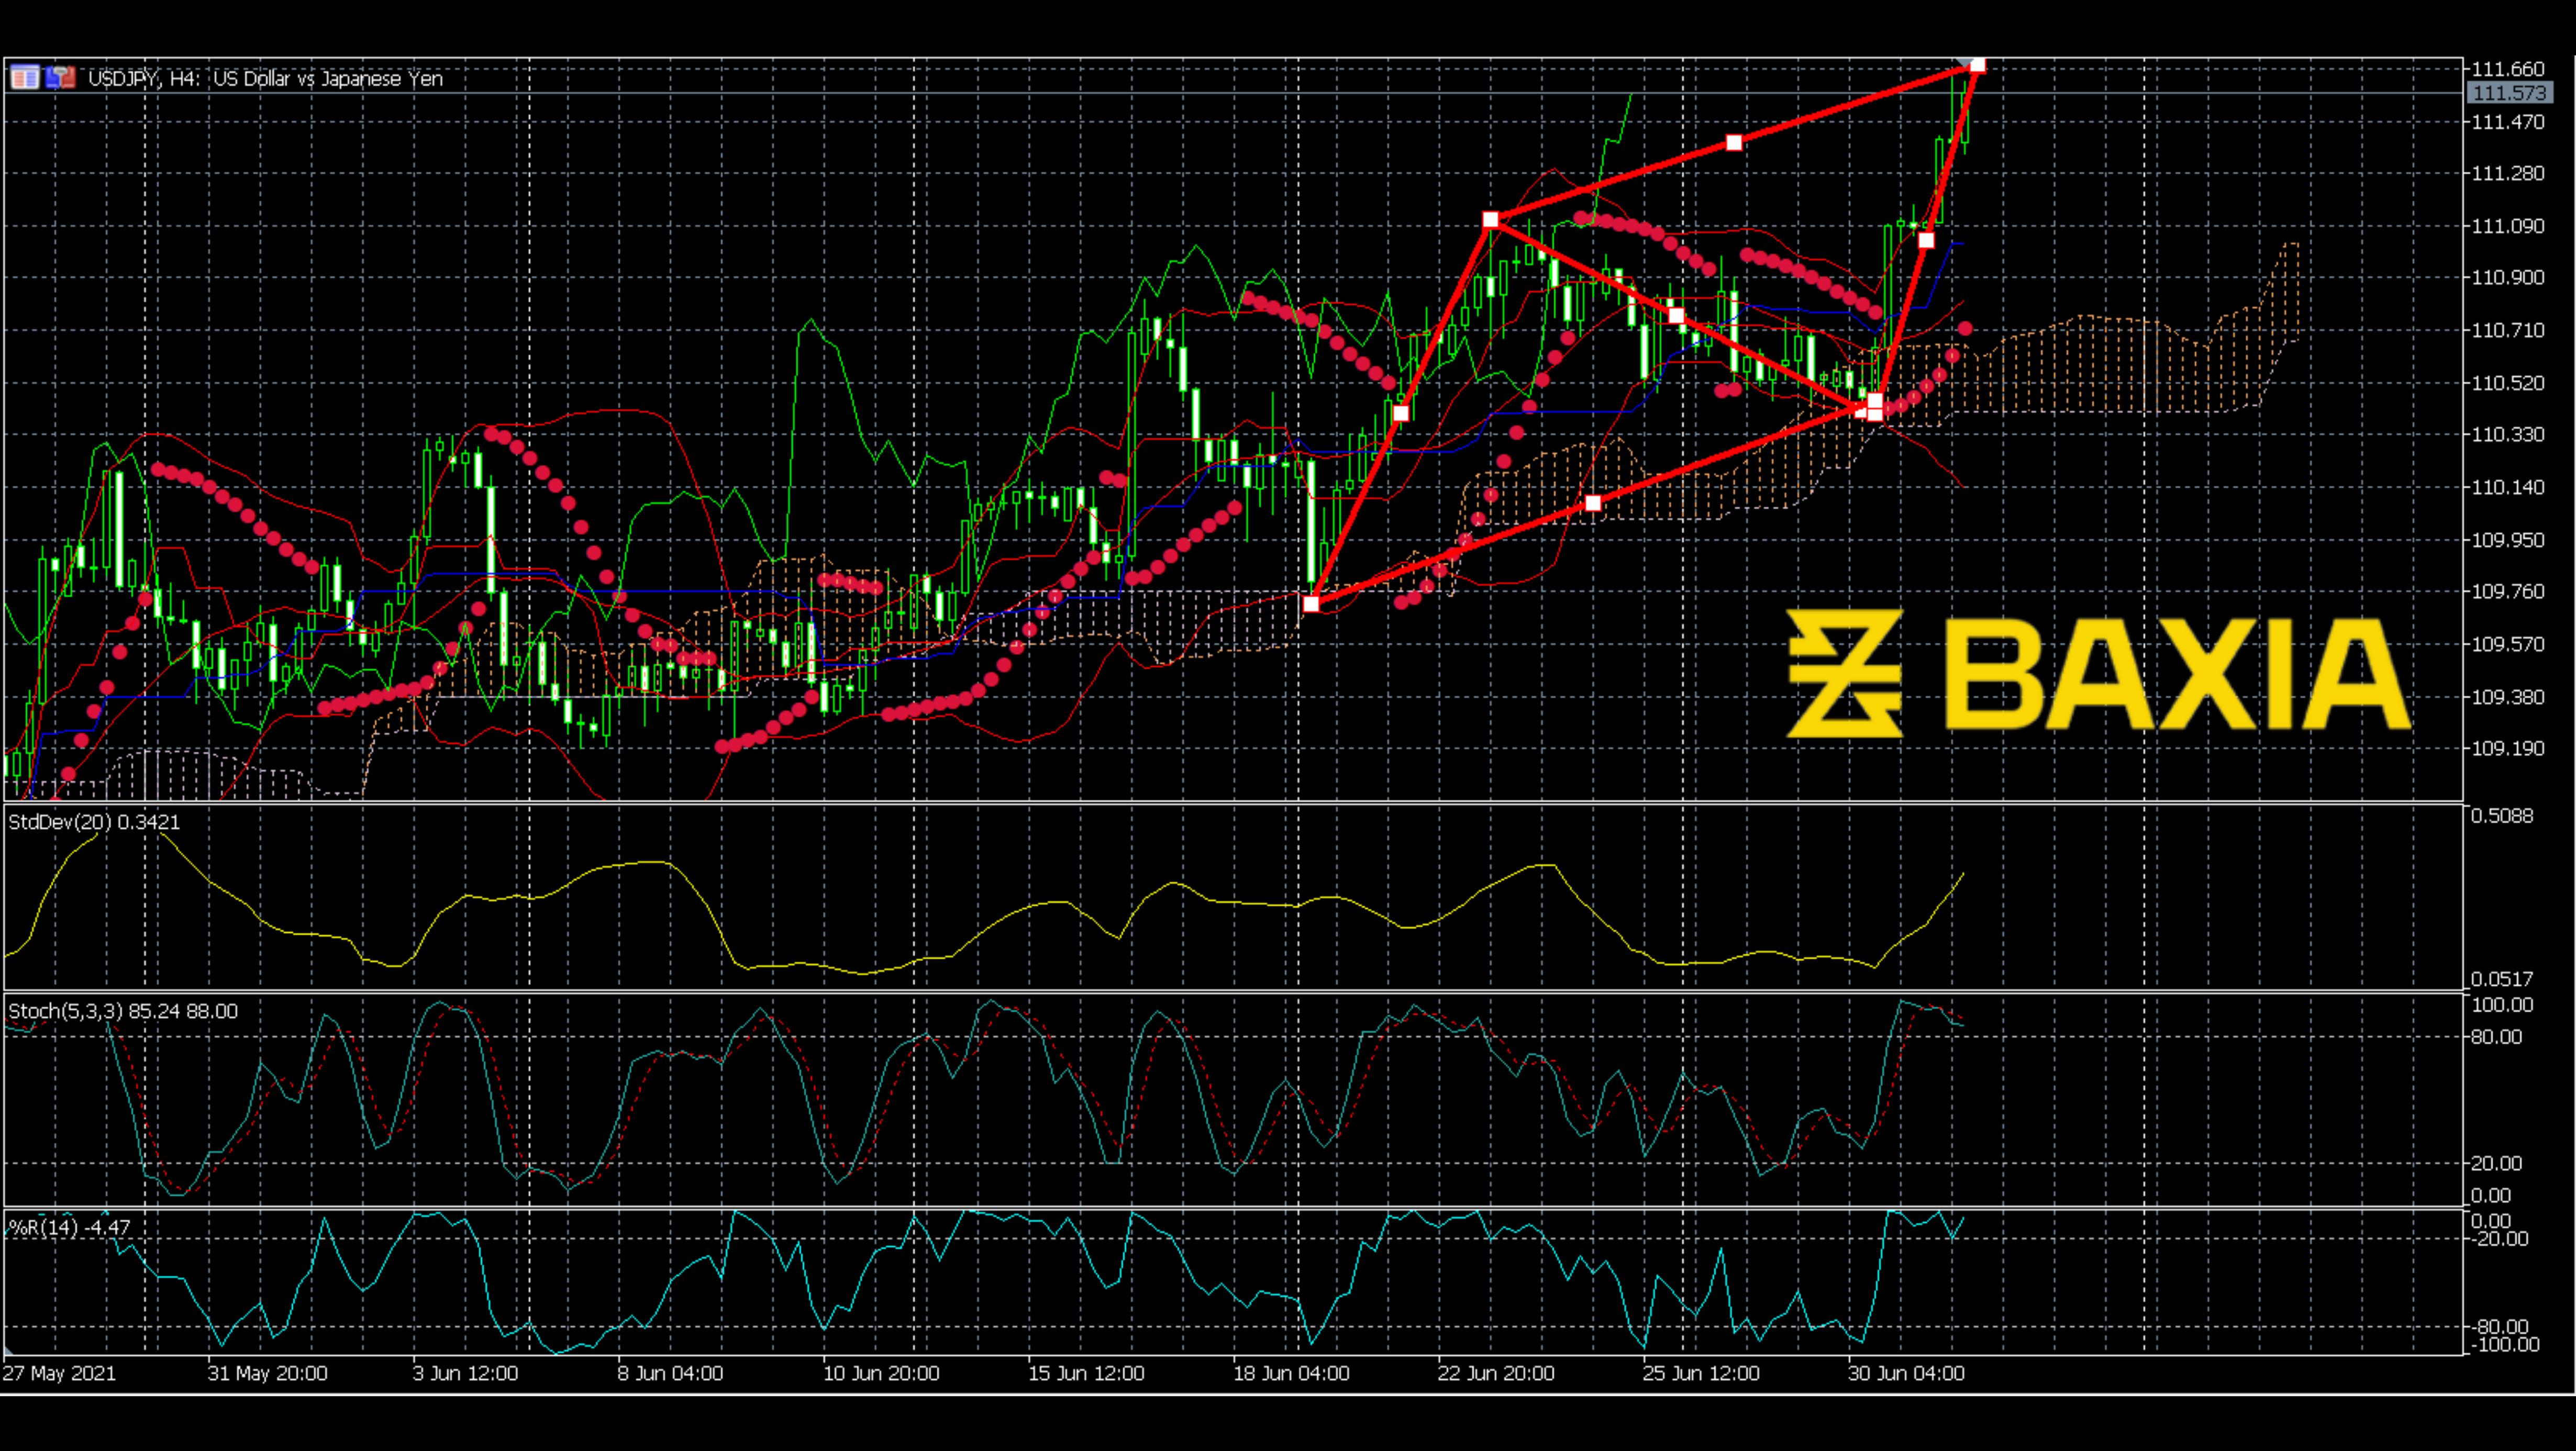
Stochastics and William R% both show overbought. Overbought is an unstable situation that the price may go down any second. And here we can see that the Stochastics already turns. Williams R% still hover around the overbought area; however, it’s just a matter of time. Standard Deviation is going up, it is understandable because the price is going to have a big wave soon.
We love to hear new ideas from traders and want to know what you think!
If you like this topic and want to suggest future topics that you find helpful, let us know by clicking the ‘submit your feedback’ button below.

Trading foreign exchange on margin carries a high level of risk, and may not be suitable for all investors. Before deciding to trade foreign exchange you should carefully consider your investment objectives, level of experience, and risk appetite.
Nothing contained in this website should be construed as investment advice. Any reference to an investment's past or potential performance is not, and should not be construed as, a recommendation or as a guarantee of any specific outcome or profit.