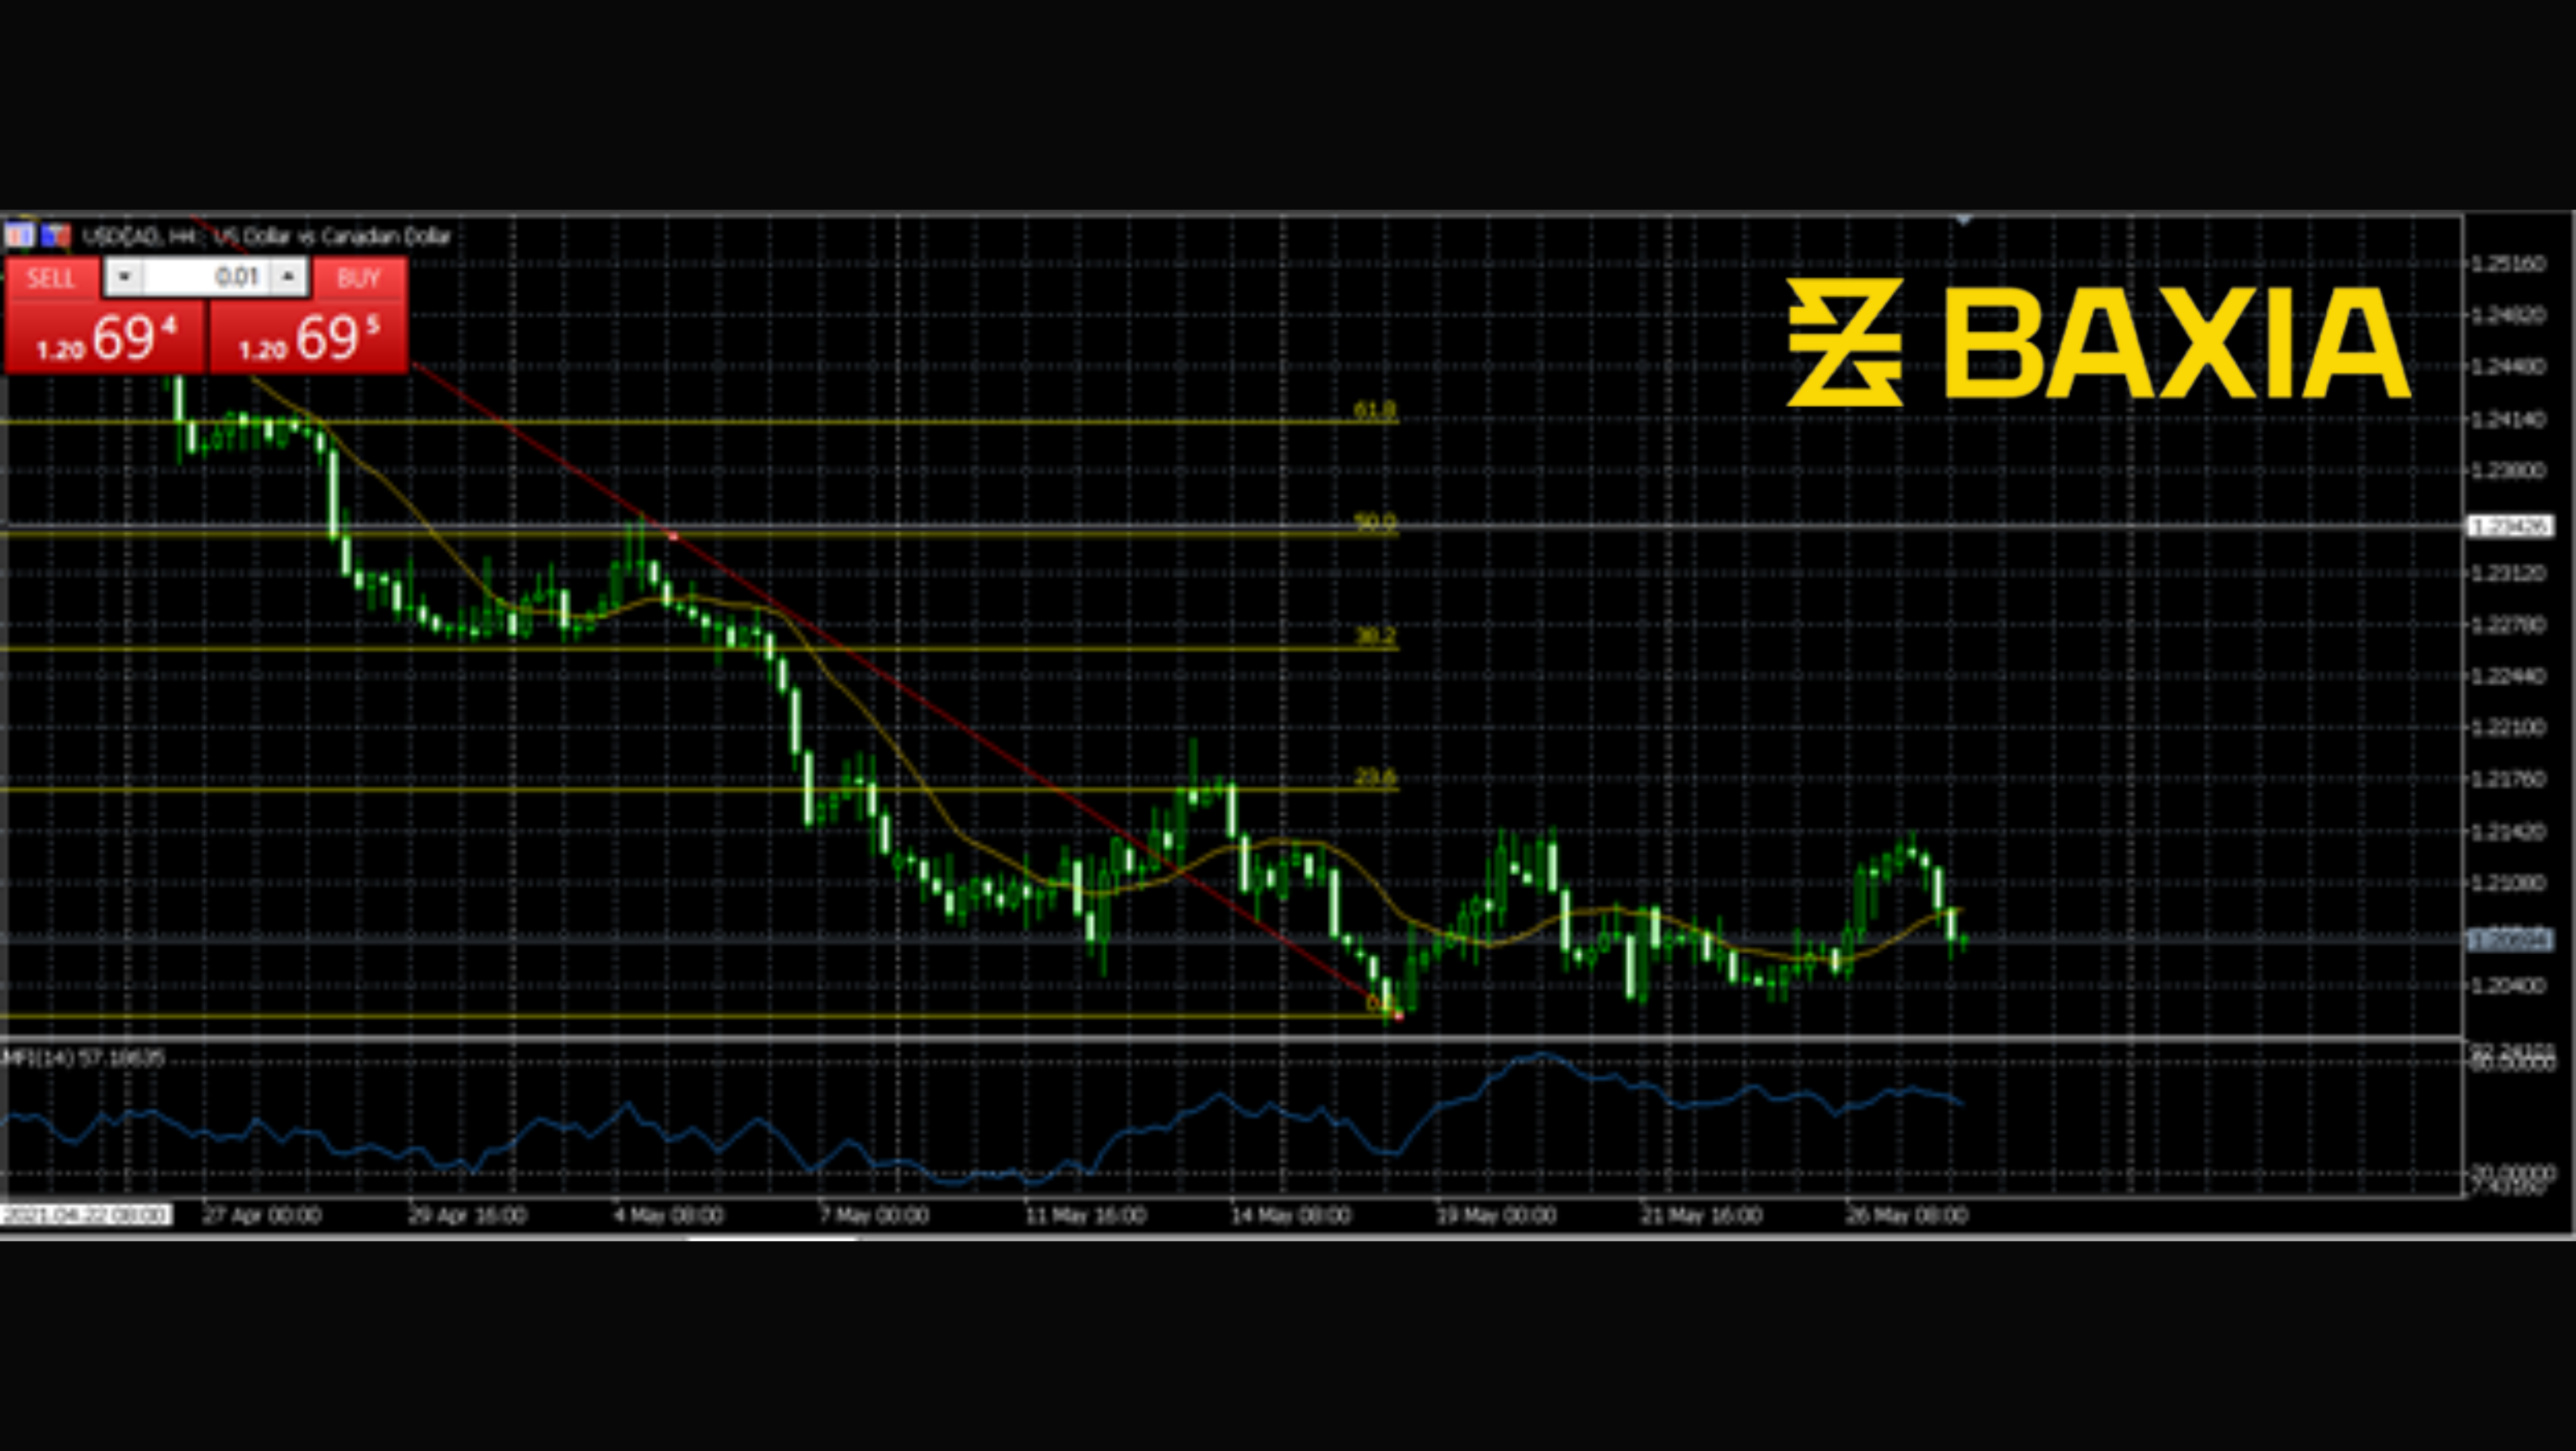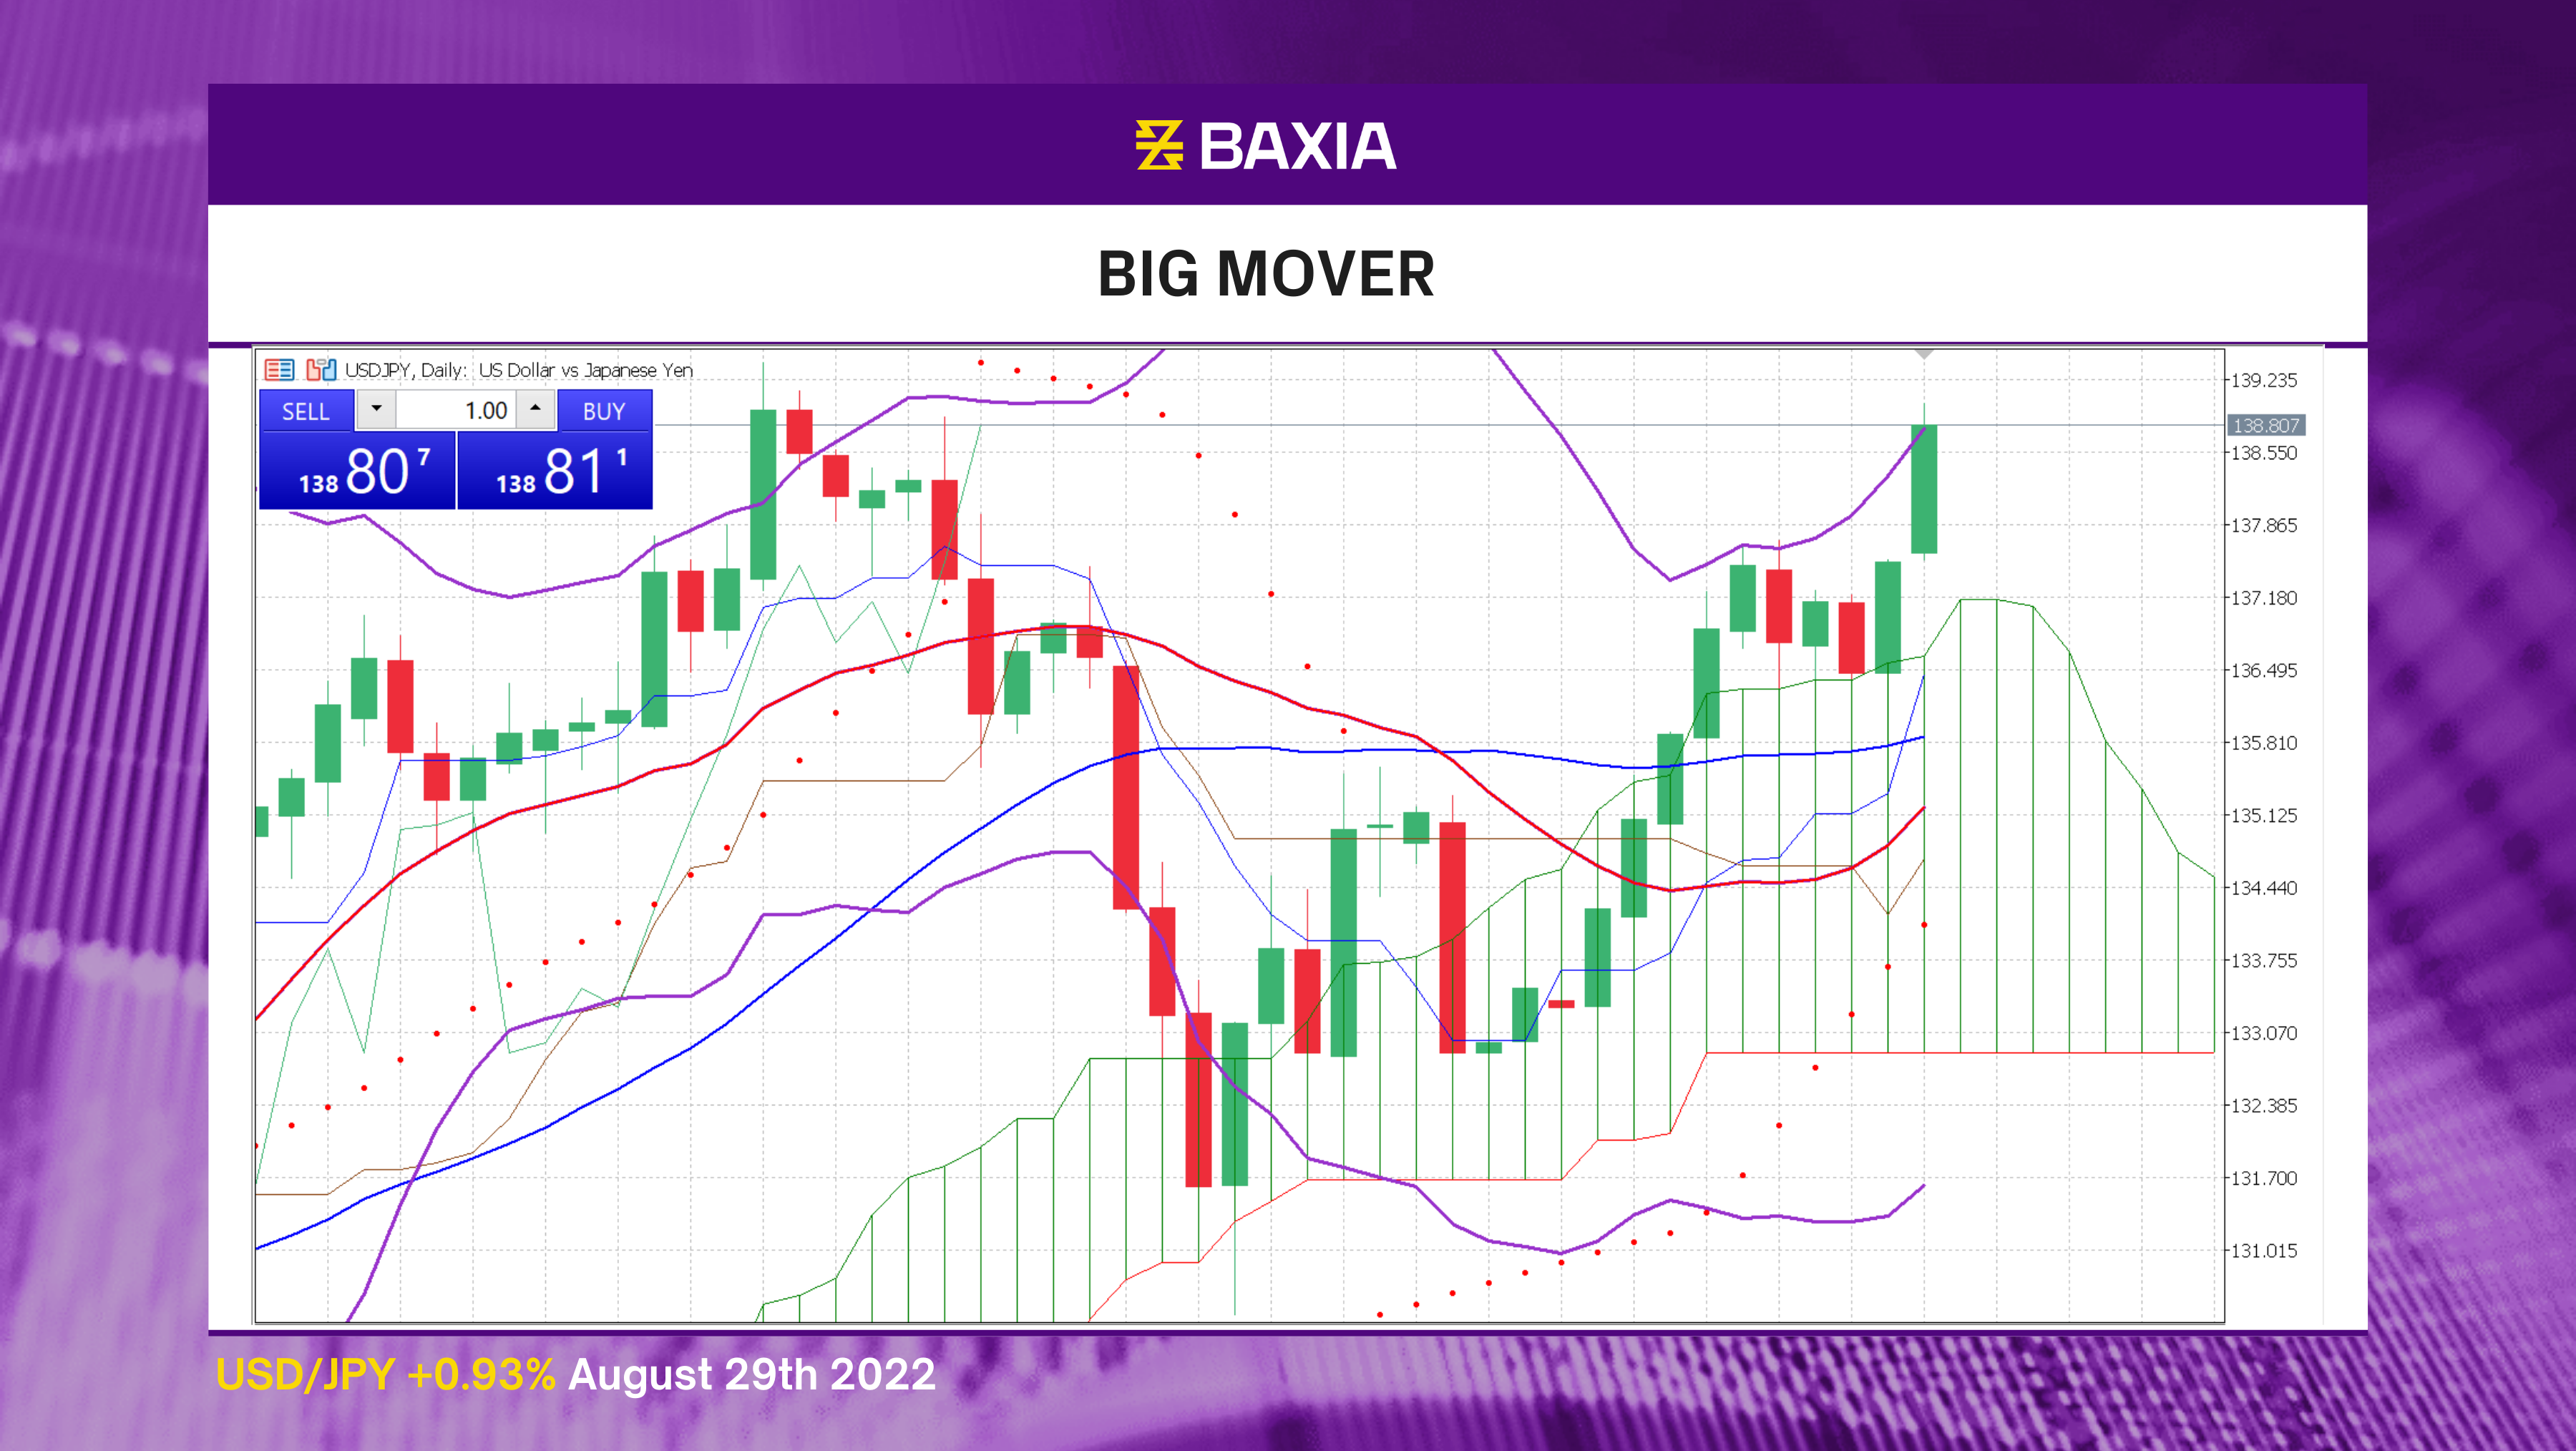
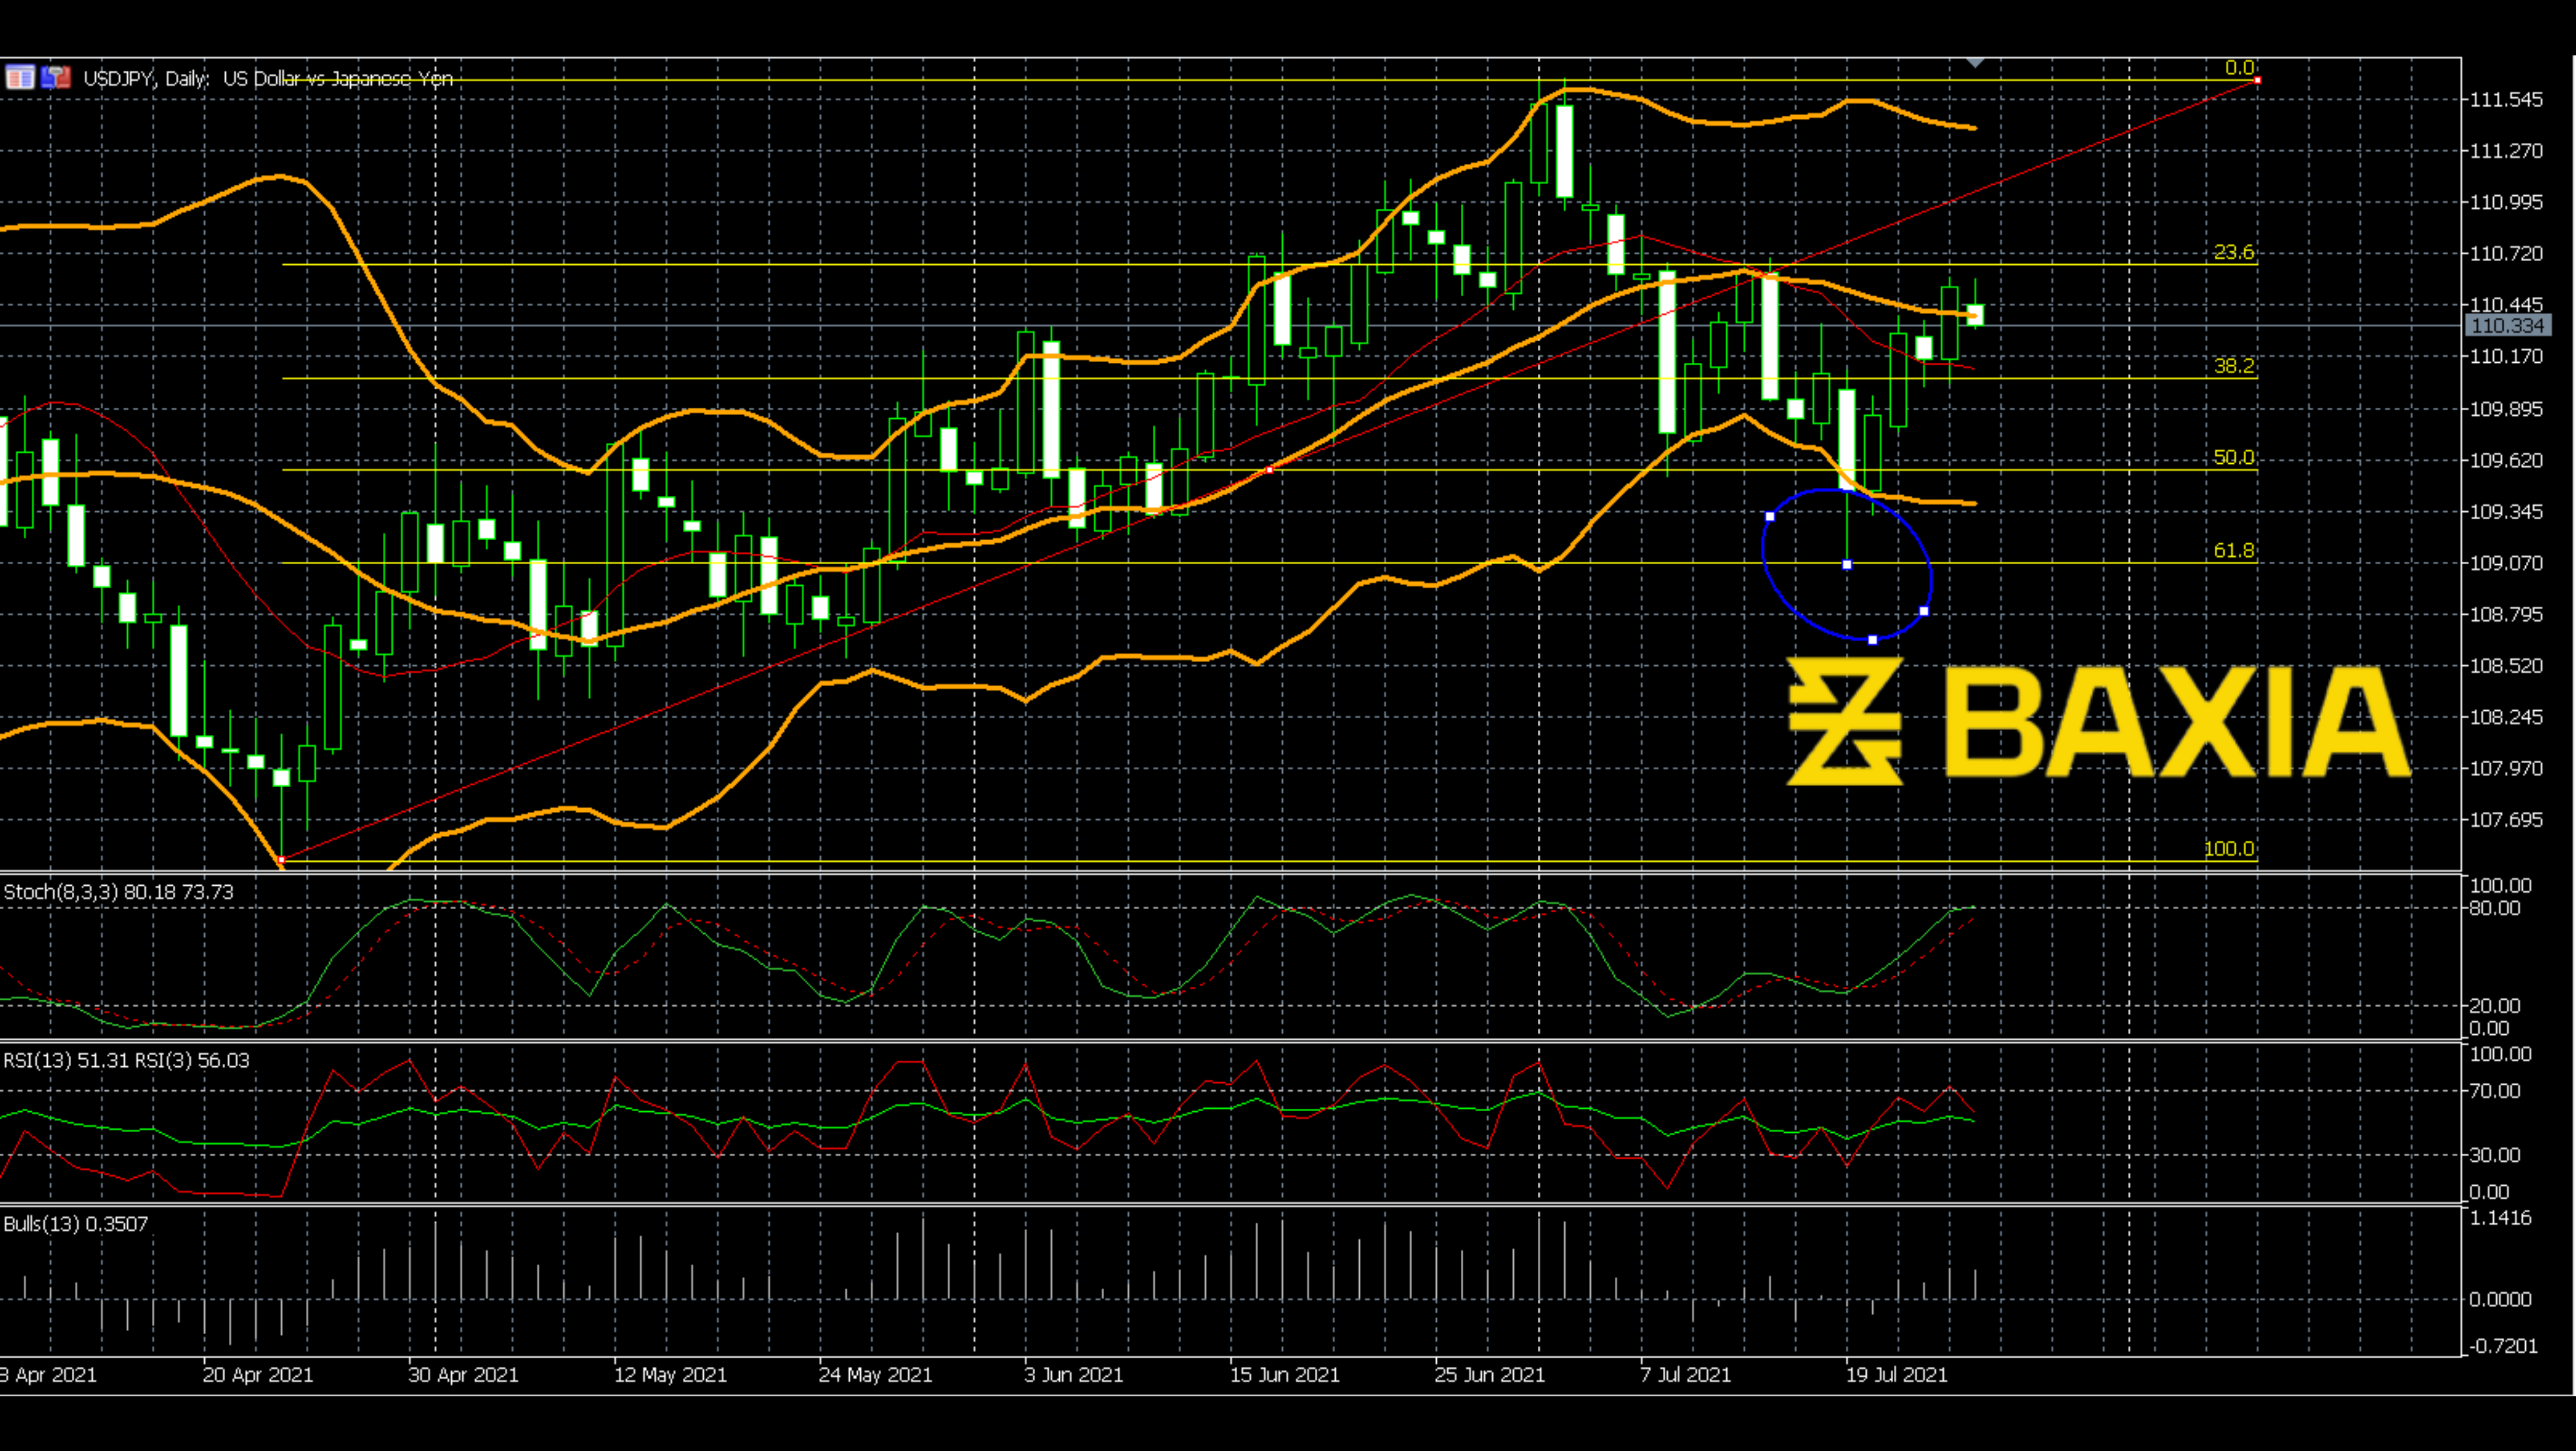
The price of USDJPY had been moving up for almost 49 days, and the price had risen by 3.9%. This upward movement had started on April 20th, which was a precise support level. Then, after several tests on the upper Bollinger Bands, the price went down on June 26th.
As you can see on the chart, the price soon reached the 61.8% Fibonacci level and broke out the lower Bollinger Bands at the same time. The breakout was a signal here; the price found support. The Bollinger Bands pushed the price towards the middle line. The 61.8% Fibonacci level was also a pressure level. So the price bounced back as we expected.
Will the price continue to go up? The general consensus maybe yes. The previous trend was a stable upward trend. It had lasted a long time. We do not believe that the movement has stopped abruptly. The bull power could gain momentum from a low level; it still has room to go.
We love to hear new ideas from traders and want to know what you think!
If you like this topic and want to suggest future topics that you find helpful, let us know by clicking the ‘submit your feedback’ button below.

Trading foreign exchange on margin carries a high level of risk, and may not be suitable for all investors. Before deciding to trade foreign exchange you should carefully consider your investment objectives, level of experience, and risk appetite.
Nothing contained in this website should be construed as investment advice. Any reference to an investment's past or potential performance is not, and should not be construed as, a recommendation or as a guarantee of any specific outcome or profit.