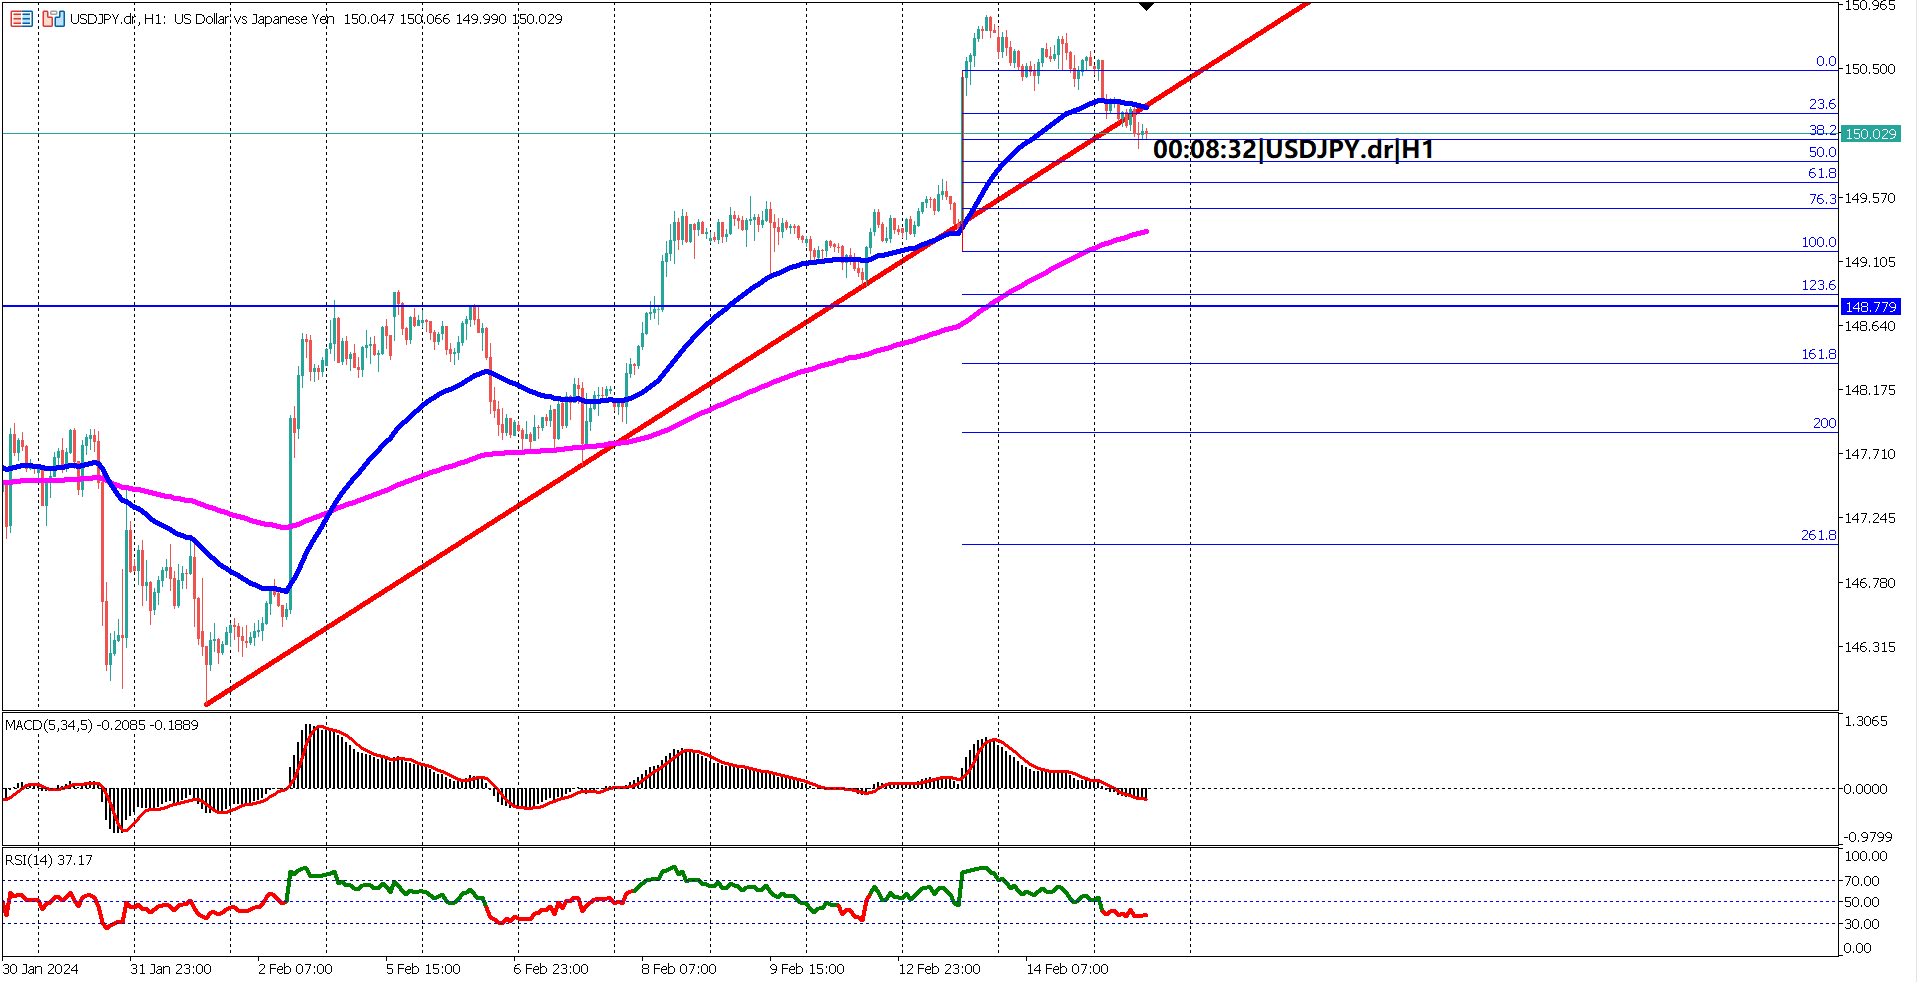

Where will USDJPY go next? Previously, the downward trend had lasted for around 26 days. This was a stable trend, and we can see the angle is steep, and the price barely fluctuated during the downward process, so, is this just a retracement or a turning point for the price? The support point is on April 26th, after which the price started to go up. However, the upward trend did not last long, it seems like it only lasted for about one week, then started to fluctuate. As can be seen, the price has hovered around 108.303, which is also the 50% level Fibonacci.
.png?width=4920&name=Graph%20Template%20(24).png)
The price met the 61.8% Fibonacci level on May 13th, and since then the price has continued to drop. We can therefore assume that the 61.8% Fibonacci level a resistance area. Will the downward trend continue? The price met resistance in both the 50% and 61.8% Fibonacci levels, which means this could be a retracement. The price could be back to a downward trend someday.
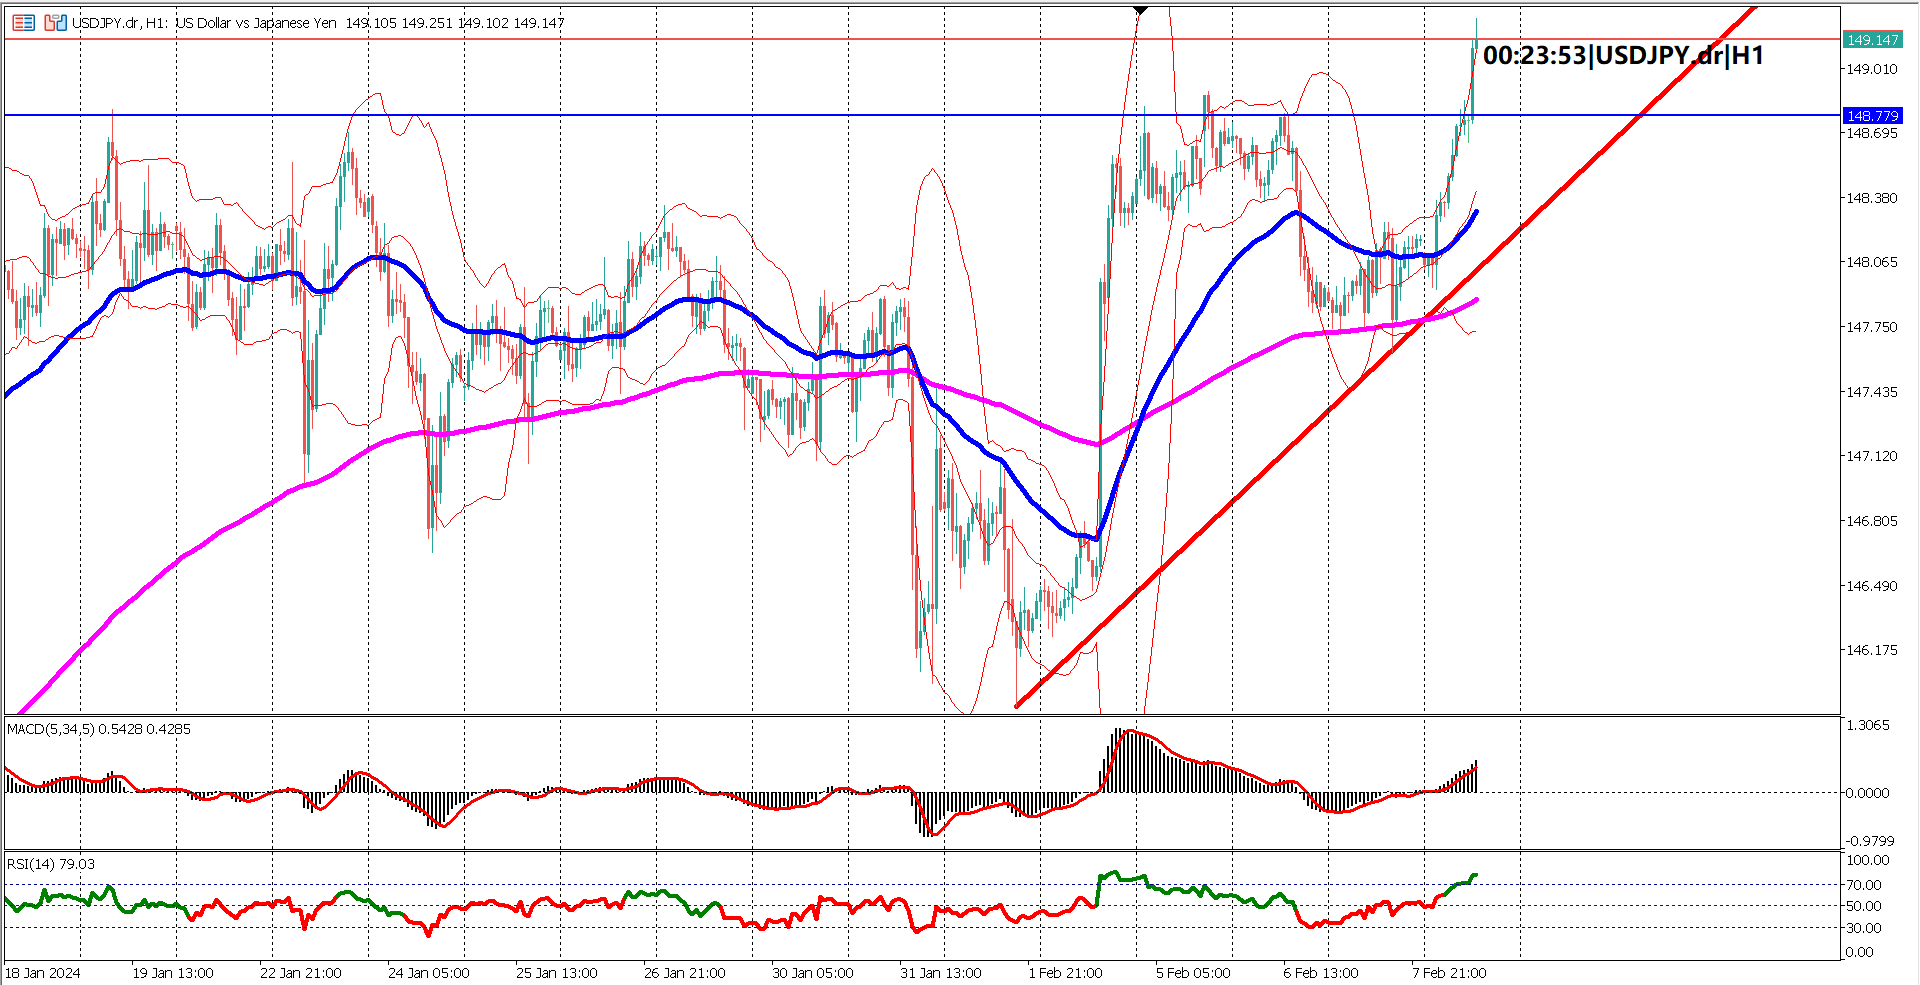
Why are we still seeing this bullish trend you may ask? Well, the MACD indeed makes a bullish cross, and Stochastics are going up, even the price line itself goes up. However, this could be a wave, a fluctuation, something temporary. Keep in mind those signals are short term.
If you like this topic and want to suggest future topics that you find helpful, let us know by clicking the ‘submit your feedback’ button below.

Trading foreign exchange on margin carries a high level of risk, and may not be suitable for all investors. Before deciding to trade foreign exchange you should carefully consider your investment objectives, level of experience, and risk appetite.
Nothing contained in this website should be construed as investment advice. Any reference to an investment's past or potential performance is not, and should not be construed as, a recommendation or as a guarantee of any specific outcome or profit.