
In the dynamic world of forex trading, the USDJPY currency pair has been exhibiting intriguing patterns and developments, influenced by both fundamental data releases and technical indicators.
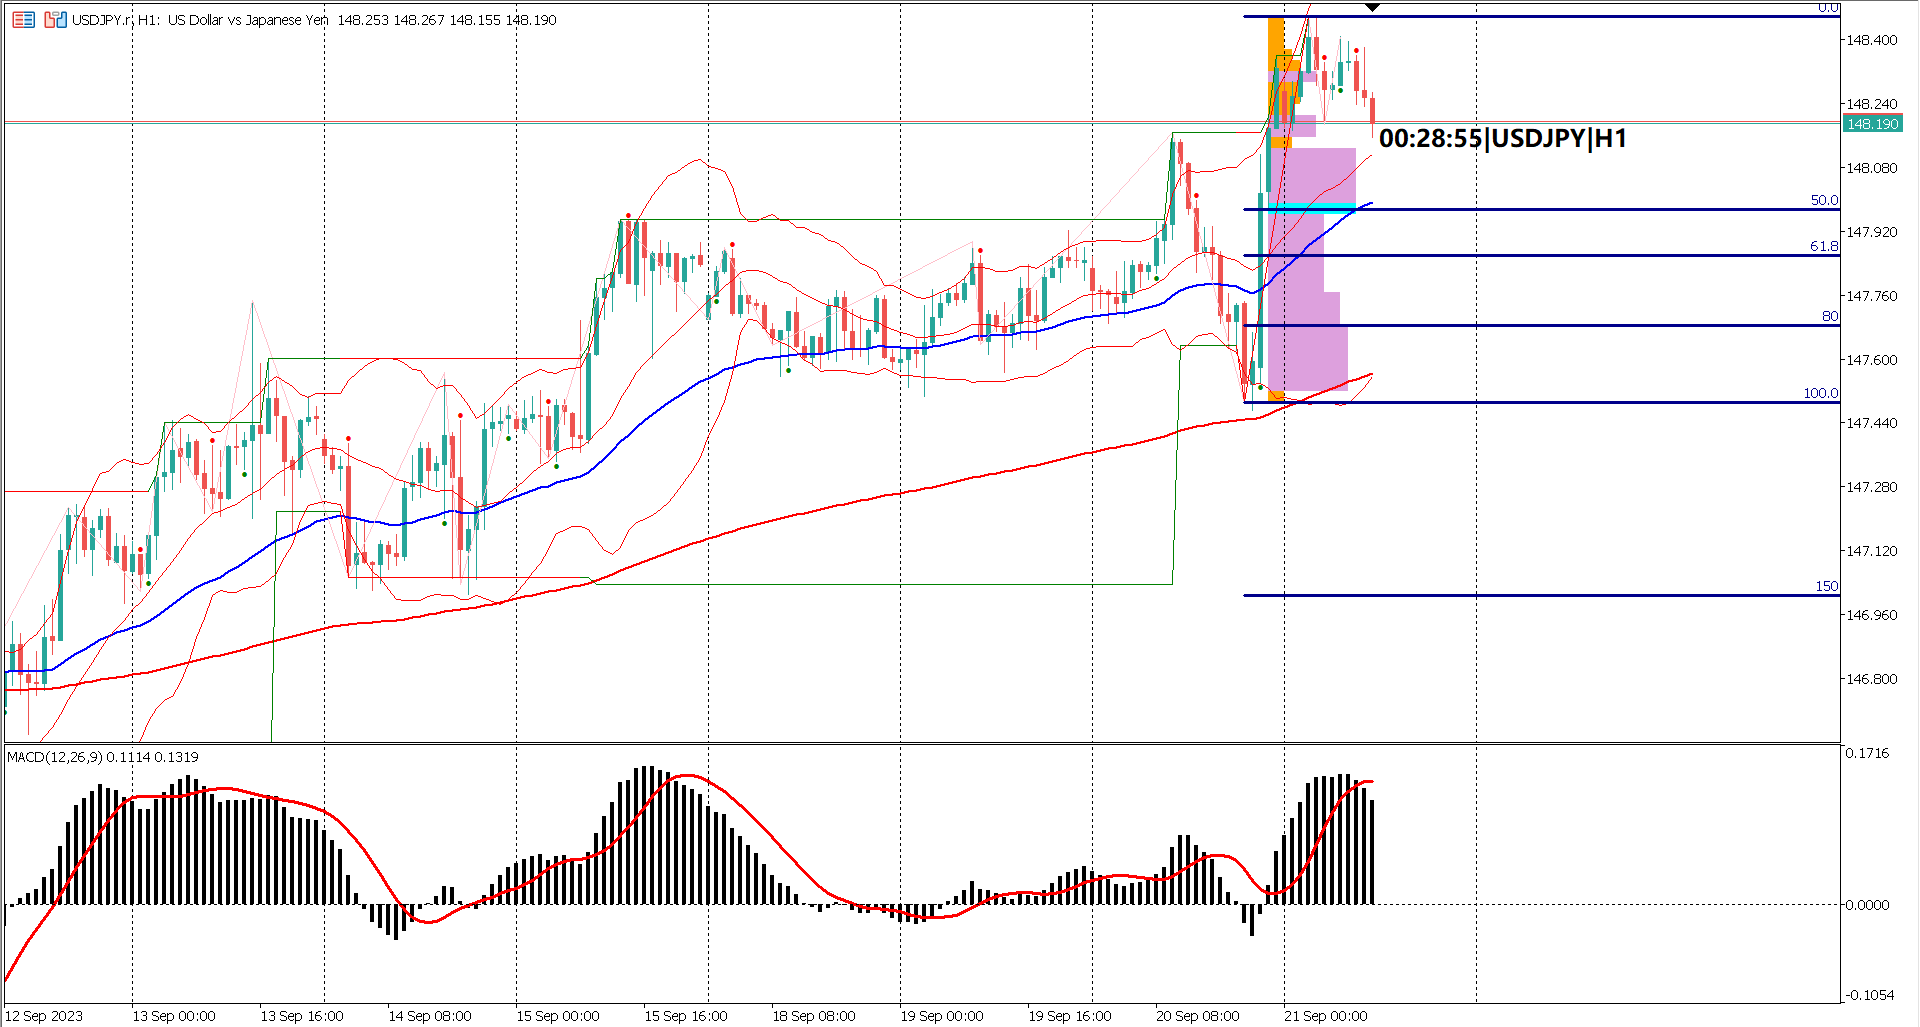
Over the past 8 to 9 weeks, USDJPY has been on a bullish trend, characterized by consistent higher highs and higher lows. However, recent events have injected volatility into the market, particularly with the release of US Consumer Price Index (CPI) data. This data beat forecasts and propelled the US dollar upwards by almost 170 pips against the Japanese yen.
As market participants eagerly await key economic releases, including US core retail sales, initial jobless claims, and the Philadelphia FED manufacturing index, economists' forecasts remain mixed. The only consensus appears to be a higher forecast on the FED manufacturing index.
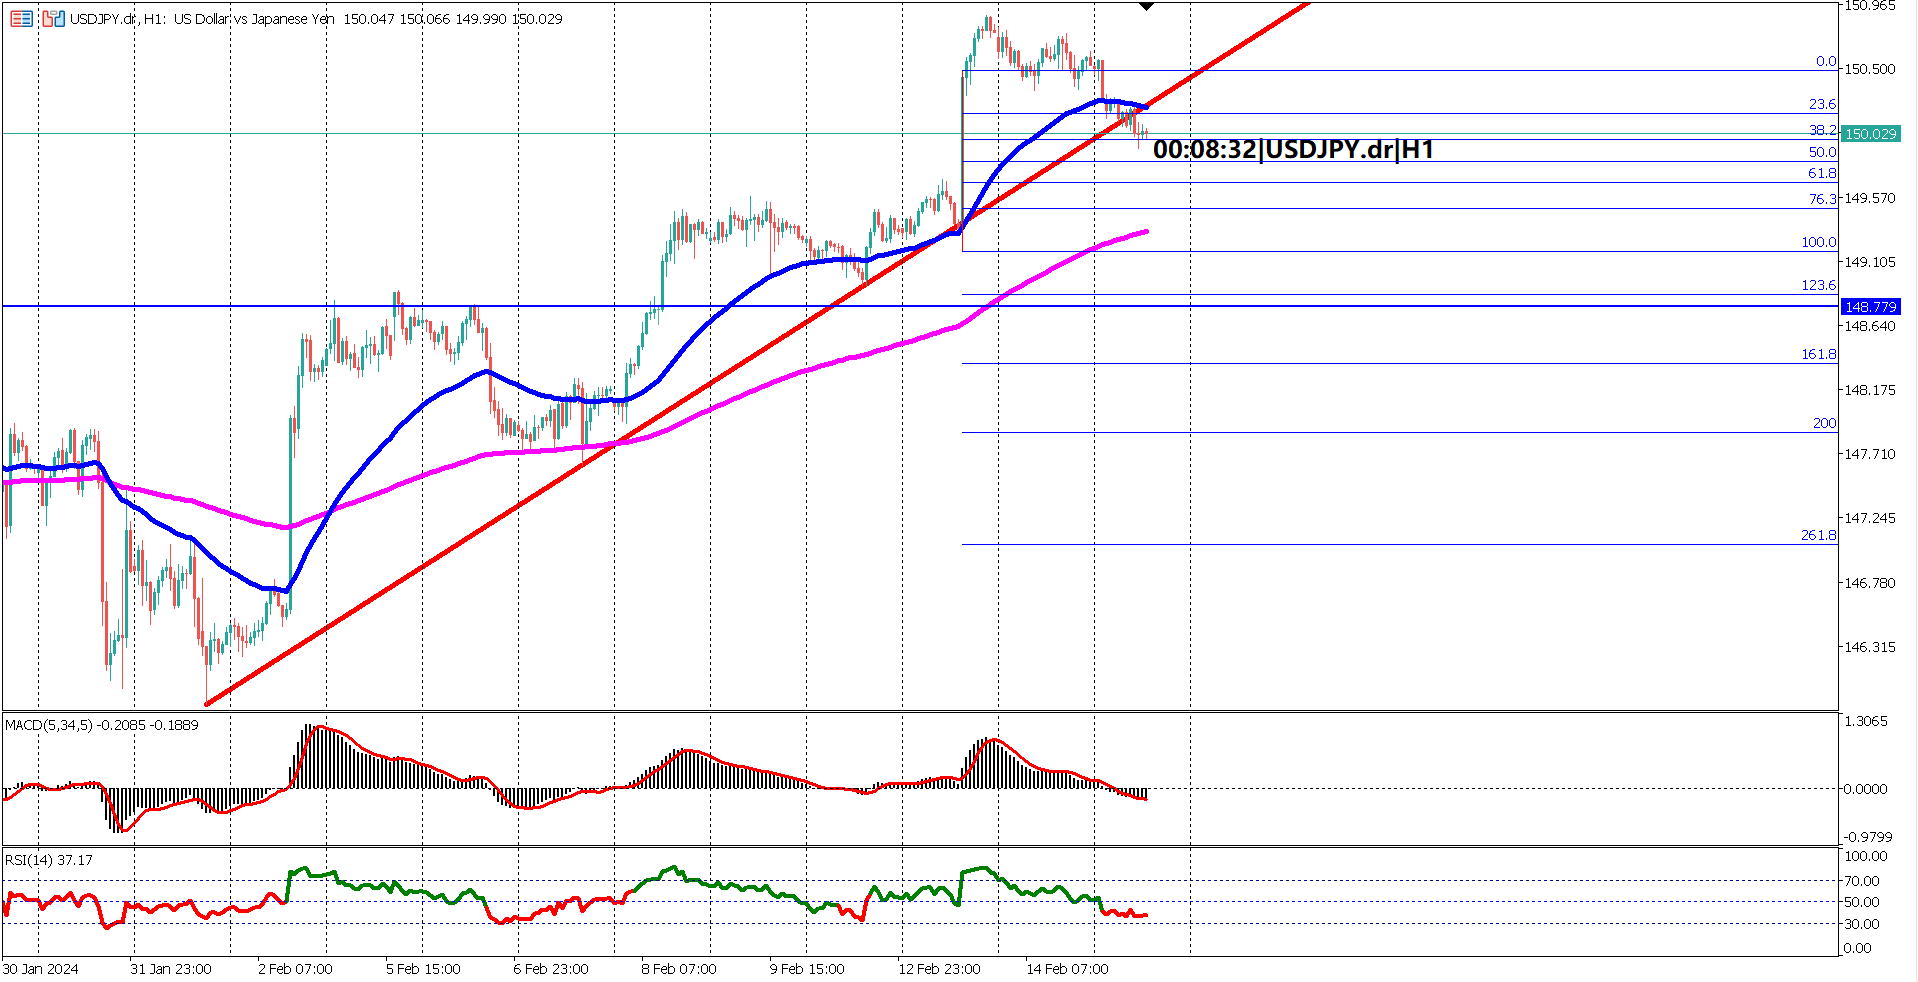
Following the CPI release, USDJPY is experiencing a pullback, potentially towards a point of imbalance. Unusually long candlesticks often signal such imbalances, with prices commonly retracing to that level. Key support levels to watch are around 149.8 or 150 yen, representing approximately 50% of the width of the long bullish candlestick.
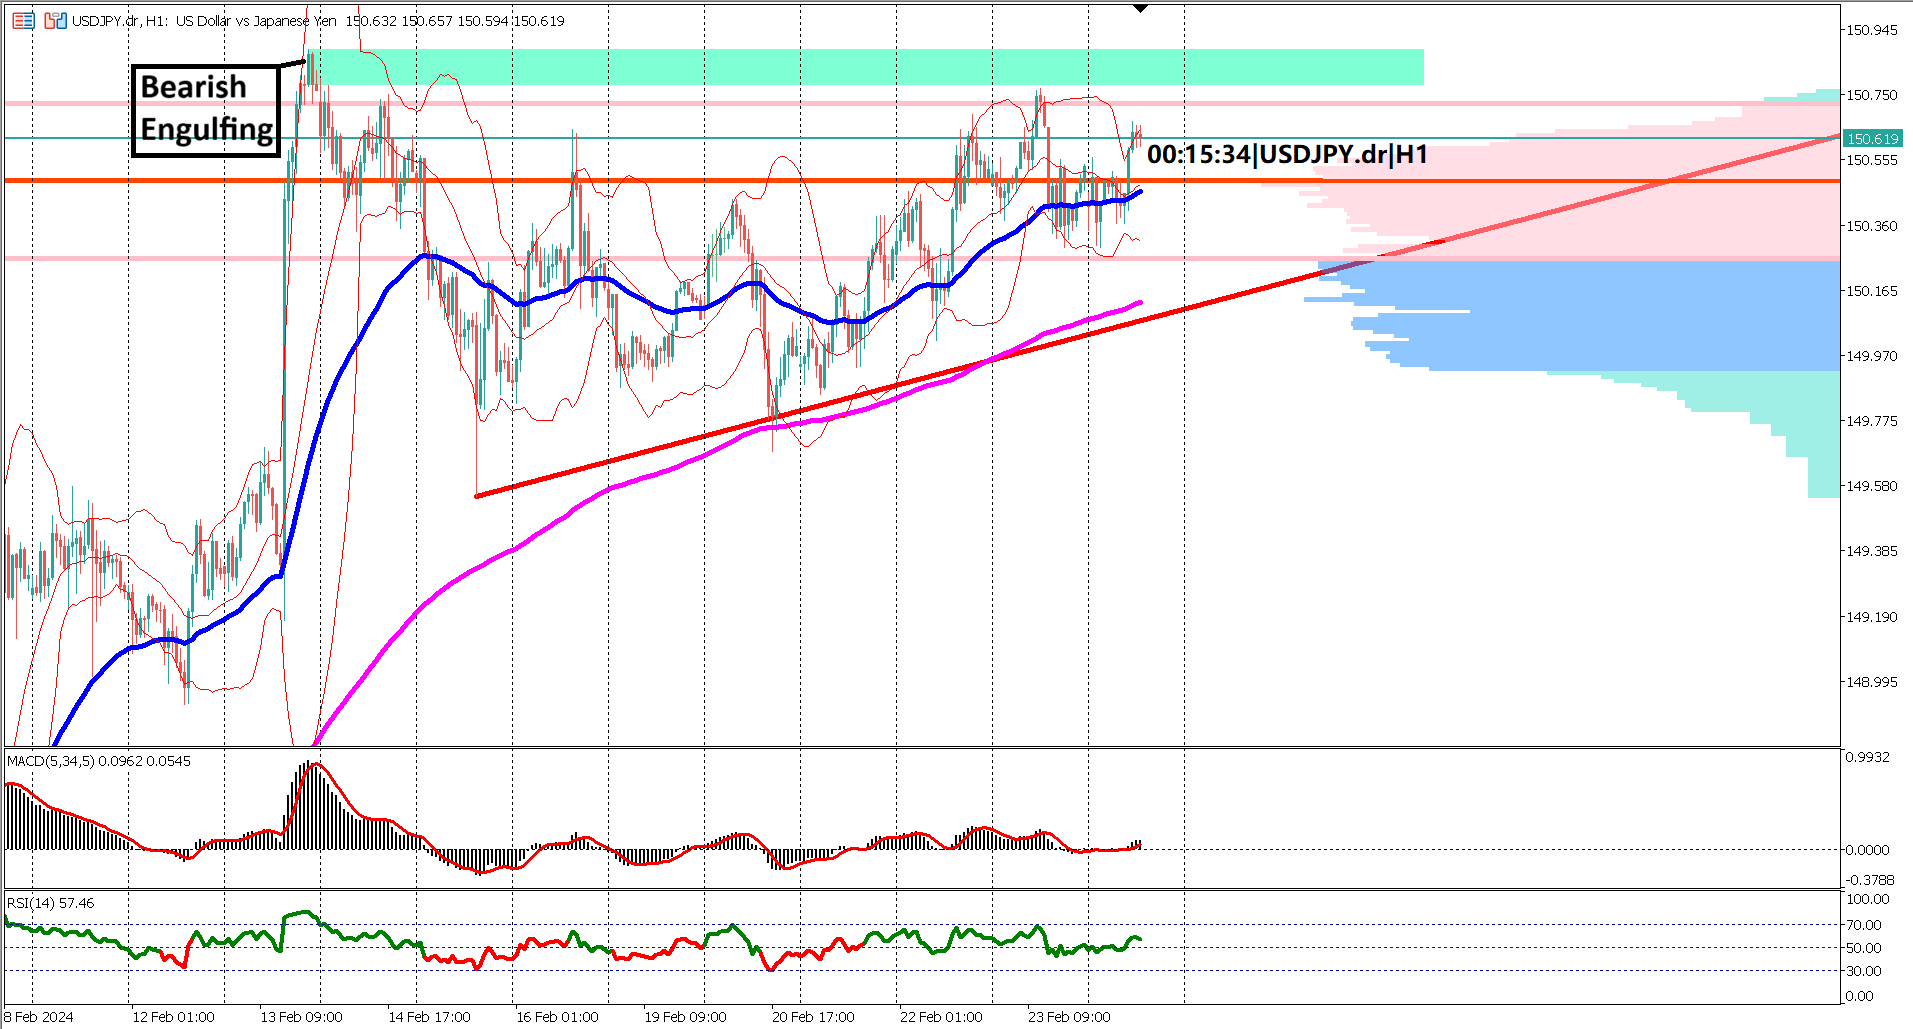
Conversely, key resistance levels are associated with recent bearish engulfing candlesticks, indicating aggressive selling of the US dollar against the Japanese yen.
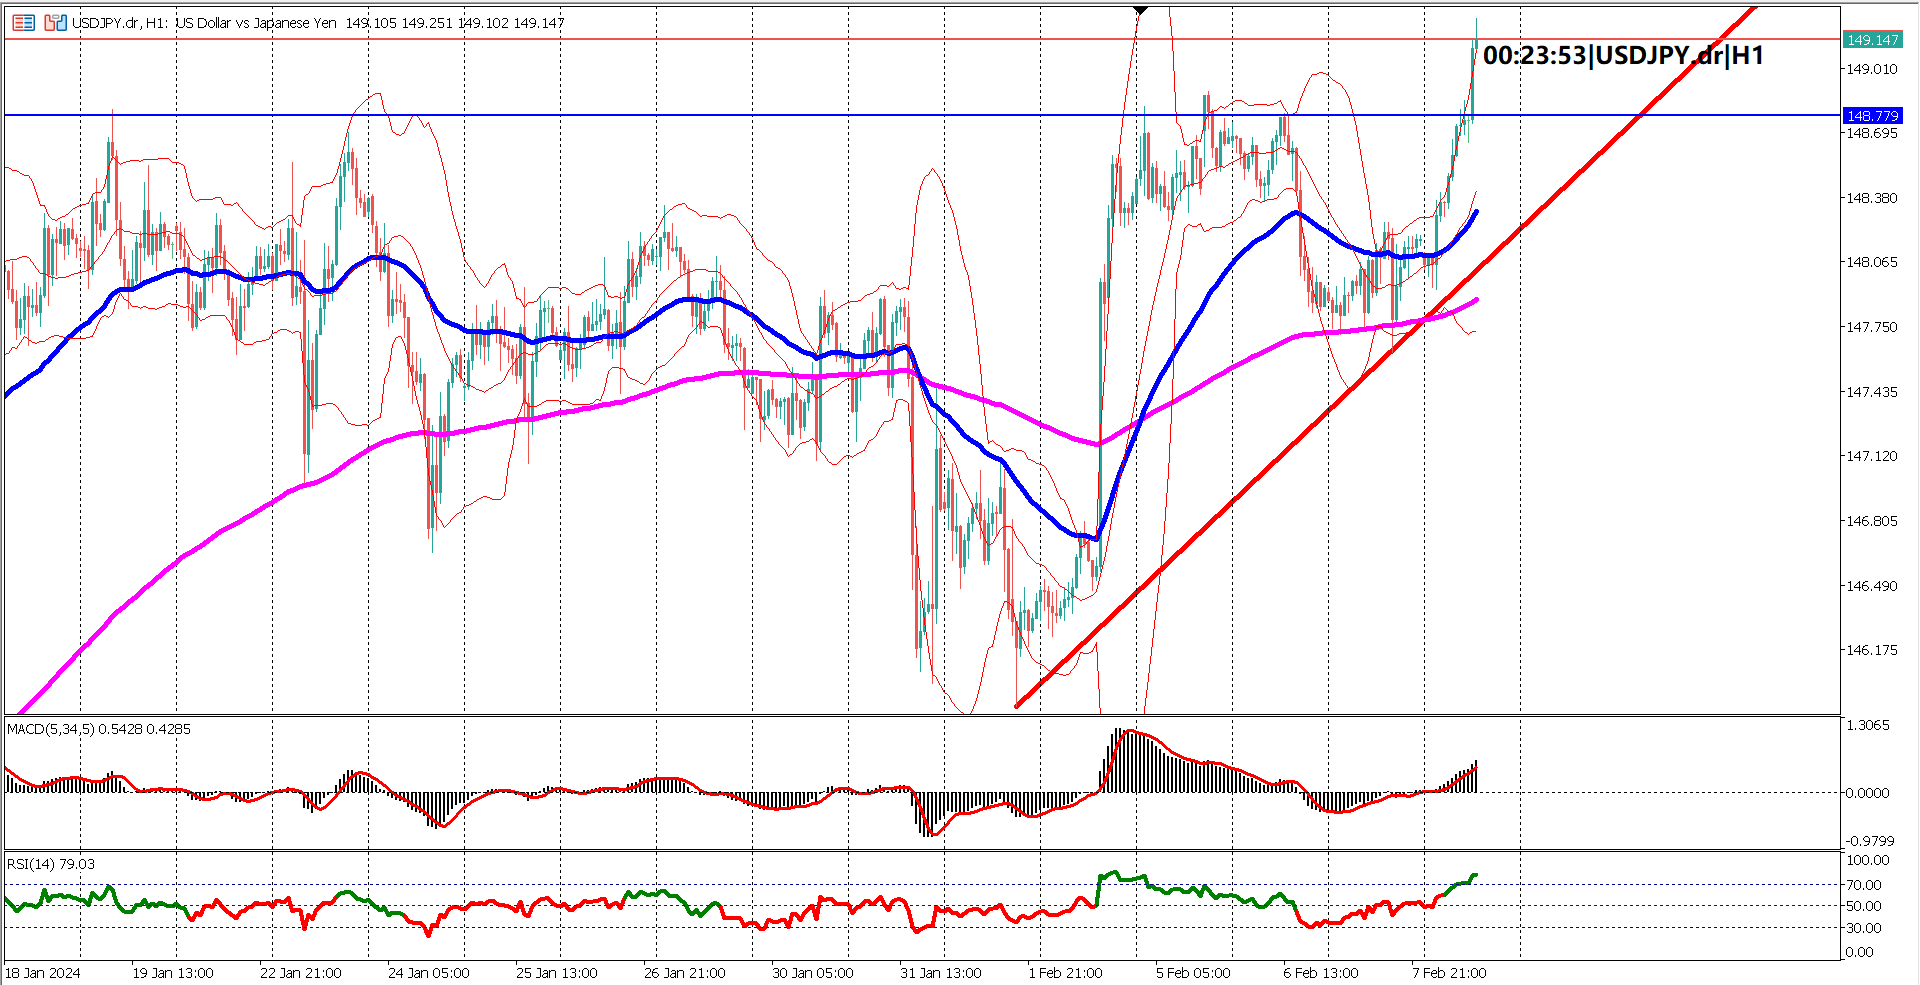
From a technical perspective, the Exponential Moving Average (EMA) 50 is converging towards the EMA 200, suggesting a diminishing bullish momentum. However, until a death cross forms on the EMA 50 and 200, the long-term trend remains bullish.
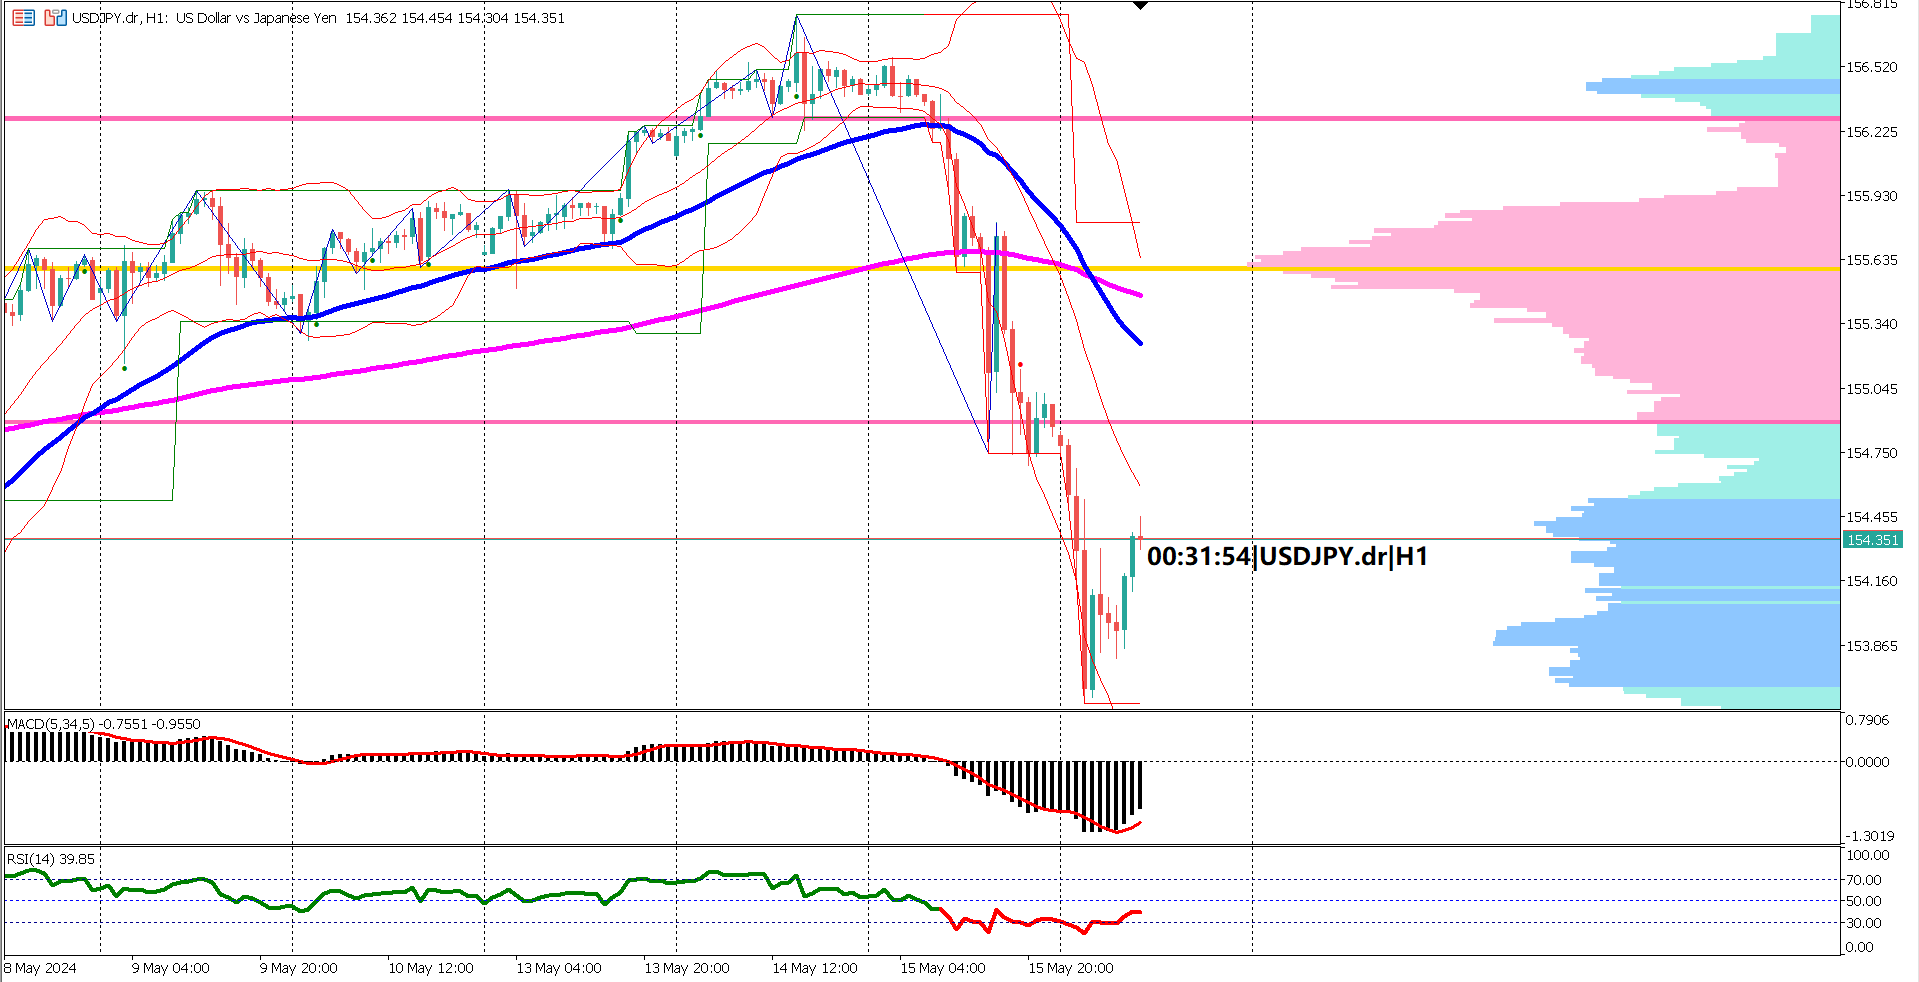
Oscillator indicators further illustrate the current market sentiment, with both the Moving Average Convergence Divergence (MACD) and Relative Strength Index (RSI) showing bearish signals.
Overall, while the long-term trend remains bullish based on EMA 50 and 200, short-term indicators such as MACD and RSI suggest a bearish correction. Confirmation of a bullish trend continuation may hinge on beating economist forecasts for key US economic indicators.
1. USDJPY has been on a bullish trend for the past 8 to 9 weeks, characterized by higher highs and higher lows.
2. Recent US CPI data release caused a spike in the US dollar against the Japanese yen.
3. Market awaits key economic releases with mixed economist forecasts, particularly focusing on US core retail sales, initial jobless claims, and the Philadelphia FED manufacturing index.
4. Technical analysis suggests key support levels around 149.8 or 150 yen, while resistance levels are associated with recent bearish engulfing candlesticks.
5. EMA 50 and 200 indicate a diminishing bullish momentum, while MACD and RSI show bearish signals, suggesting a bullish correction in USDJPY. Confirmation of a bullish trend continuation may depend on economic data releases meeting or exceeding economist forecasts.
Forecast 0.2% vs Previous 0.4%
Forecast 219K vs Previous 218K
Forecast -8.0 vs Previous -10.6

Trading foreign exchange on margin carries a high level of risk, and may not be suitable for all investors. Before deciding to trade foreign exchange you should carefully consider your investment objectives, level of experience, and risk appetite.
Nothing contained in this website should be construed as investment advice. Any reference to an investment's past or potential performance is not, and should not be construed as, a recommendation or as a guarantee of any specific outcome or profit.