
In the dynamic world of forex trading, AUDUSD is drawing attention with its recent price movements and key technical patterns. Let's delve into the intricacies of this currency pair and explore the factors shaping its trajectory.
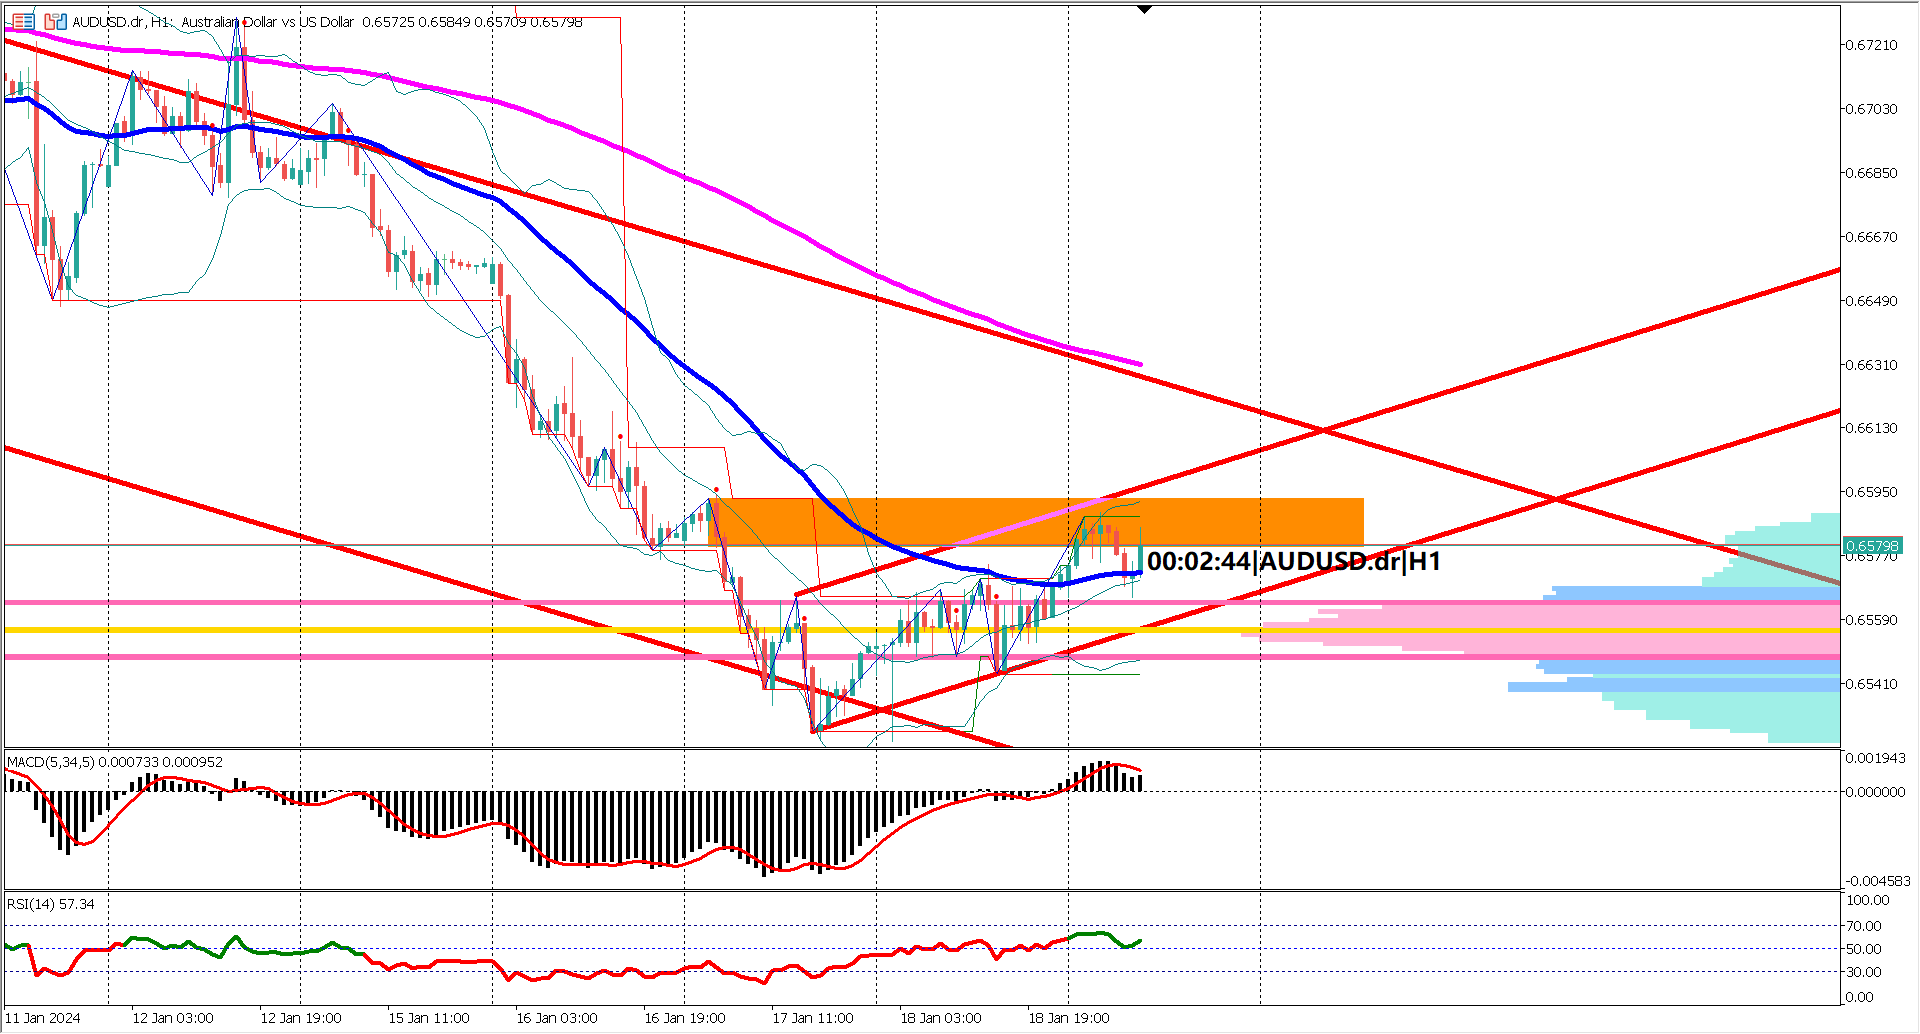
On the 4-hour timeframe chart, AUDUSD appears to be forming an inverted head and shoulder pattern, a bullish reversal signal. Over the past two weeks, AUDUSD has exhibited short-term bearish behavior, potentially finding support at the 76.3% Fibonacci retracement level. This pattern suggests a possible shift in market sentiment from bearish to bullish.
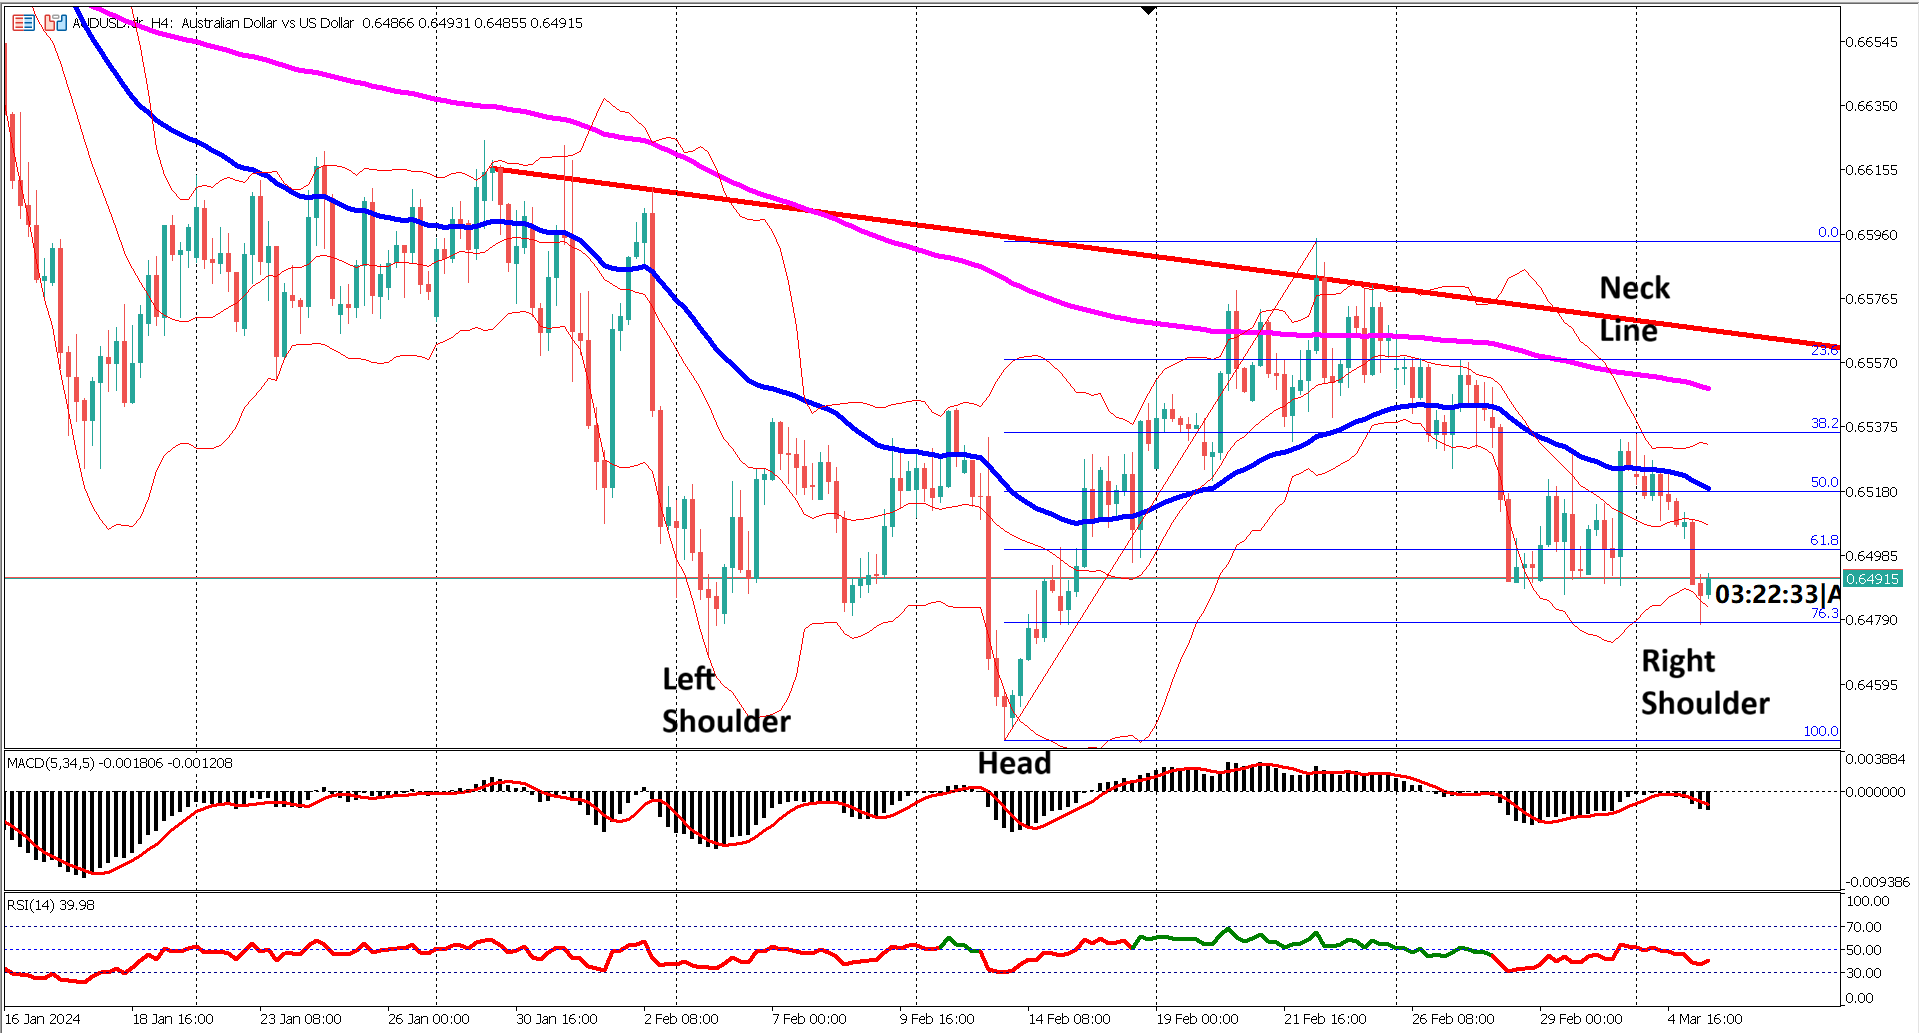
Today's economic news from Australia includes Building Approvals and Company Gross Operating Profits. The mixed results have contributed to AUDUSD dropping to the 76.3% Fibonacci retracement level during the Asian trading session. The critical juncture lies in whether the price holds above this level or breaks below it. A breach below 76.3% could negate the potential inverted head and shoulder pattern, while a hold could signal further bullish momentum.
Examining the EMA 50 and 200, both indicators are pointing downwards, indicating bearish momentum. The expanding distance between the EMAs reinforces this sentiment. Additionally, AUDUSD has been trading along the lower band of the Bollinger Bands, signaling a bearish trend. However, the expanding bands suggest heightened volatility, potentially paving the way for unexpected price movements. A breakout above the upper Bollinger Band could signal a challenge to the neckline of the inverted head and shoulder pattern.
Considering oscillator indicators, their reliability may be limited due to the sideways trend formed by the inverted head and shoulder pattern. Traders should exercise caution and consider other factors when interpreting these signals.
In summary, confirming the inverted head and shoulder pattern hinges on price action breaching the neckline. Traders should monitor key support and resistance levels closely to gauge AUDUSD's next moves in the forex market. Stay informed and adapt your strategies accordingly as the market unfolds.
Actual -1.0% vs Forecast 3.8% vs Previous -10.1%

Trading foreign exchange on margin carries a high level of risk, and may not be suitable for all investors. Before deciding to trade foreign exchange you should carefully consider your investment objectives, level of experience, and risk appetite.
Nothing contained in this website should be construed as investment advice. Any reference to an investment's past or potential performance is not, and should not be construed as, a recommendation or as a guarantee of any specific outcome or profit.