
The NZDUSD pair finds itself at a critical crossroads following the unexpected surge in US GDP, shaking the foundation of the Kiwi's recent dynamics. As we dissect the charts, an intriguing pattern emerges – the inverted head and shoulders – adding an extra layer of complexity to the unfolding narrative.
US GDP Surprises, NZDUSD Reacts:
The recent revelation of US GDP surpassing economists' forecasts at 3.3% compared to the projected 2.0% injected fresh volatility into the markets. While the Kiwi's trend against the USD remains bearish, the sudden surge in US economic performance has set the stage for potential shifts.
Inverted Head and Shoulders Pattern Unveiled:
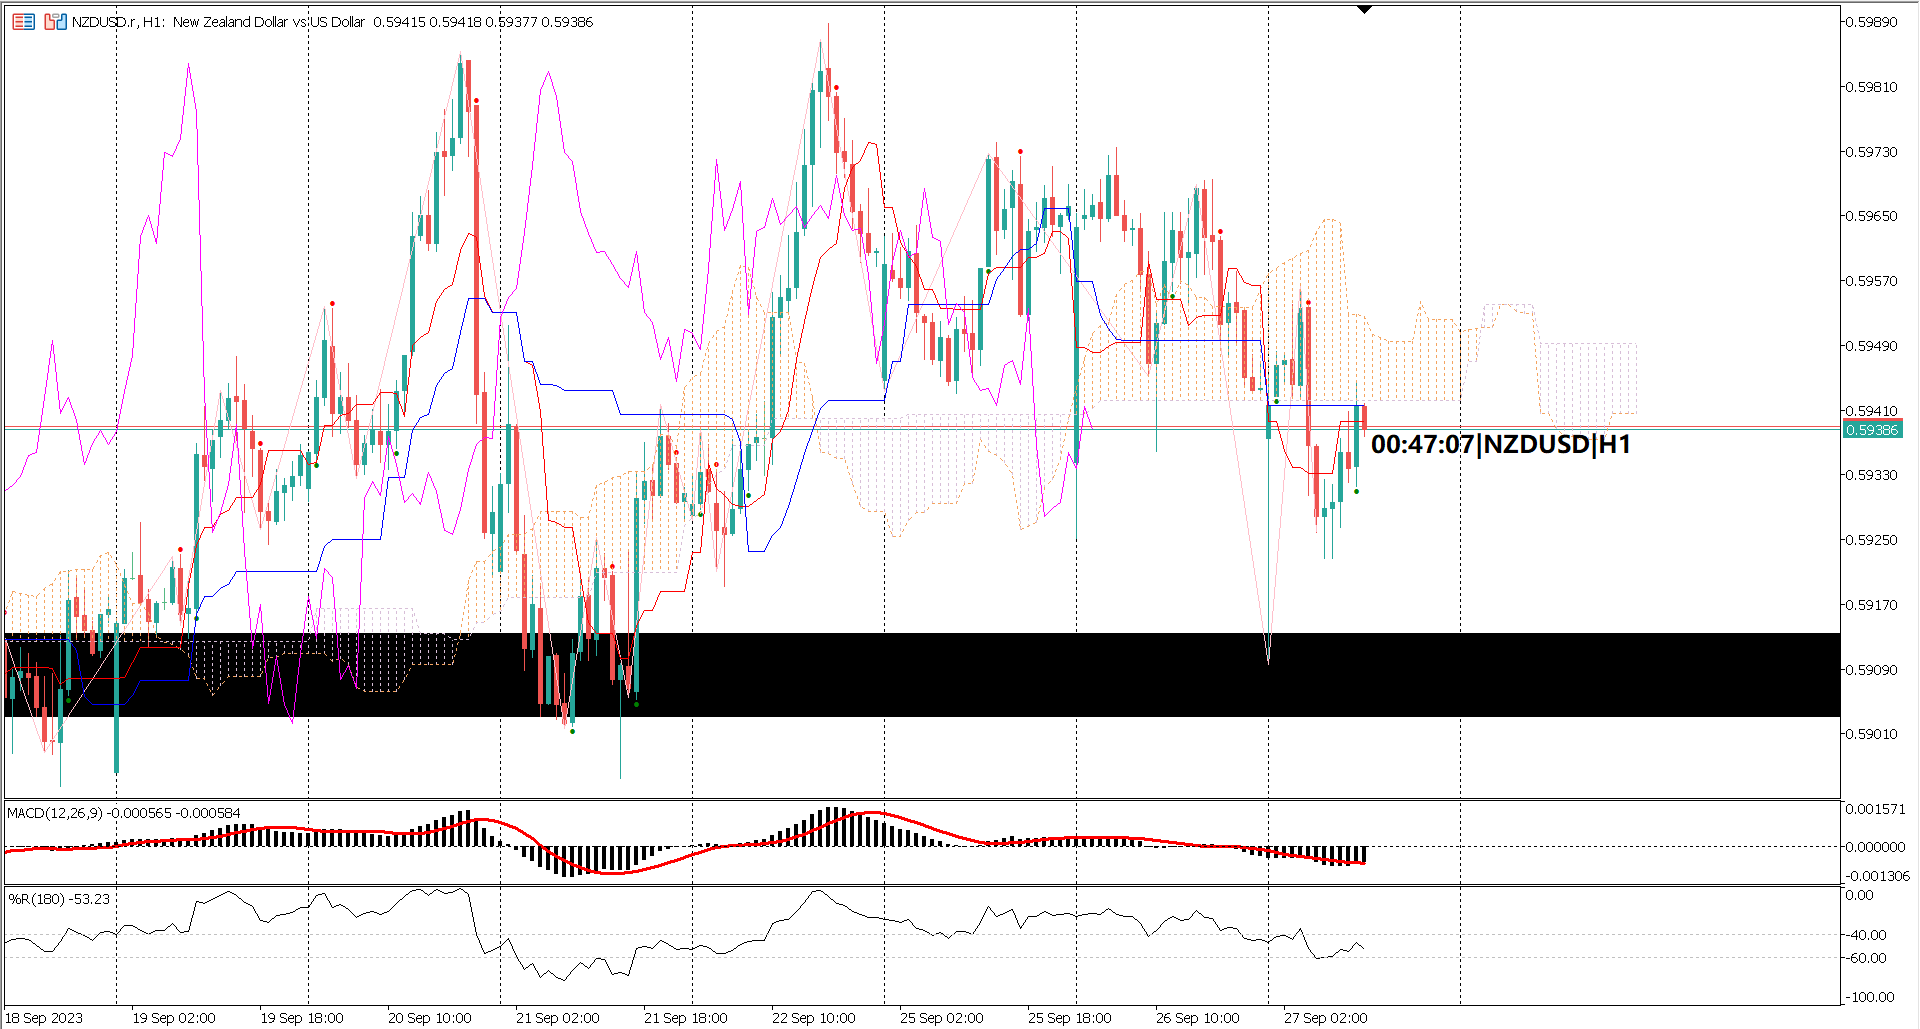
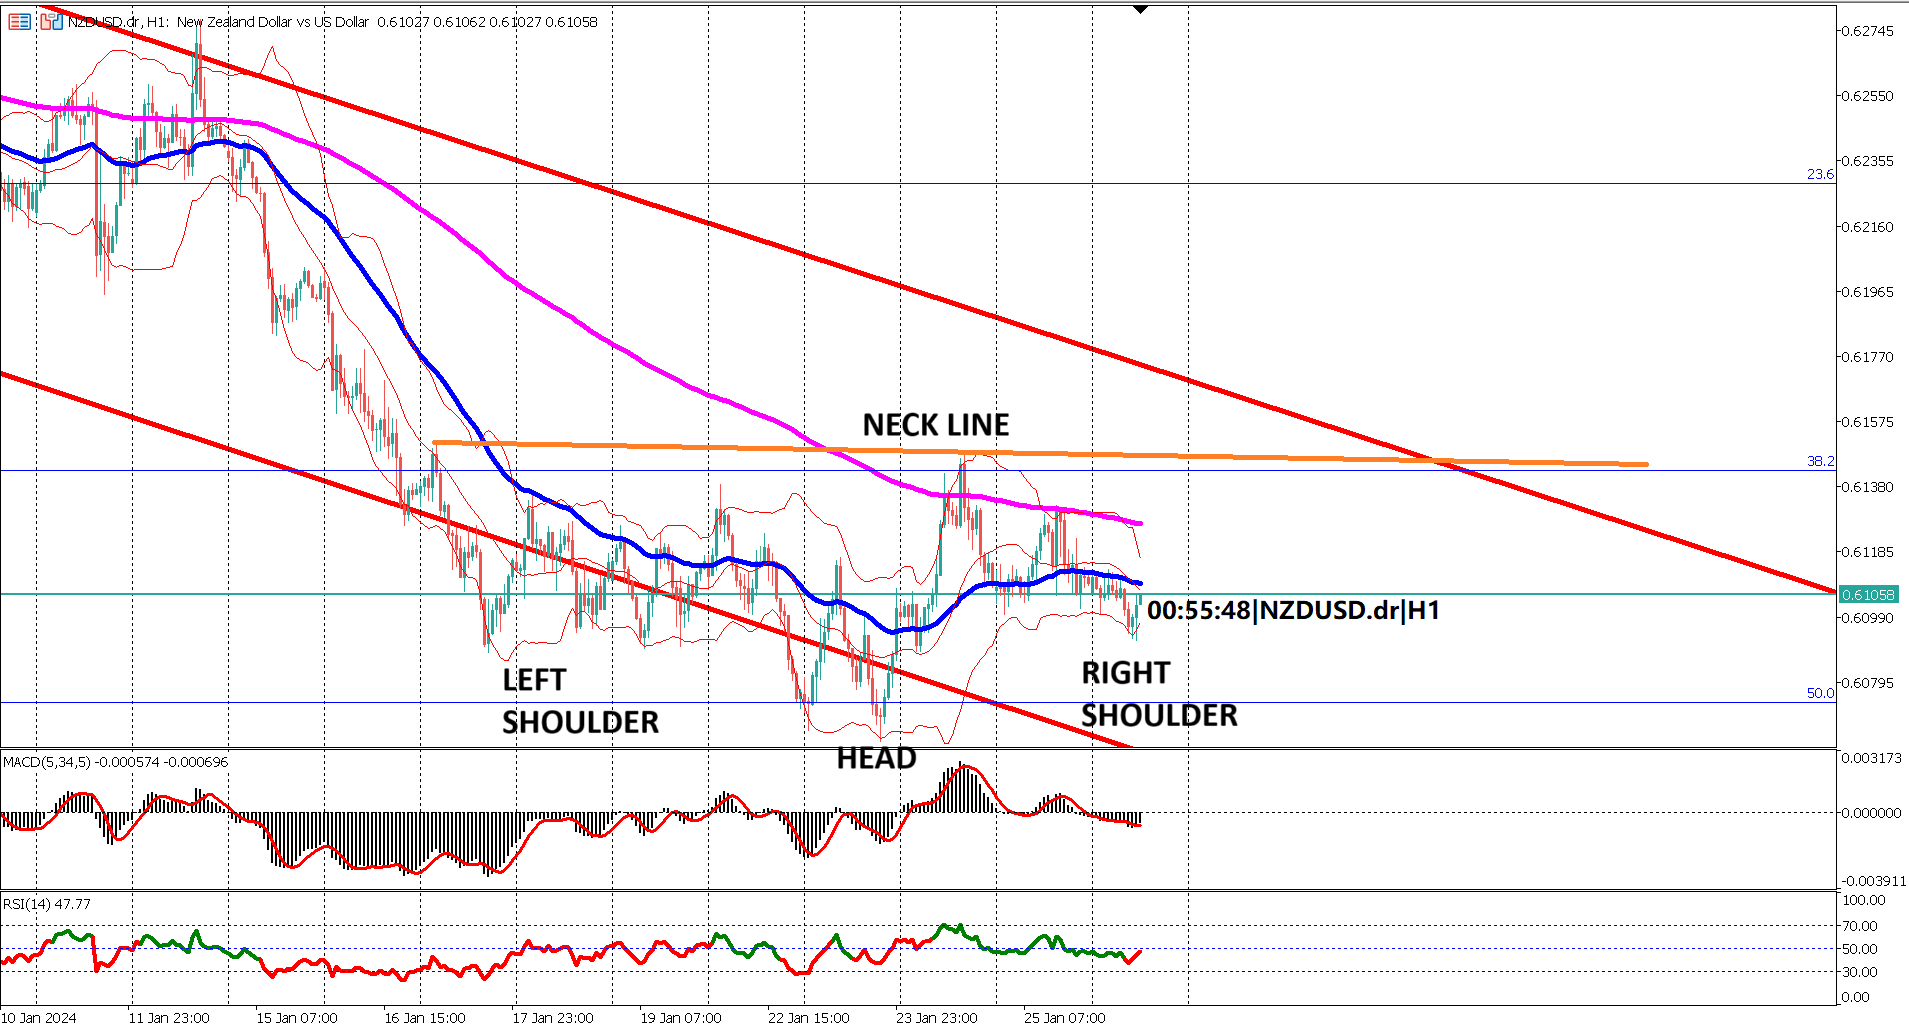
Zooming into the 1-hour chart of NZDUSD reveals the presence of an inverted head and shoulders pattern. This classical reversal pattern presents a potential turnaround for the Kiwi. The pattern includes a head, two shoulders, and a neckline (marked by the orange line). A breach above the neckline could signal a bullish reversal, challenging the prevailing bearish sentiment.
Key Levels and Potential Reversal:
The neckline, acting as a pivotal level at 1.0931, holds the key to the fate of the inverted head and shoulders pattern. A clear break above this level may confirm the bullish reversal, while a failure to breach could see the pattern invalidated.
Core PCE Price Index: A Catalyst for the Kiwi?
Adding to the intrigue, today's release of the Core PCE Price Index carries the potential to influence NZDUSD's trajectory. A lower-than-expected figure of 3.0% may offer a compelling reason for traders to sell USD and favor the NZD, potentially aligning with the narrative of the inverted head and shoulders pattern.
Cautionary Notes and Chart Dynamics:
While the inverted head and shoulders pattern is promising, traders should exercise caution. Head and shoulders patterns are often associated with sideways markets, and relying solely on oscillators may not provide a clear trend indication.
Conclusion:
In conclusion, the NZDUSD pair stands at a pivotal juncture, caught between the surprise of US GDP data and the potential reversal signaled by the inverted head and shoulders pattern. Chart enthusiasts and traders alike await the outcome of the Core PCE Price Index release to decipher the Kiwi's next move. The interplay between economic data and chart patterns will likely shape the narrative for NZDUSD in the coming sessions.
Forecast 0.2% vs Previous 0.1%
Forecast 3.0% vs Previous 3.2%
 Trading foreign exchange on margin carries a high level of risk, and may not be suitable for all investors. Before deciding to trade foreign exchange you should carefully consider your investment objectives, level of experience, and risk appetite.
Nothing contained in this website should be construed as investment advice. Any reference to an investment's past or potential performance is not, and should not be construed as, a recommendation or as a guarantee of any specific outcome or profit.