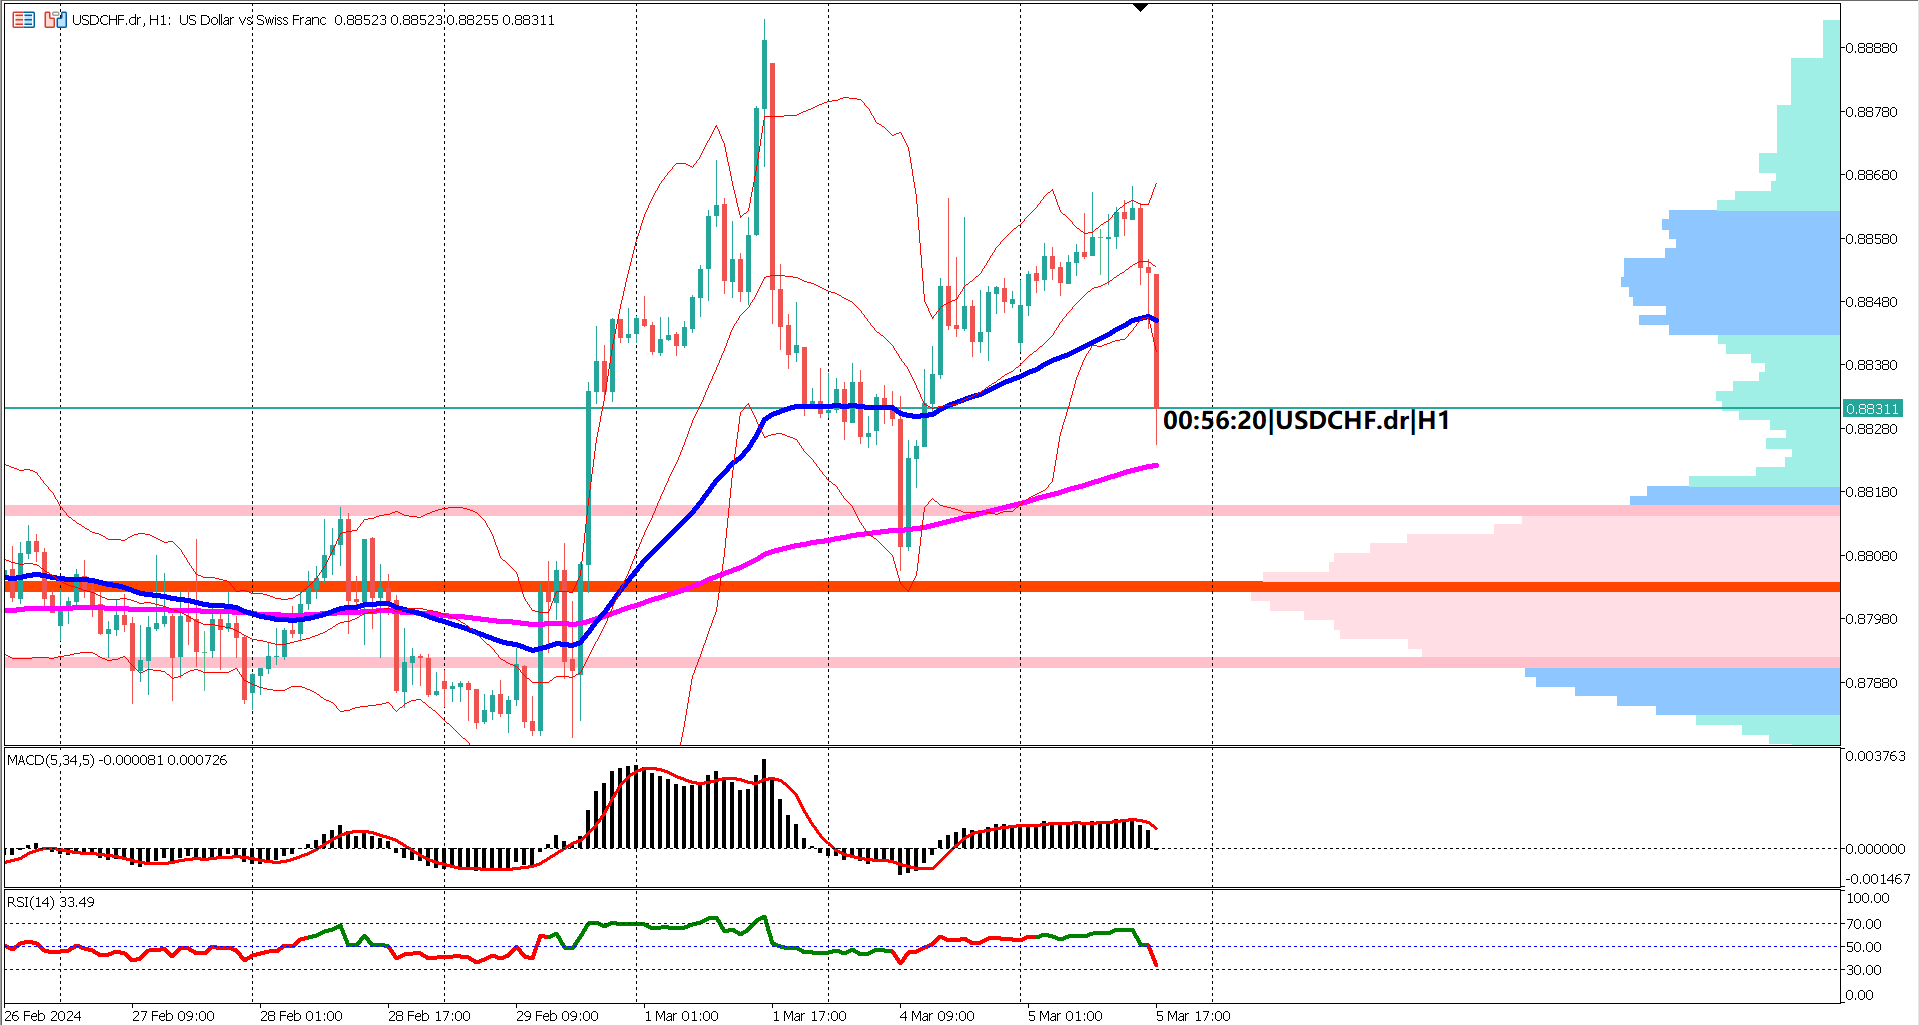
Amidst a flurry of US economic news today, the USDCHF pair experienced mixed results, primarily influenced by S&P Global Services PMI and ISM Non-Manufacturing data. While ISM figures fell below economists' forecasts, leading to a decline in the USD against the CHF, the market dynamics remain complex.
Technical analysis reveals a significant break of the EMA 50, with the indicator now bending towards the EMA 200. This shift suggests a potential weakening of bullish momentum, yet the EMA 50 still remains above the EMA 200, indicating prevailing bullish sentiment. Traders are closely monitoring whether the EMA 50 will converge towards the EMA 200, signaling a strengthening of bearish sentiment or find support at the EMA 200, facilitating a potential price pullback.

Further examination of the Bollinger Bands indicates expanding volatility, with current prices trading on the lower band. This positioning suggests a bearish sentiment in the market, potentially leading to a close below the lower band, emphasizing the volatile nature of the current market conditions.
In addition, analysis of the volume profile indicator reveals that prices are currently trading above the value area, corroborating the bullish sentiment observed in the EMA indicators. Key support is identified at the lower band of the value area, around the 0.8790 level, providing a critical level for traders to monitor.
Finally, oscillator indicators such as the RSI and MACD provide additional insight into market sentiment. The RSI has entered bearish territory as it breached below the 40% level, signaling a shift towards bearish sentiment. Meanwhile, although the MACD remains bullish with the signal line above the 0 line, it approaches a potential crossover, suggesting a possible weakening of bullish momentum in the near future.
In conclusion, while USDCHF faces mixed economic news and technical indicators hint at potential shifts in sentiment, traders must remain vigilant and adapt their strategies accordingly to navigate the evolving market landscape.
USD, S&P Global Services PMI
Actual 52.3 vs Forecast 51.3 vs Previous 52.5
USD, ISM Non-Manufacturing PMI
Actual 52.6 vs Forecast 53.0 vs Previous 53.4
USD, ISM Non-Manufacturing Prices
Actual 58.6 AForecast 62.0 vs Previous 64.0

Trading foreign exchange on margin carries a high level of risk, and may not be suitable for all investors. Before deciding to trade foreign exchange you should carefully consider your investment objectives, level of experience, and risk appetite.
Nothing contained in this website should be construed as investment advice. Any reference to an investment's past or potential performance is not, and should not be construed as, a recommendation or as a guarantee of any specific outcome or profit.


