
In the world of forex trading, the GBPUSD currency pair is currently exhibiting intriguing patterns and dynamics, influenced by both fundamental economic data releases and technical indicators.
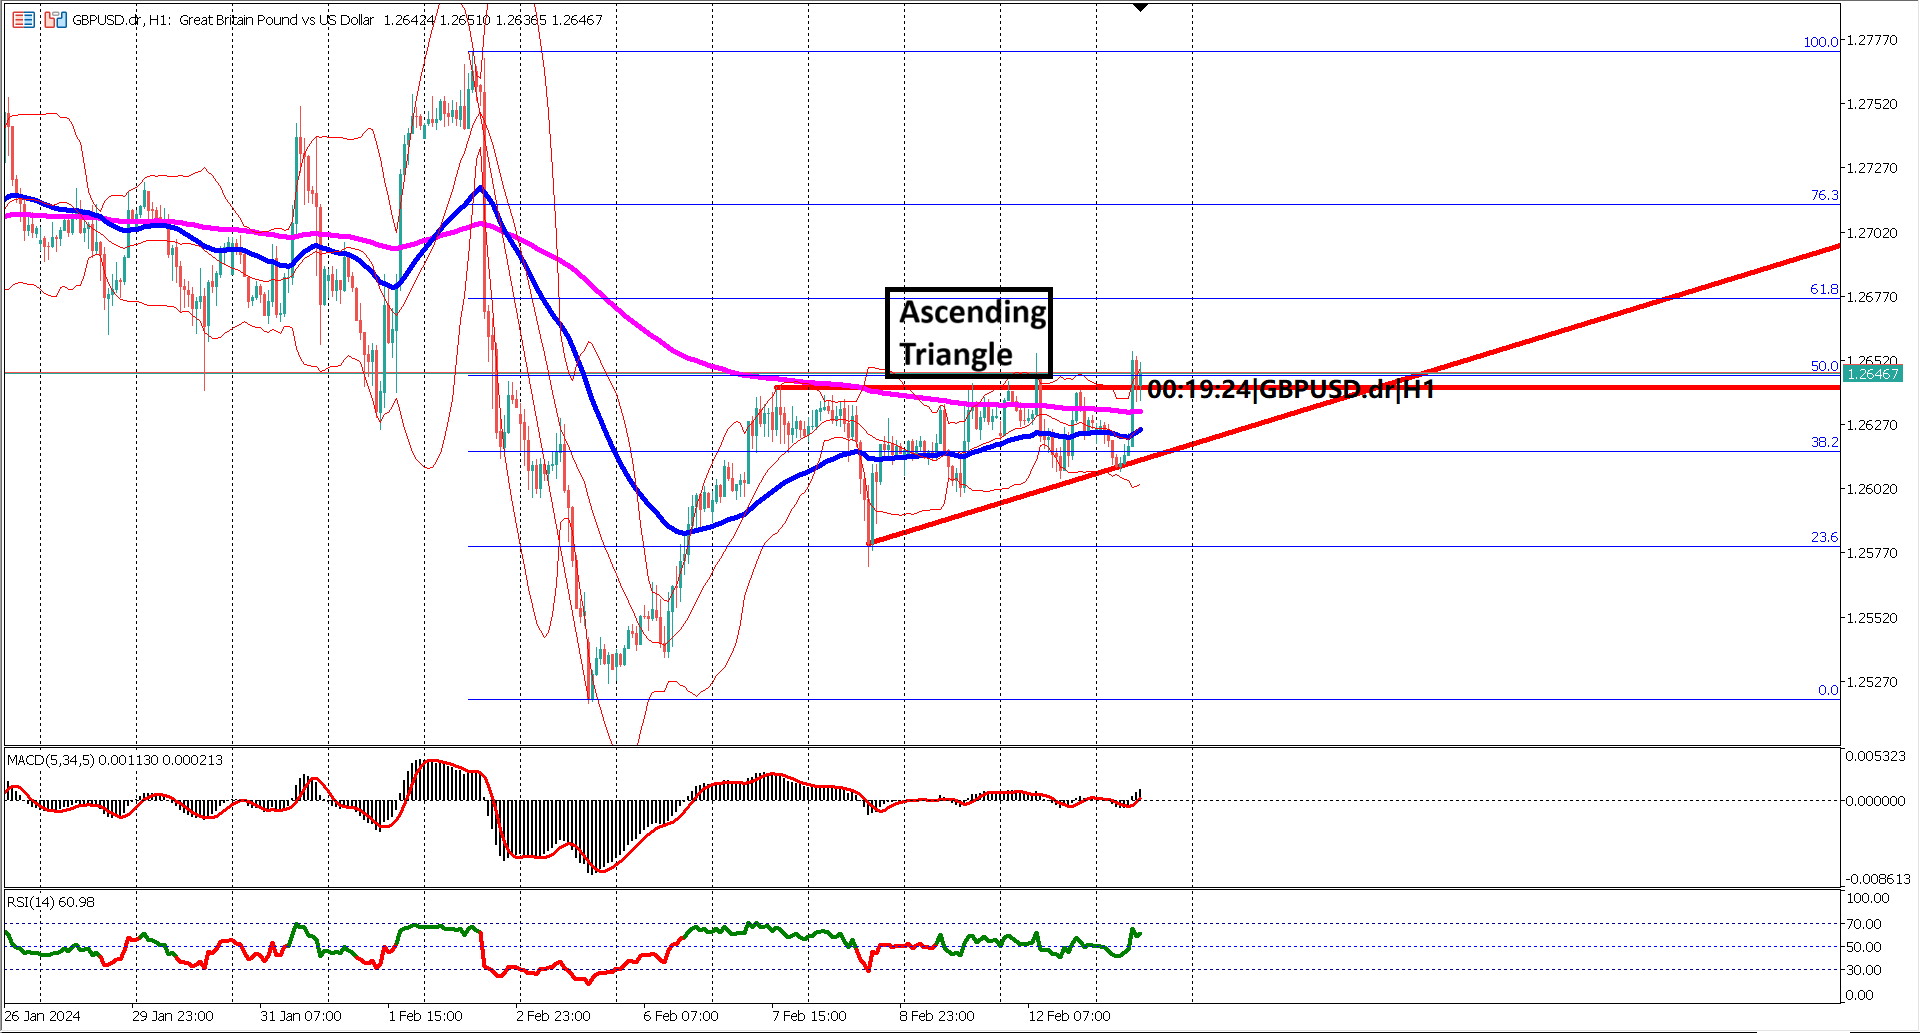
Today, the UK released Core Retail Sales and Retail Sales data, all of which surpassed economists' expectations. This positive economic news could provide key support for the bullish case for GBPUSD. Additionally, prices are coiling and forming a triangle chart pattern, signaling potential volatility ahead.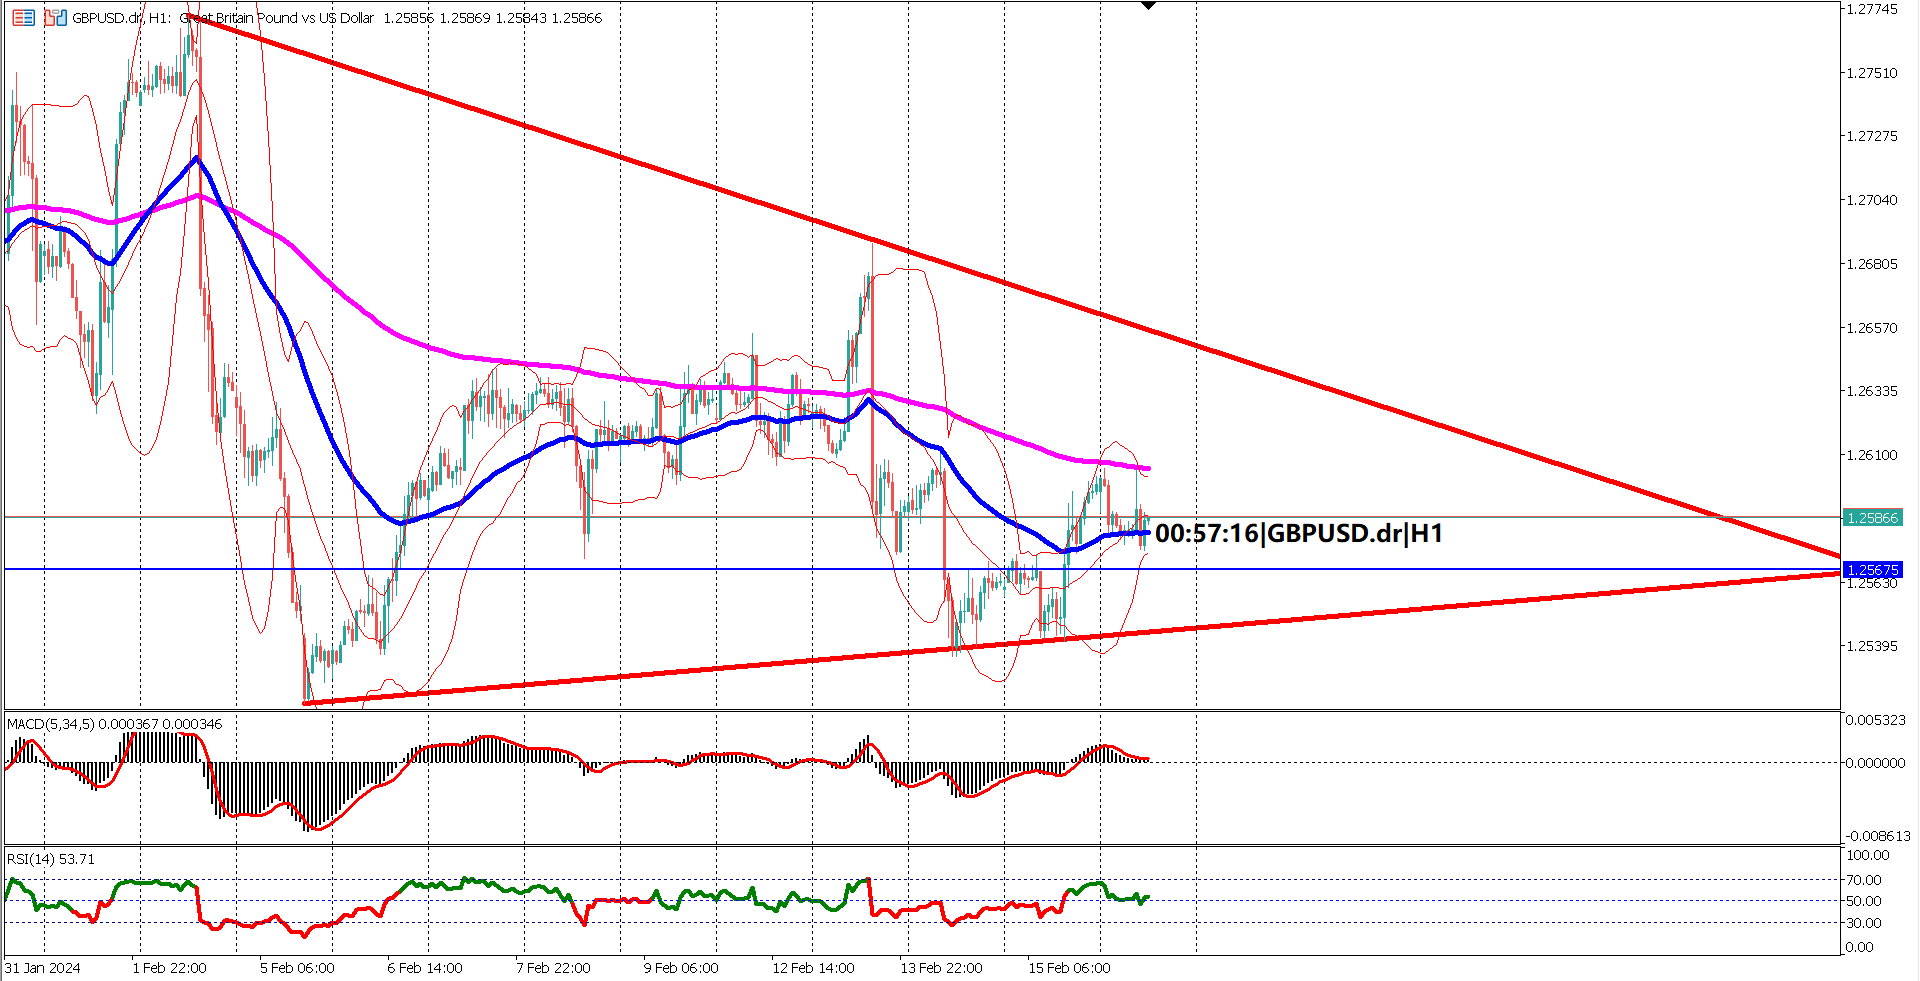
To confirm the bullish case, market participants are watching for the formation of a golden cross on the Exponential Moving Averages (EMA) or a break above the triangle chart pattern. These technical signals could indicate a sustained upward movement in prices.
Meanwhile, the Bollinger Bands are contracting, indicating reduced market volatility. However, volatility could return over the US trading session with the release of PPI and Building Permits data. As long as prices remain above the lower bound of the Bollinger Bands, the bullish case may persist.
Oscillator indicators further support the bullish sentiment, with both the Moving Average Convergence Divergence (MACD) and Relative Strength Index (RSI) signaling bullish conditions. The MACD signal line is above the 0 line, indicating positive momentum, while the RSI has maintained its position above 40% since breaking the 60% level in the last 18 hours.
Overall, prices are likely to test the upper bound of the triangle chart pattern in the near term. Key support levels to watch are at 1.2567 and the lower bound of the triangle chart pattern. A break below these key support levels may signal further weakness for the GBP.
1. Positive UK economic data, including Core Retail Sales and Retail Sales, provide support for the bullish case for GBPUSD.
2. Prices are coiling and forming a triangle chart pattern, suggesting potential volatility ahead.
3. Confirmation of the bullish case requires a golden cross on EMA or a break above the triangle chart pattern.
4. Bollinger Bands contraction indicates reduced volatility, but volatility could return over the US trading session.
5. Oscillator indicators, including MACD and RSI, are bullish, supporting the upward momentum in prices.
Actual 0.7% vs Forecast -1.6% vs Previous -2.1%
Actual 0.7% vs Forecast 1.5% vs Previous -3.3%
Forecast 1.509M vs Previous 1.493M
Forecast 0.1% vs Previous -0.1%

Trading foreign exchange on margin carries a high level of risk, and may not be suitable for all investors. Before deciding to trade foreign exchange you should carefully consider your investment objectives, level of experience, and risk appetite.
Nothing contained in this website should be construed as investment advice. Any reference to an investment's past or potential performance is not, and should not be construed as, a recommendation or as a guarantee of any specific outcome or profit.