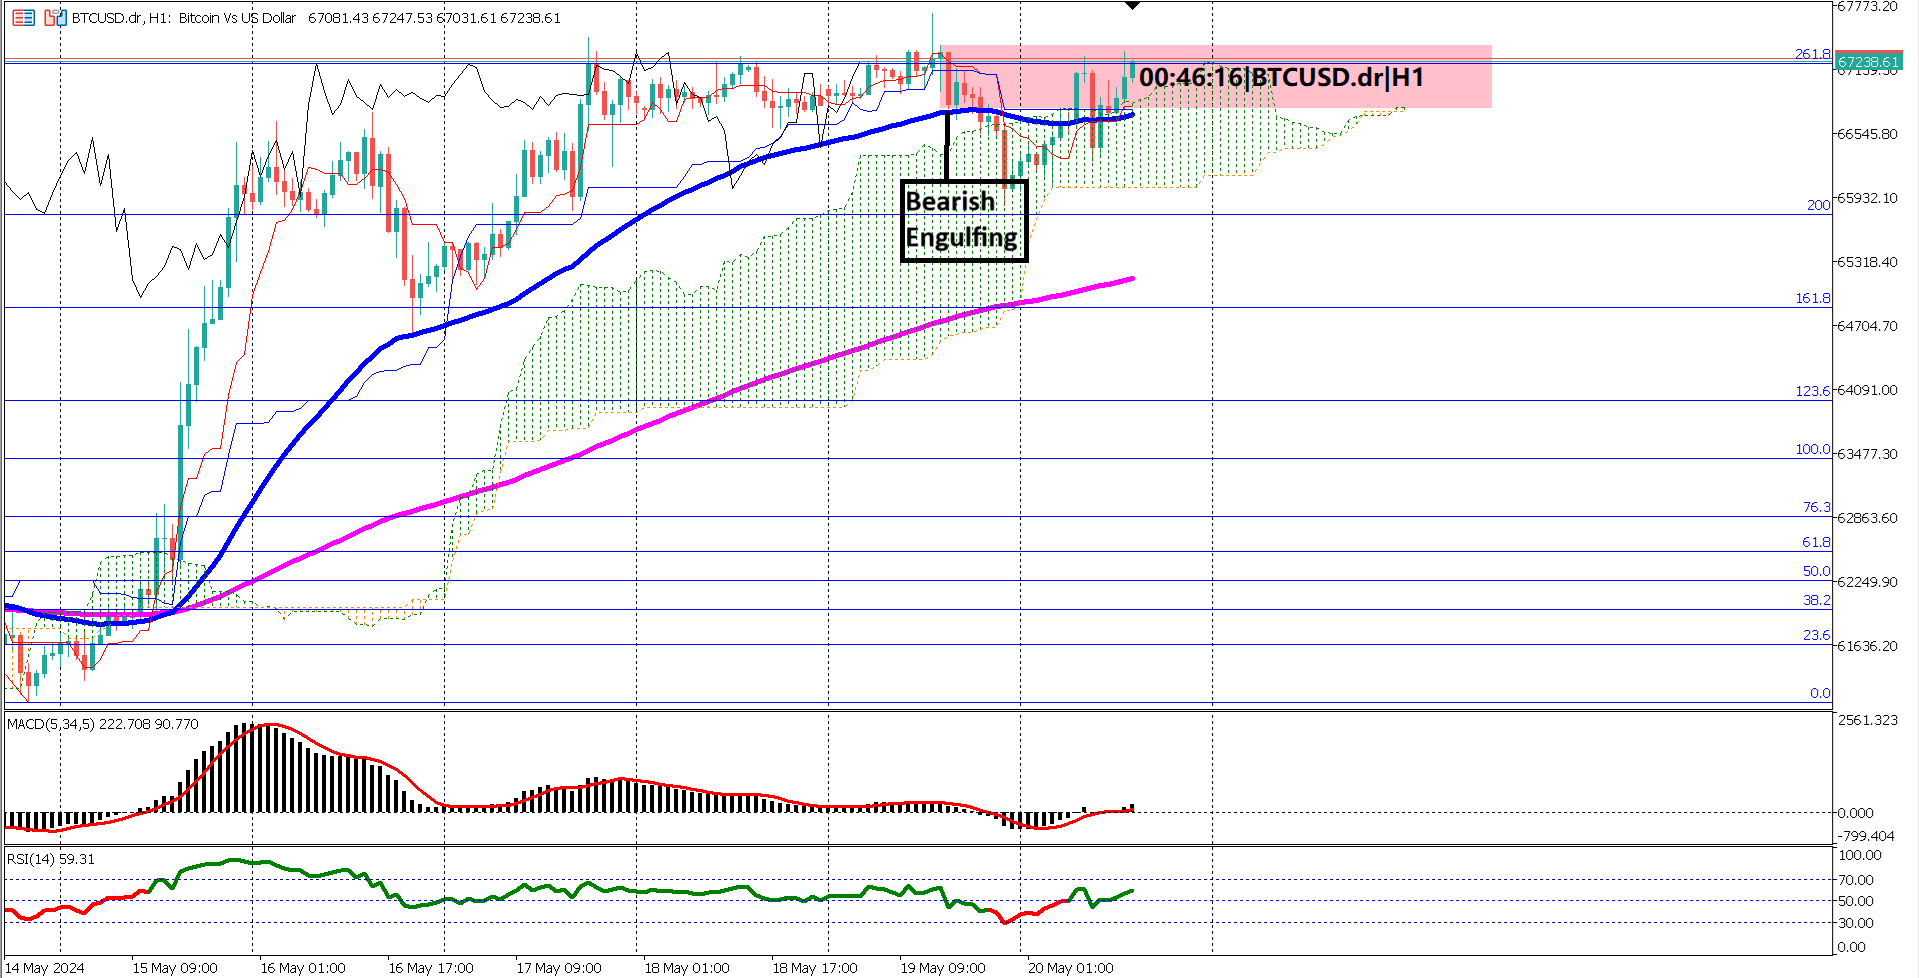
 BTCUSD has been trading sideways for the past eight days, demonstrating a period of consolidation within the cryptocurrency market. On the 1-hour time frame chart, Bitcoin's price has oscillated around the Ichimoku Cloud, repeatedly breaking above and below this technical indicator. Currently, the 50-period Exponential Moving Average (EMA) is approaching the 200-period EMA, suggesting the potential formation of a "death cross." This crossover, if it occurs, would confirm a bearish reversal, indicating that downward momentum might dominate the market in the near future.
In the short to medium term, indicators such as the MACD and RSI have been fluctuating between bearish and bullish zones several times over the past eight trading days. This frequent oscillation underscores the current sideways price action and reflects the market's indecision during this consolidation phase.
Key support is identified at the bottom of a bullish engulfing candlestick, marked by a purple rectangle, at $66,866. A break below this critical level could signal a bearish reversal, indicating potential further declines in Bitcoin's price. On the other hand, key resistance is noted at the high of a bearish engulfing candlestick, highlighted in a blue rectangle. A break above this level would be necessary to confirm a bullish breakout and the continuation of upward momentum.
Overall, BTC/USD is currently in a sideways trading pattern, with market participants closely monitoring these key levels for potential breakout signals. The impending EMA crossover and the fluctuating momentum indicators suggest that the market is at a critical juncture, with future price action likely hinging on whether Bitcoin can break out of its current range. Traders should remain vigilant and watch for breaks of these key levels to confirm the next directional move in BTC/USD.
Forecast 2.4% vs Previous 2.2%
Forecast 0.2% vs Previous 0.5%

Trading foreign exchange on margin carries a high level of risk, and may not be suitable for all investors. Before deciding to trade foreign exchange you should carefully consider your investment objectives, level of experience, and risk appetite.
Nothing contained in this website should be construed as investment advice. Any reference to an investment's past or potential performance is not, and should not be construed as, a recommendation or as a guarantee of any specific outcome or profit.