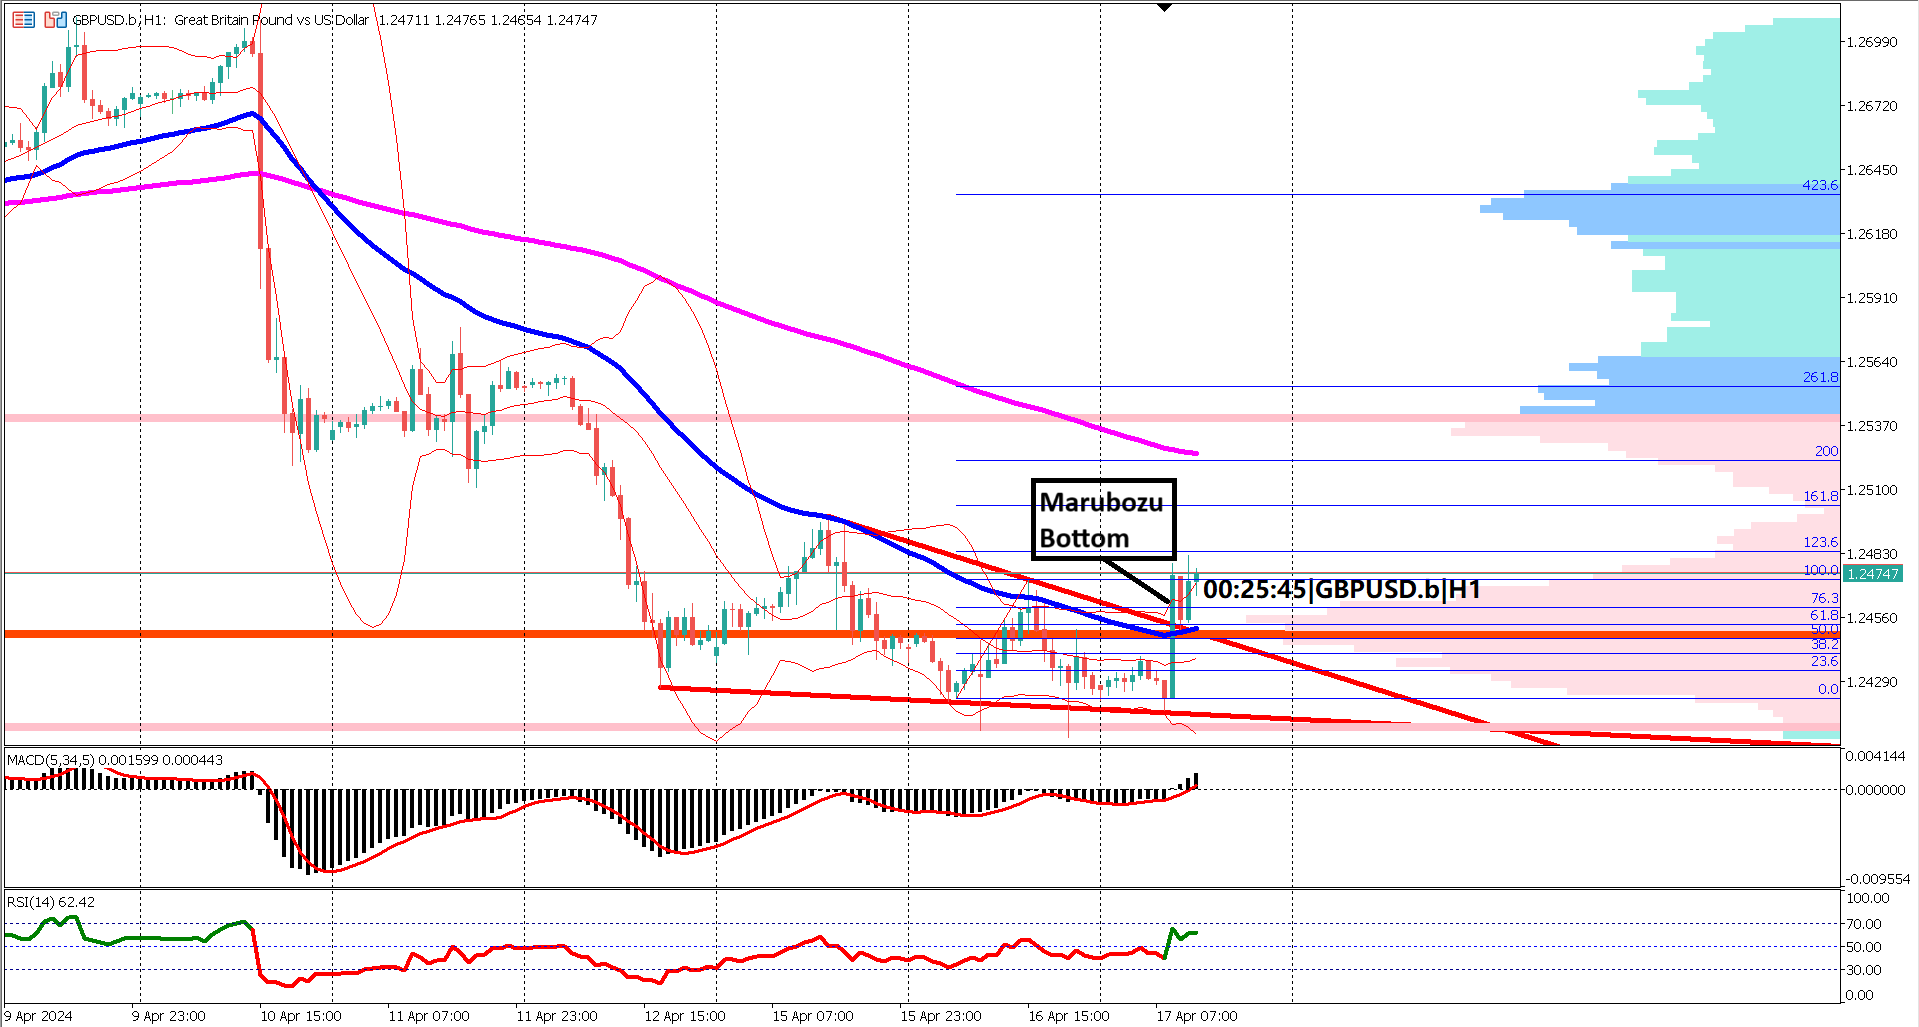
 In recent weeks, GBP/USD has navigated a sideways trajectory, encapsulated within the confines of a falling wedge chart pattern. This pattern is characterized by a series of lower highs and lower lows, creating a contracting price range that often precedes a significant breakout. As traders keenly monitor the unfolding dynamics, several technical aspects warrant attention.
At the foundation of this analysis is the appearance of a notable bullish engulfing candlestick at the bottom of the falling wedge pattern. This substantial candle provides a potential key support level, adding a layer of significance to the overall chart pattern. A breach below this key support level may signal a bearish reversal, altering the prevailing market sentiment.
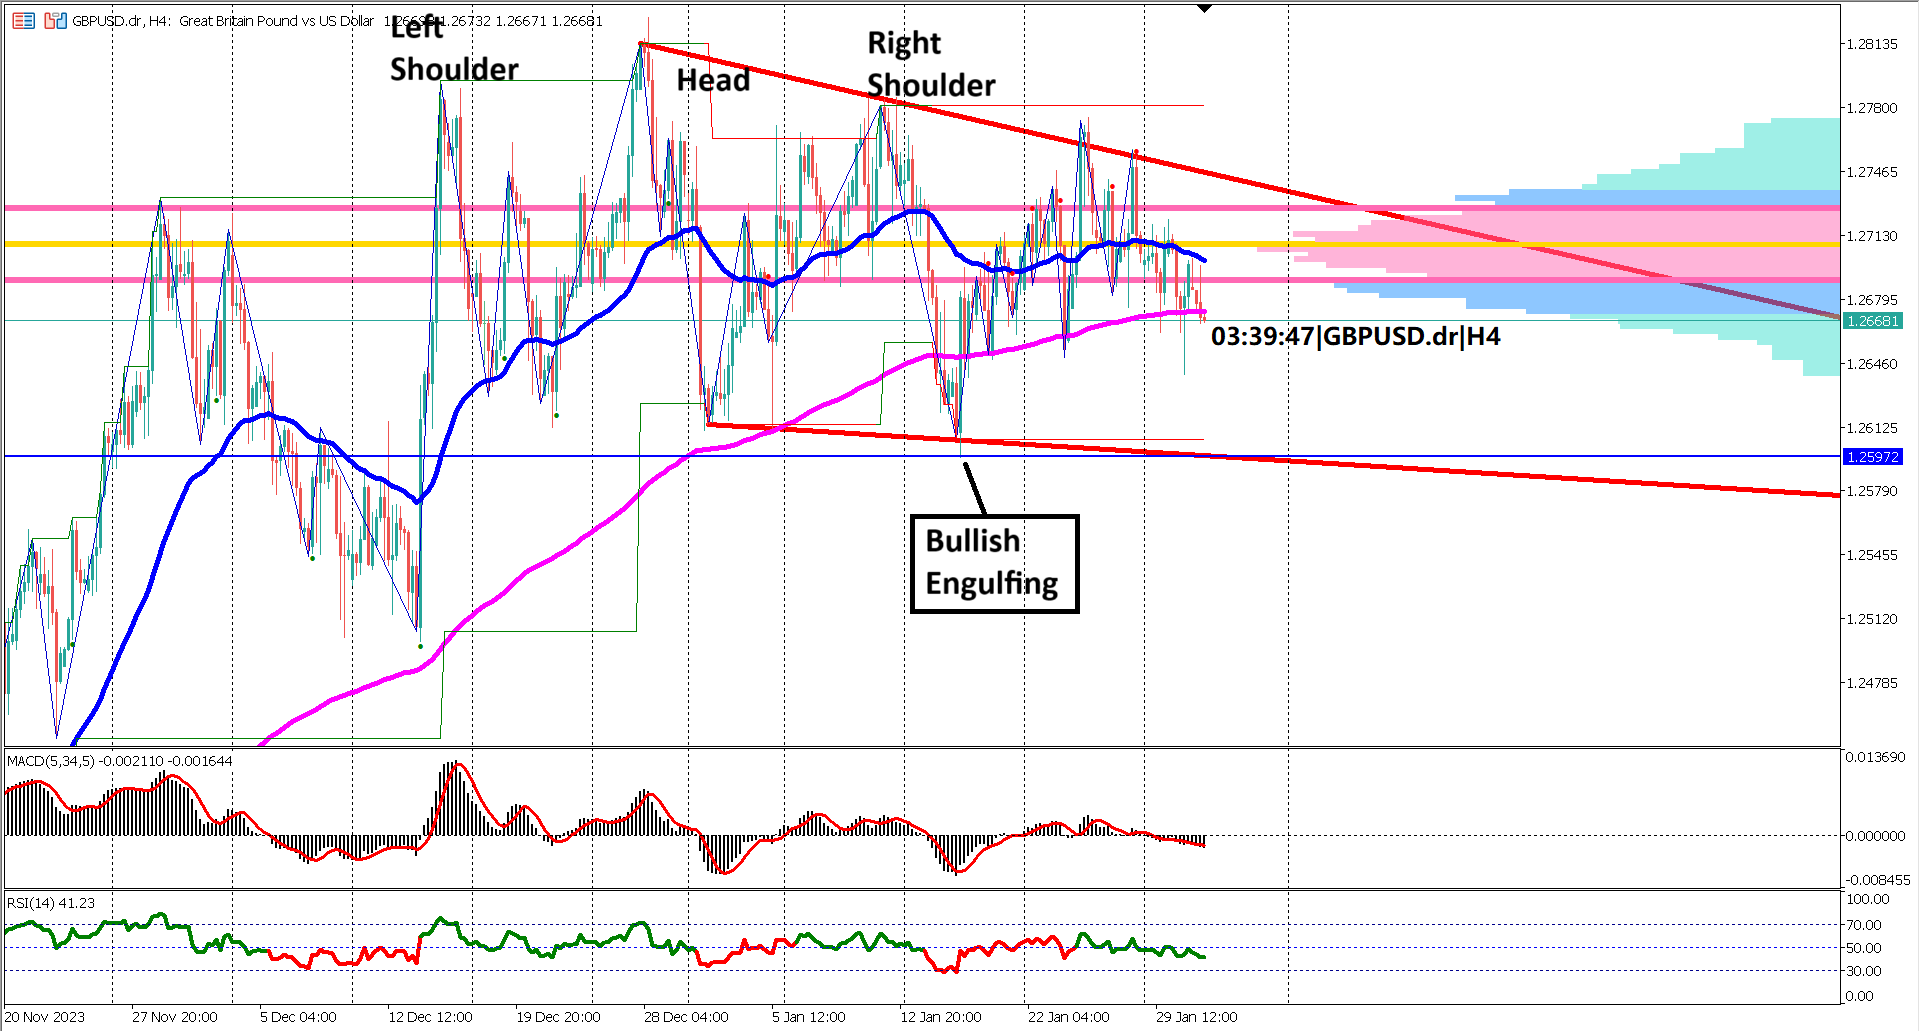
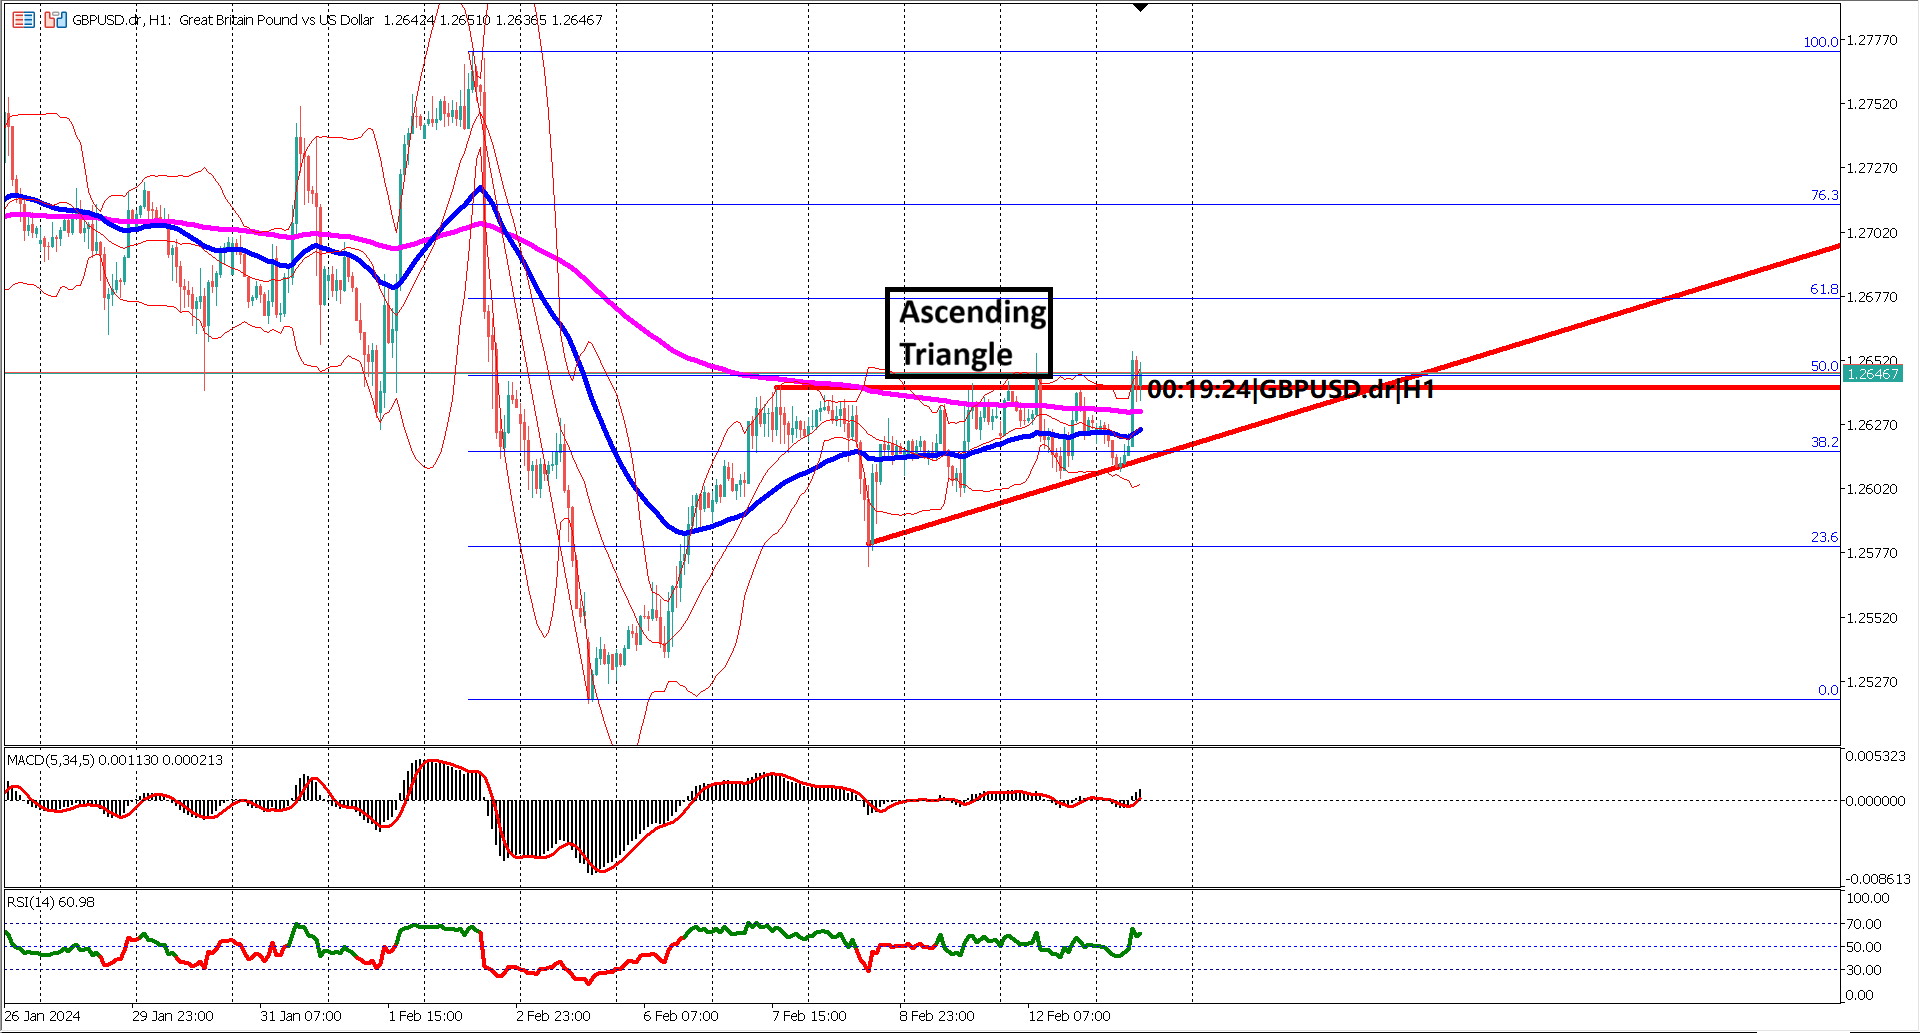
A distinctive chart pattern that emerges within this context is the formation of a head and shoulders pattern. This classic bearish reversal pattern is recognized by three peaks: a higher peak (head) between two lower peaks (shoulders). Interestingly, the neckline of this head and shoulders pattern coincides with the lower boundary of the falling wedge. A decisive break below this neckline would confirm the bearish outlook, potentially setting the stage for a sustained downward trend. However, traders should remain vigilant for a scenario in which prices breach above the right shoulder, nullifying the bearish implications.
Turning our attention to the Exponential Moving Averages (EMA), the convergence of the EMA 50 and EMA 200 introduces a layer of complexity. This convergence signals a potential slowdown in bearish momentum, potentially hinting at a reversal. However, a critical development to watch for is the formation of a death cross, where the EMA 50 crosses below the EMA 200. This eventuality would strengthen the bearish case, serving as an additional confirmation of downward pressure.
In the realm of oscillators, the mixed signals witnessed recently align with the sideways movement of prices. As GBP/USD meanders within the falling wedge pattern, oscillators often struggle to provide a definitive directional bias. Traders should exercise caution and consider multiple indicators to gain a comprehensive understanding of the market context.
In summation, GBP/USD's current trajectory is primarily sideways, encapsulated within the falling wedge pattern. The potential establishment of a key support level and the emergence of the head and shoulders pattern introduce both bullish and bearish considerations. Traders should await confirmation through decisive breaks, with a breach above the shoulders and falling wedge signaling a bullish trend continuation, while a breach below the key support level and neckline could indicate a bearish reversal.
Forecast 0.2% vs Previous 0.1%
Forecast 145K vs Previous 164K
Forecast 48.0 vs Previous 46.9

Trading foreign exchange on margin carries a high level of risk, and may not be suitable for all investors. Before deciding to trade foreign exchange you should carefully consider your investment objectives, level of experience, and risk appetite.
Nothing contained in this website should be construed as investment advice. Any reference to an investment's past or potential performance is not, and should not be construed as, a recommendation or as a guarantee of any specific outcome or profit.