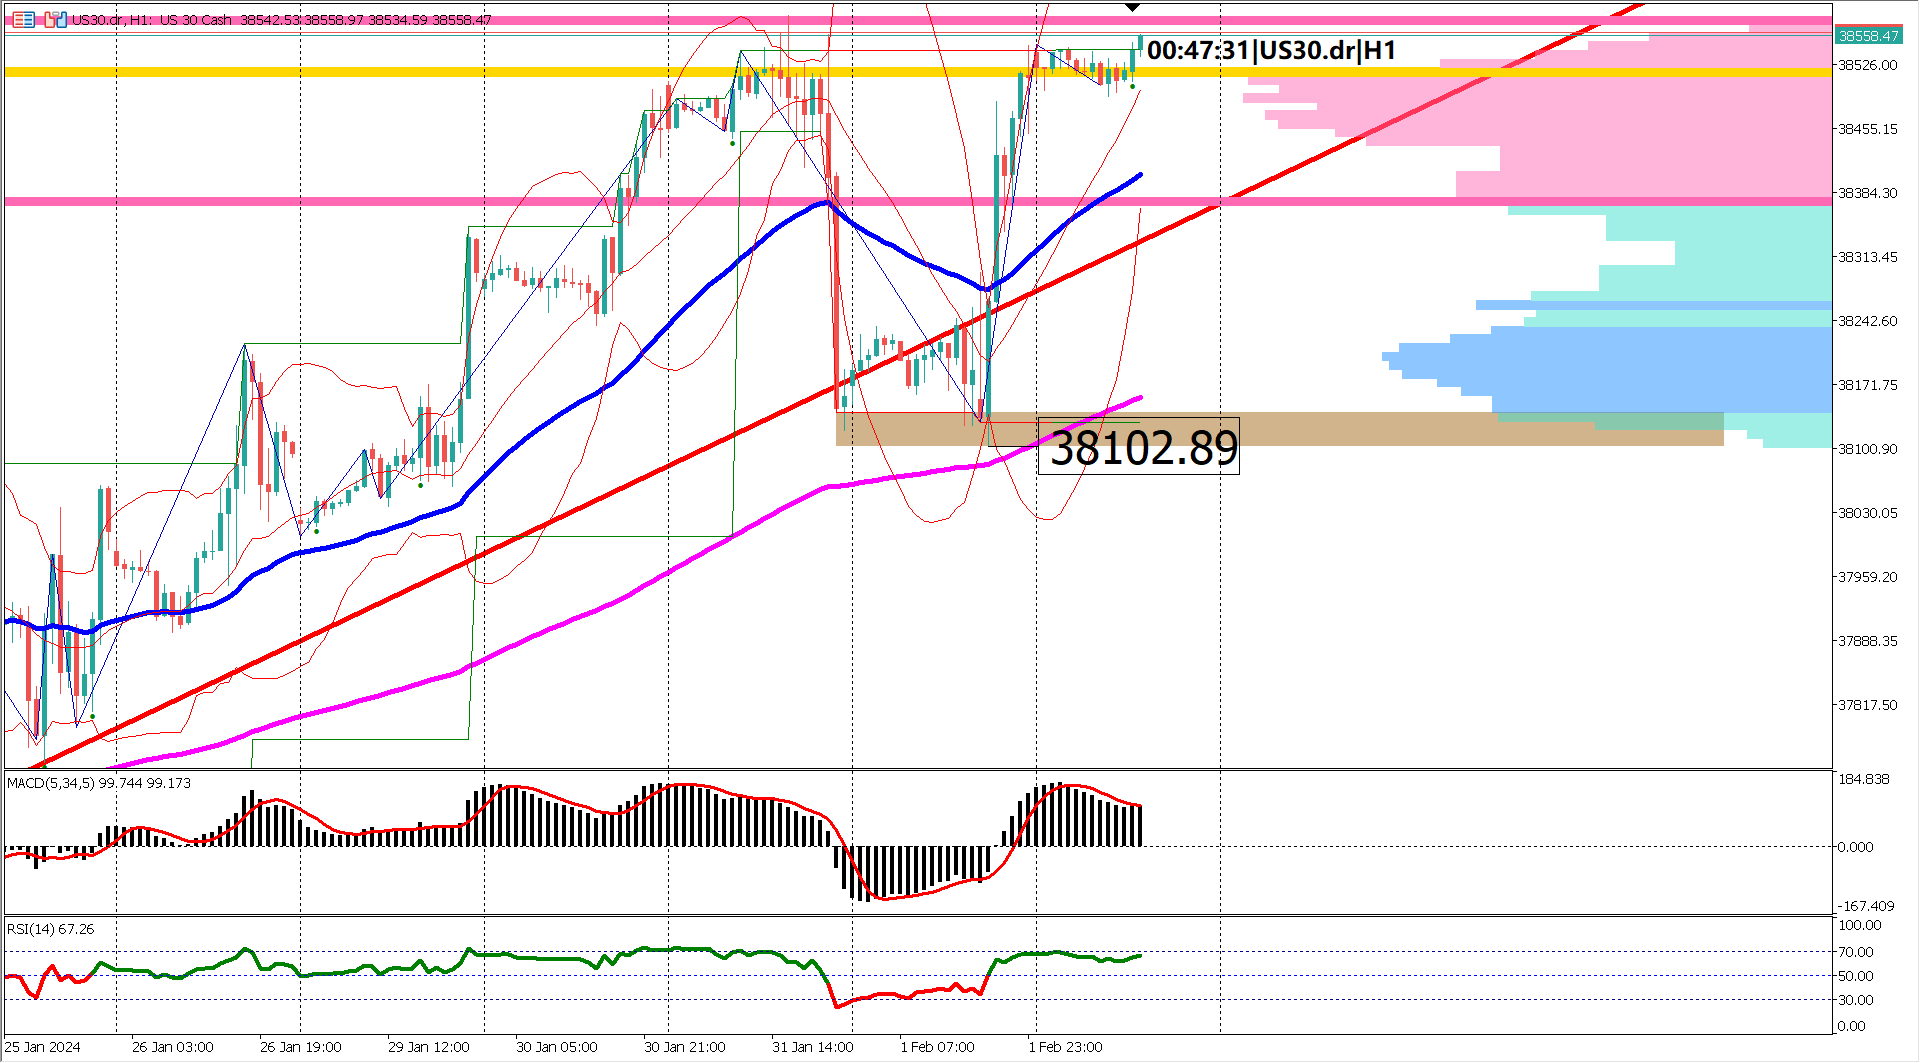

In the last five to six trading days, the US30 index embarked on a bullish trend spanning three trading days, starting from February 13th to February 16th. However, this bullish momentum encountered resistance as the market developed a double top pattern somewhere between February 14th and 16th.
The base of the double top formation serves as a point of interest, now acting as key level resistance after previously functioning as support for a brief period. Following the formation of the double top, the market began to establish a descending trend channel, correcting nearly 50% of the recent bullish rally.
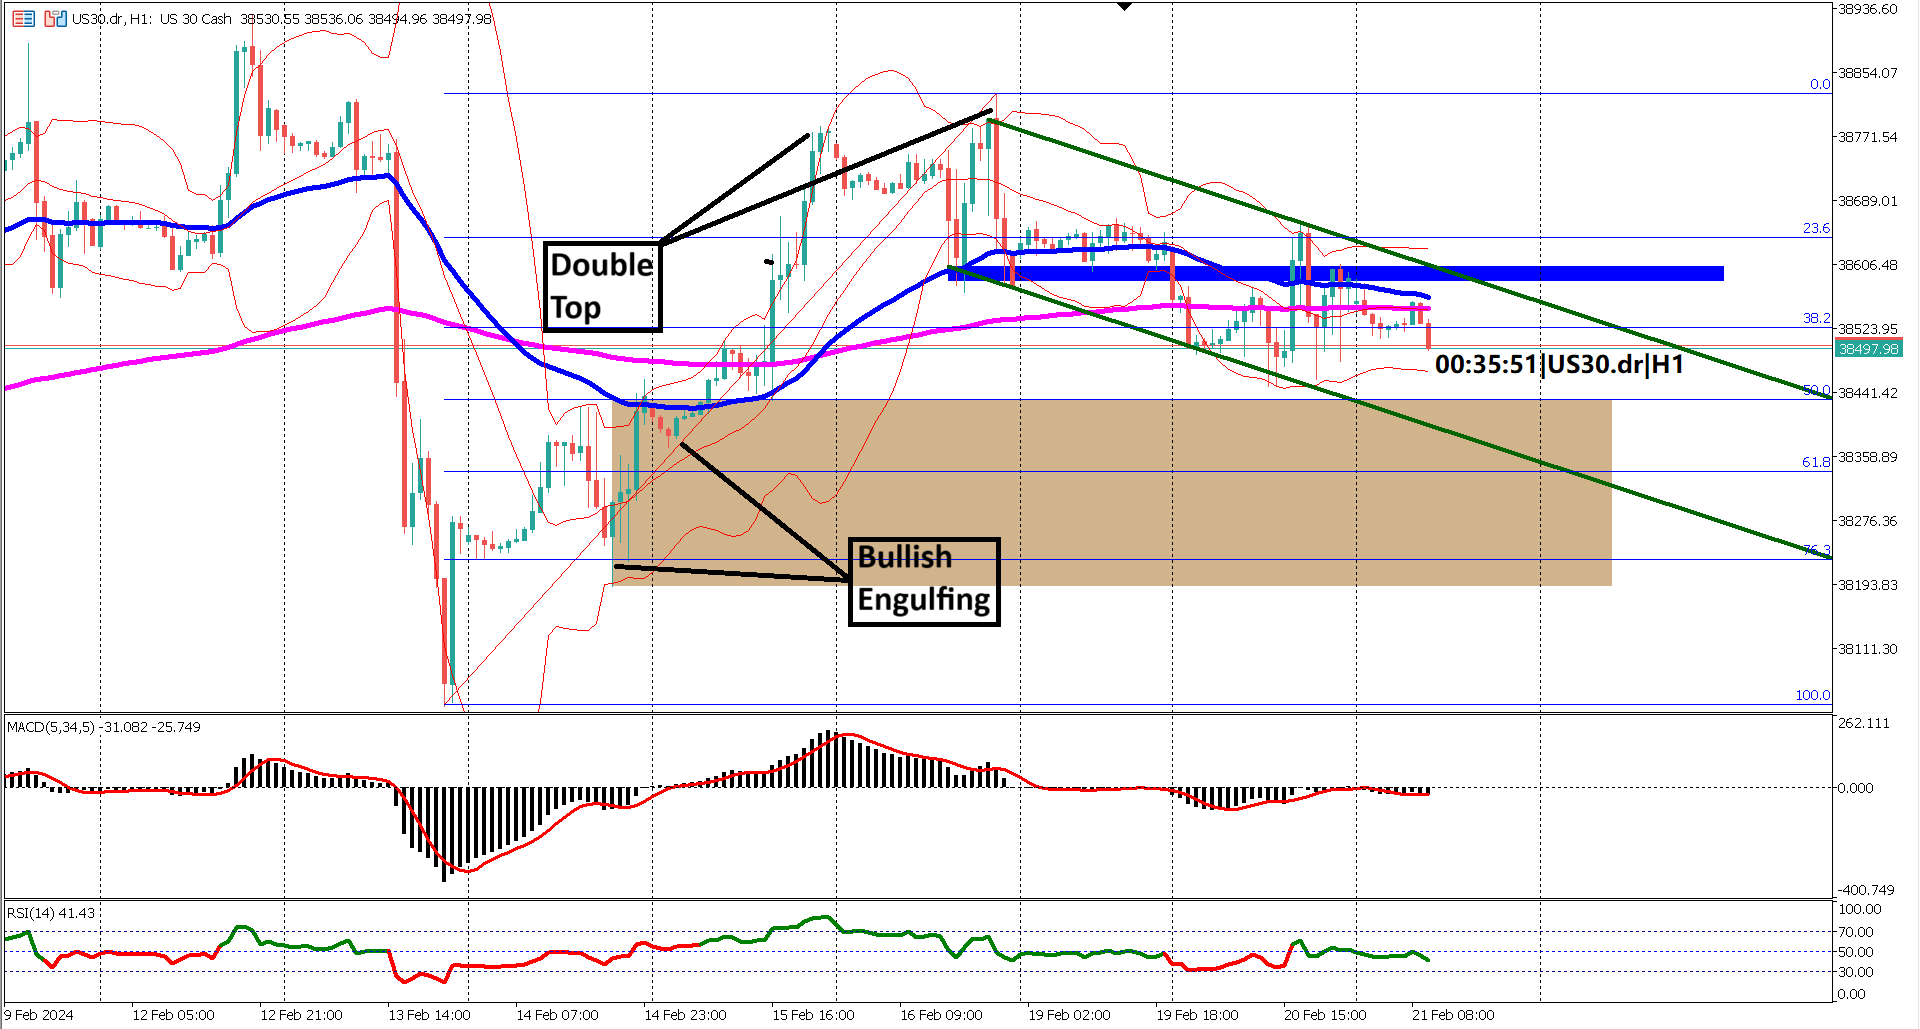
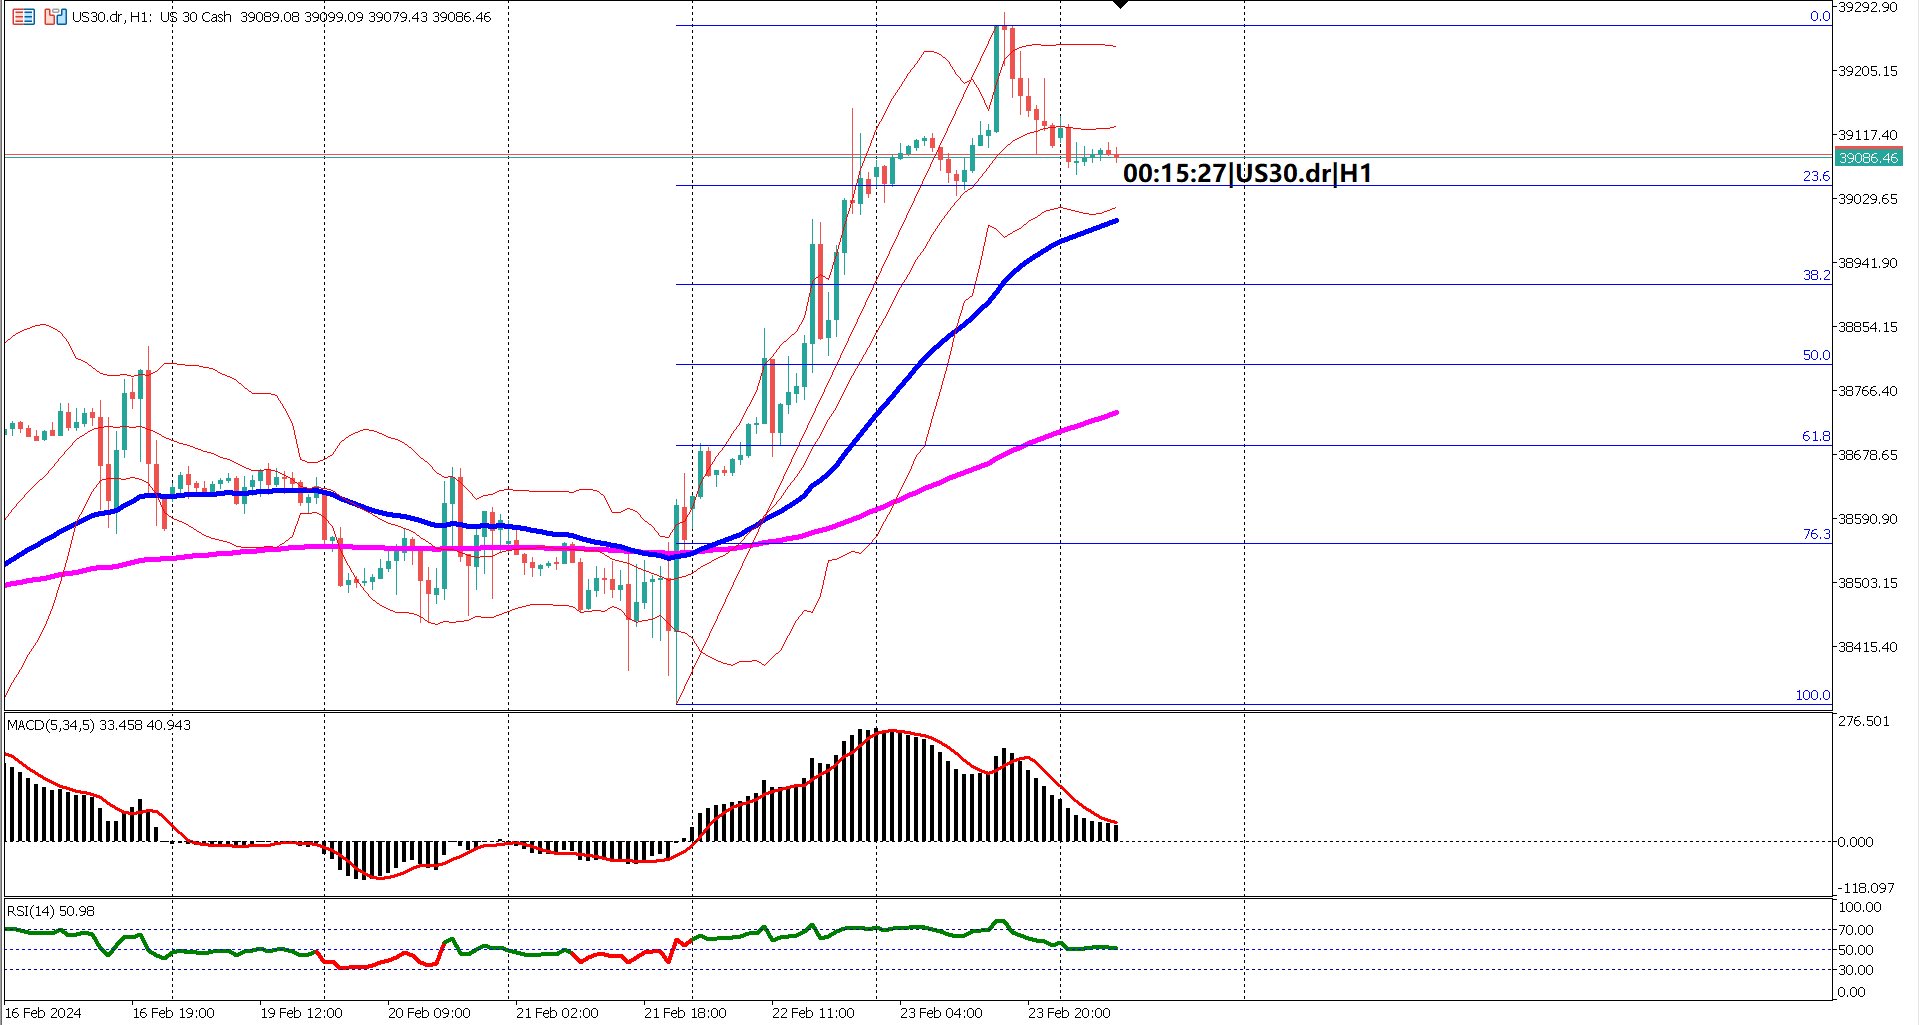
Key resistance levels to monitor are the 50% and 61.8% Fibonacci retracement levels. There's a likelihood of prices retracing deeper to the 61.8% level, where two bullish engulfing candlestick patterns previously formed, potentially offering support.
The scenario for further price movement hinges on two critical levels: a breakout above the descending trend channel and key resistance at $38,600 may lead to a test of recent swing highs and higher price movement. Conversely, a break below the lowest point of the bullish engulfing candlestick at $38,190 could indicate a move below the recent swing low at $38,039 in the coming days.
Analysis of EMAs, Bollinger Bands, MACD, and RSI suggests caution, as the market has been choppy and trendless despite multiple crossings of EMAs 50 and 200. In such conditions, relying solely on technical indicators may not provide reliable information for trading decisions.
In summary, traders should remain vigilant and focus on key support and resistance levels as significant points of interest amidst the choppy market environment.
1. US30 experienced a bullish trend lasting three days from February 13th to 16th.
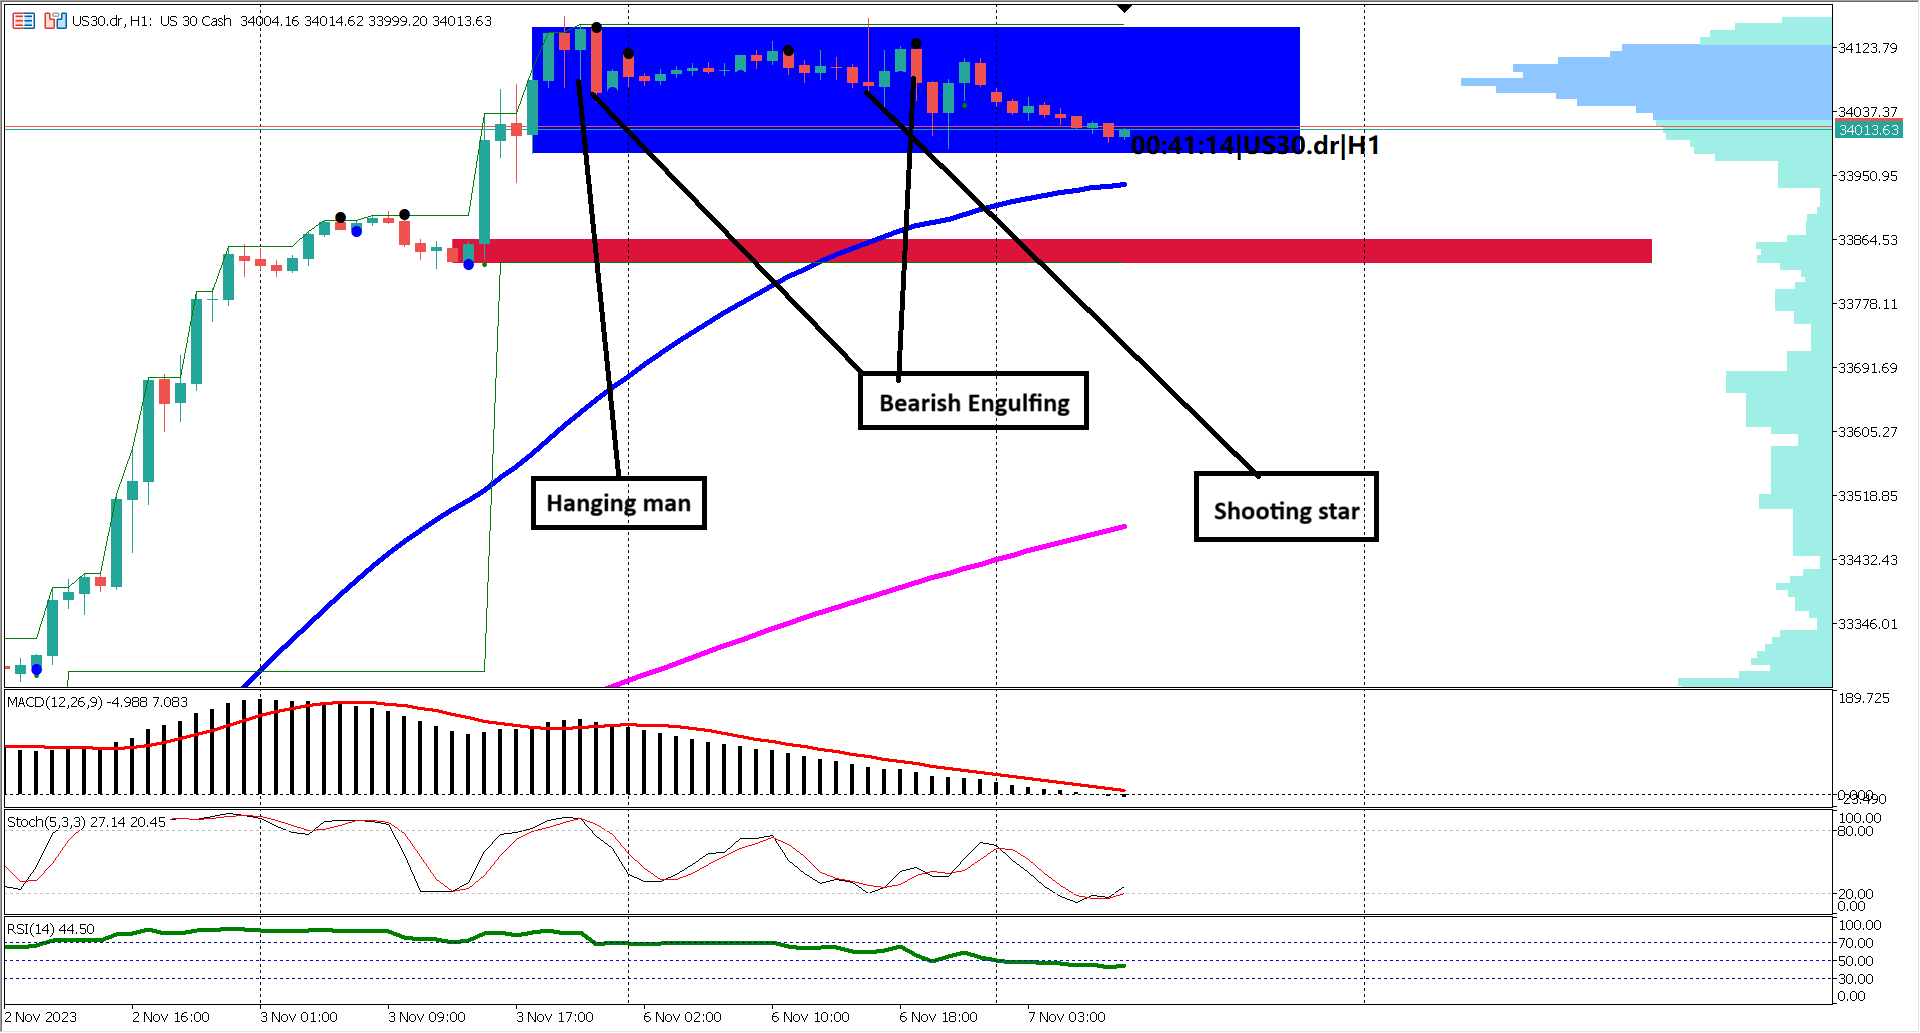
2. Development of a double top pattern marked a reversal in bullish momentum.
3. Key level resistance identified at the base of the double top formation.
4. Descending trend channel formed post-double top, correcting 50% of recent rally.
5. Critical resistance levels at 50% and 61.8% Fibonacci retracement levels.
6. Breakout above $38,600 could signal further upside, while a break below $38,190 may lead to lower prices.
7. Choppy market conditions make reliance on technical indicators less reliable for trading decisions.
Forecast 0.1% vs Previous 0.0%

Trading foreign exchange on margin carries a high level of risk, and may not be suitable for all investors. Before deciding to trade foreign exchange you should carefully consider your investment objectives, level of experience, and risk appetite.
Nothing contained in this website should be construed as investment advice. Any reference to an investment's past or potential performance is not, and should not be construed as, a recommendation or as a guarantee of any specific outcome or profit.