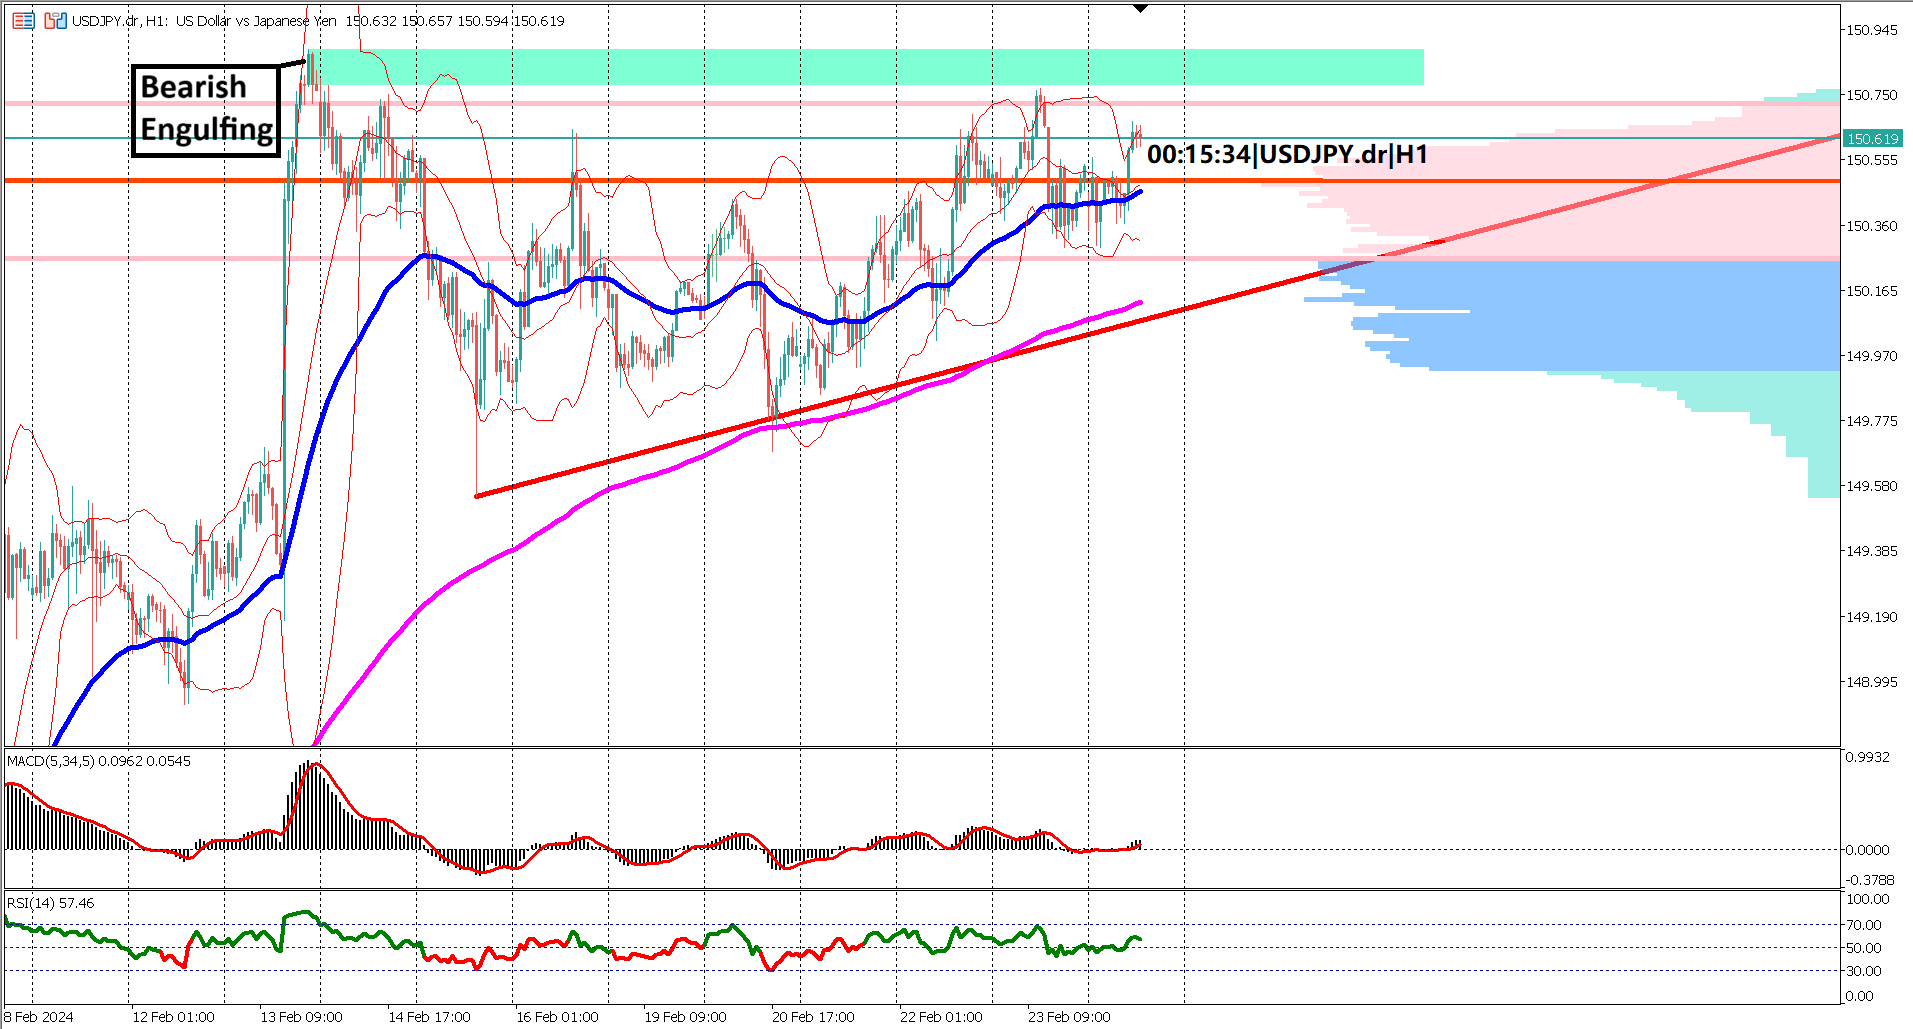

USD/JPY has reached the significant milestone of 150 Yen and is currently exhibiting a coiling pattern, forming a symmetrical triangle chart pattern over the last five trading days. This consolidation phase often precedes a significant market move, making it crucial for traders to monitor closely.
A break above the symmetrical triangle pattern could signal a continuation of the bullish trend, potentially leading to further upside momentum in USD/JPY. Conversely, a break below the triangle pattern may indicate a bearish reversal, suggesting a shift in market sentiment towards the Japanese Yen.
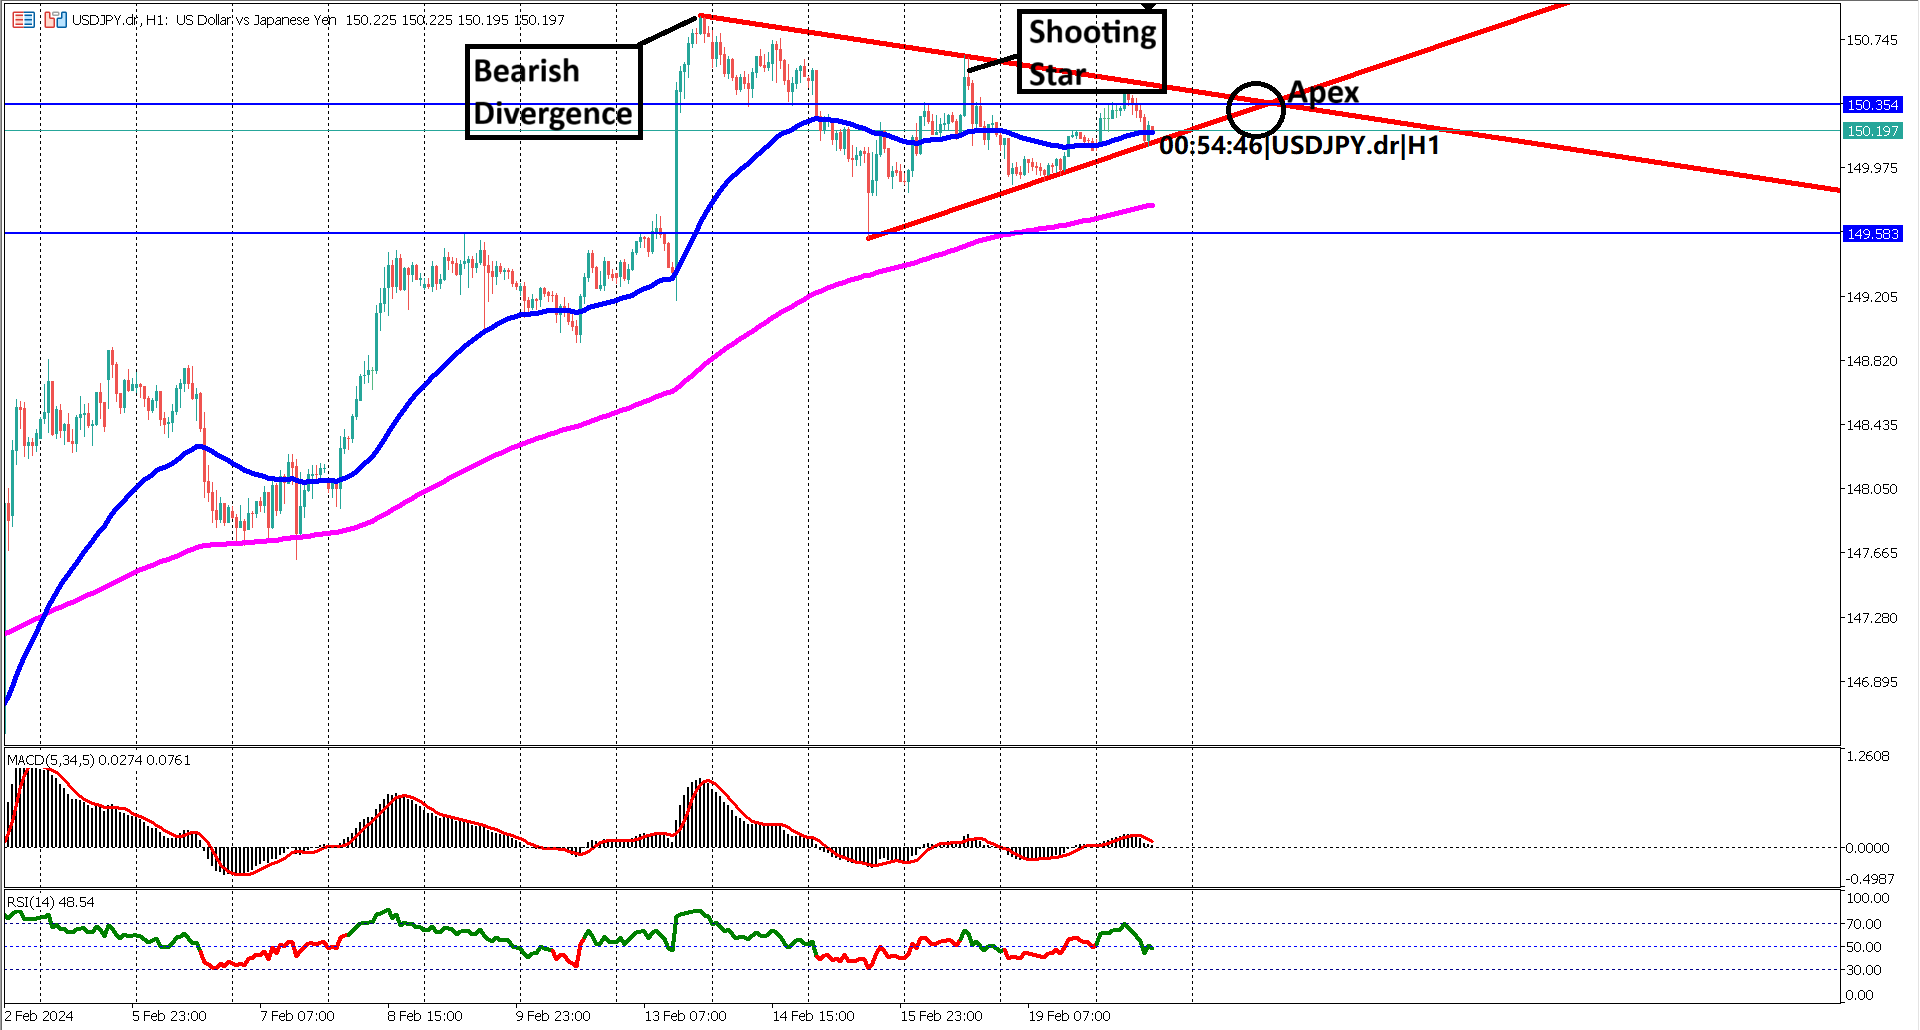
Despite the narrowing distance between the EMA 200 and EMA 50, bullish momentum remains strong in USD/JPY. The recent spike of 170 pips on February 13, 2024, has accelerated the convergence of EMA 200 with the market, reinforcing the bullish outlook.
Key support is identified at the EMA 200, serving as a crucial level to watch amidst the current market conditions. On the other hand, key resistance lies at the intersection (apex) of the triangle chart pattern at 150.34 Yen, which could potentially act as a significant barrier to further upside movement.
Additionally, the appearance of two bearish reversal candlestick patterns, along with bearish divergence and a shooting star, adds further complexity to the analysis. Confirmation of a bearish reversal would require prices to break below the key support level or for a death cross to occur on the EMA 50 and EMA 200.
Given the current coiling or choppy market conditions, it is advisable to exercise caution and refrain from relying heavily on oscillator indicators. Instead, traders should remain vigilant for potential breakout opportunities while being mindful of the possibility of fakeouts.
In conclusion, USD/JPY is in a coiling phase, indicating an impending breakout. Traders should be prepared for potential market shifts and carefully assess breakout opportunities while remaining cautious of false signals.
Forecast 0.4% vs Previous -0.3%

Trading foreign exchange on margin carries a high level of risk, and may not be suitable for all investors. Before deciding to trade foreign exchange you should carefully consider your investment objectives, level of experience, and risk appetite.
Nothing contained in this website should be construed as investment advice. Any reference to an investment's past or potential performance is not, and should not be construed as, a recommendation or as a guarantee of any specific outcome or profit.