 The US30 or Dow Jones Industrial Average (DJIA) has exhibited sideways movement this week, following a five-day bull rally. This temporary pause in its upward trajectory is likely influenced by softening economic data from the United States. Additionally, China, the world's second-largest economy, has made headlines with its trade balance figures, which deviated significantly from forecasts.
China's trade balance for the month delivered unexpected results, reporting a trade surplus of $56.53 billion, a significant decline from the expected surplus of $82 billion and the previous surplus of $77.71 billion. Key takeaways from this report include a 3.1% year-on-year (YoY) decrease in exports, compared to the -0.6% seen in September, and a 6.4% YoY increase in imports, marking a stark contrast to the -0.8% decline in the prior period. In essence, China's trade balance has unexpectedly narrowed, owing to the surge in imports. While this may be viewed as a potential concern, it could yield a silver lining for the performance of the Dow index, especially if some of the increased imports originate from the United States.
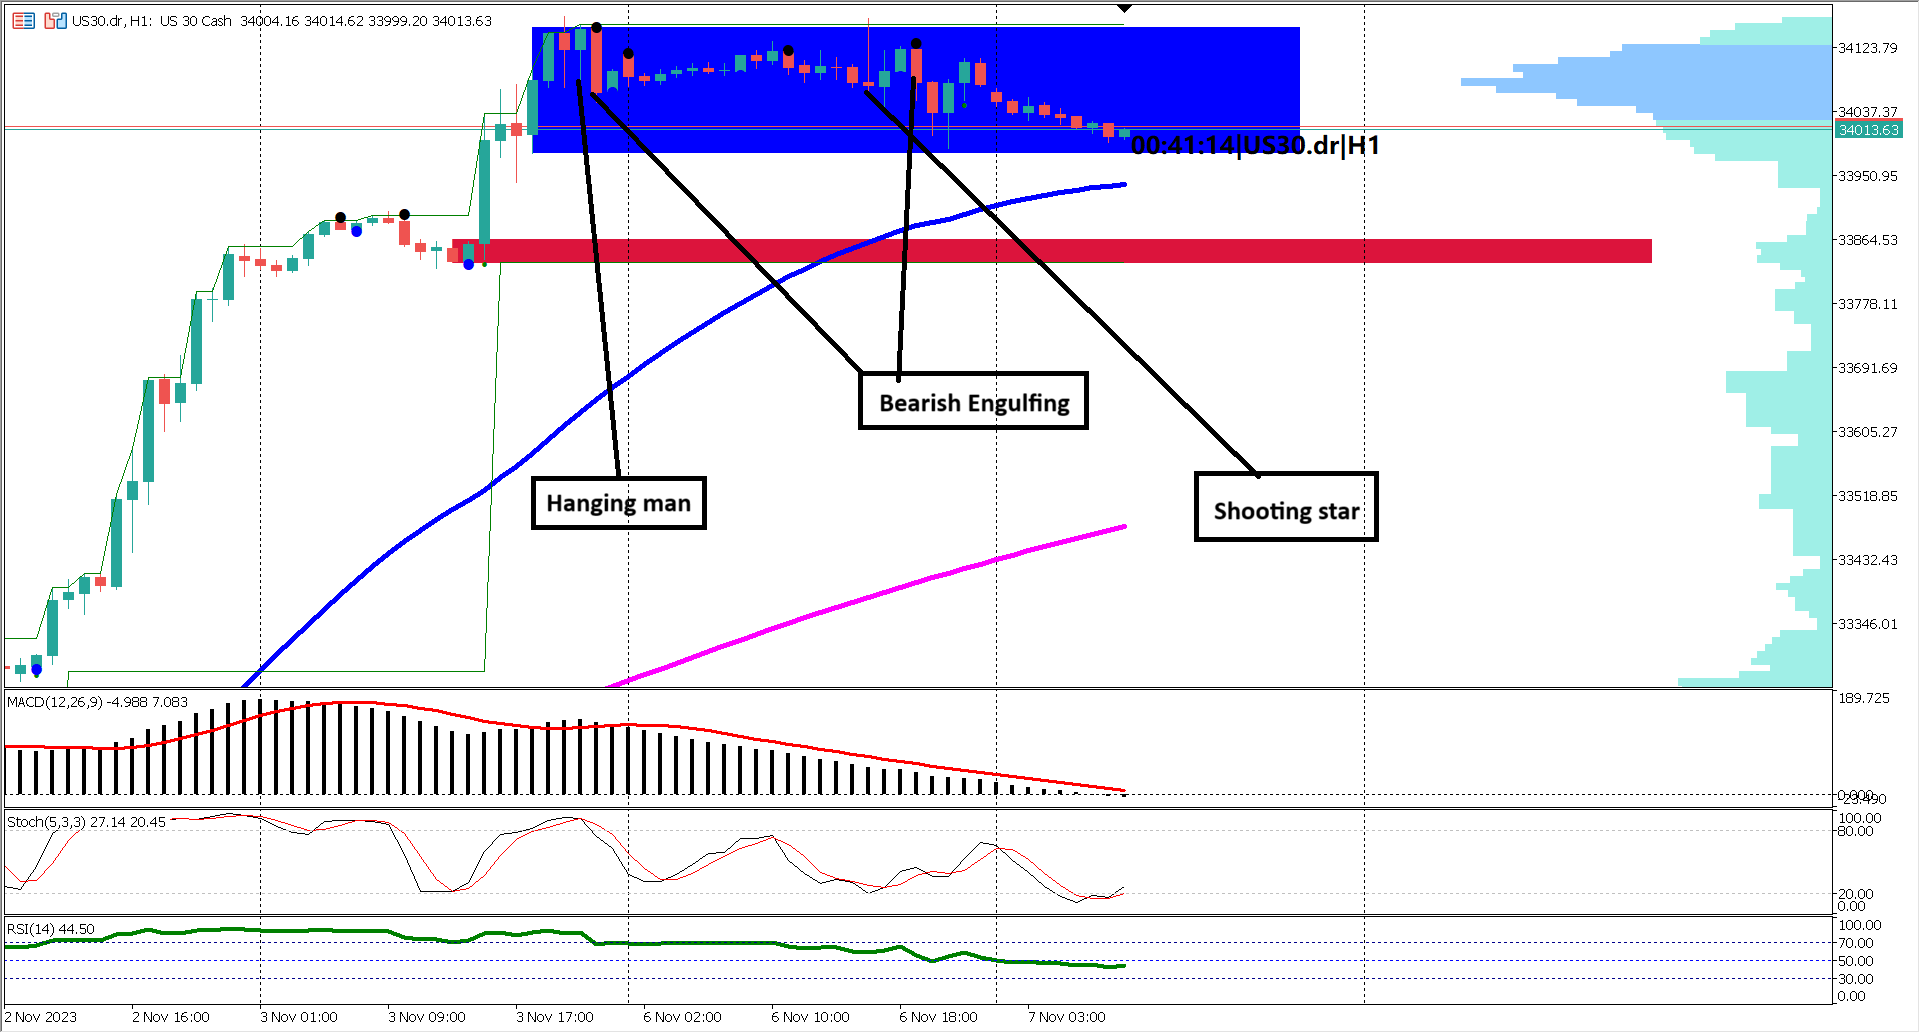
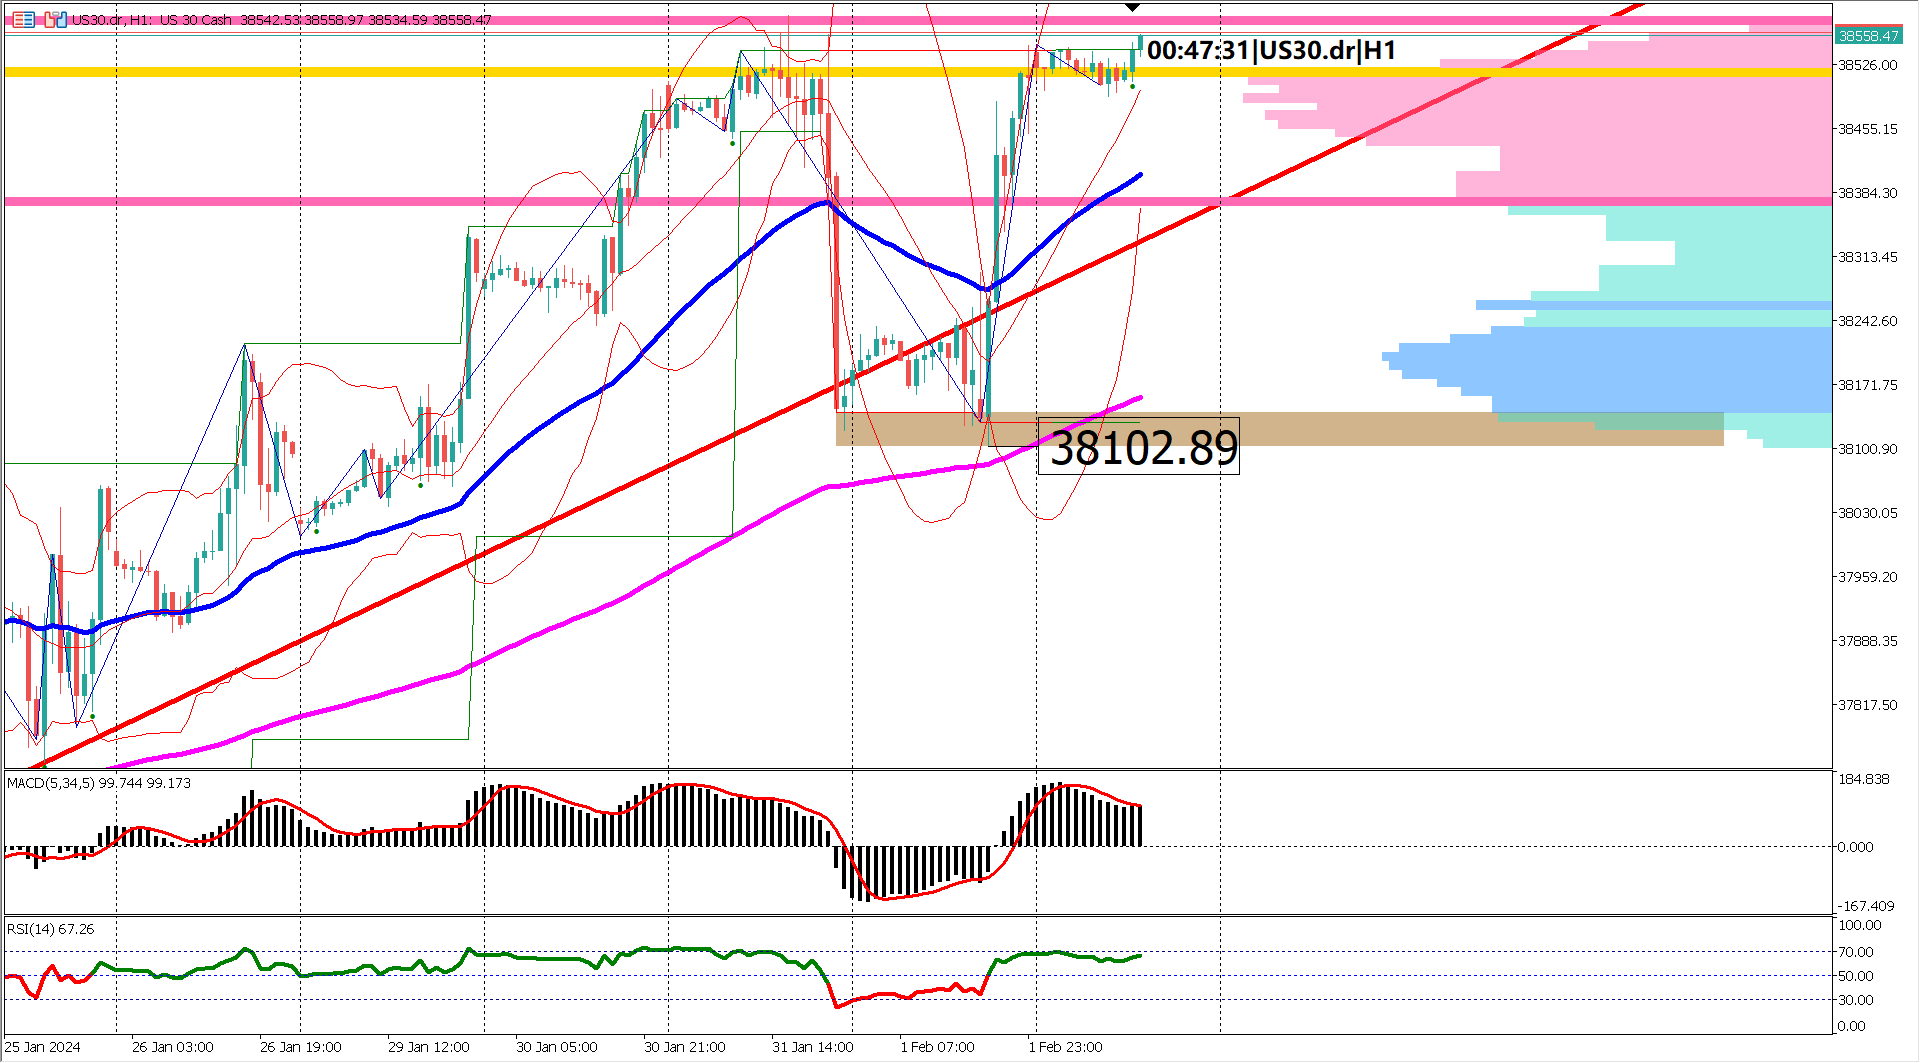
When examining the US30 price action on an hourly timeframe chart, the market has been trading sideways for over 24 hours. During this period, several candlestick reversal patterns have emerged, including Hanging Man, Bearish Engulfing, and Shooting Star formations. For these reversals to be confirmed, a break below the key support level at 33,864.01 (highlighted in red) would be essential.
The EMA 50 (Exponential Moving Average with a 50-period setting) appears to be converging with the bull rally, and it is likely that the price will approach and interact with the EMA 50 in the near future. Furthermore, combining the EMA 50 and EMA 200 suggests a bullish trend since the EMA 50 currently resides above the EMA 200.
The Relative Strength Index (RSI), which utilizes a 14-period setting, remains in bullish territory as the price has not dipped below the 40 level. For a bearish signal to emerge, a drop below the 40 level would be required. Conversely, to re-establish a bullish sentiment, the RSI should break above the 60 level. Typically, this transition takes several candlesticks to fully manifest. Given the RSI's sustained bullish trend in recent days, the likelihood of it entering bearish territory (below the 40 level) is relatively low.
Finally, the Moving Average Convergence Divergence (MACD) indicator indicates the onset of a bearish trend, as the histogram has dipped below the 0 level. To validate the bearish outlook, it is prudent to wait for the signal line to also cross below the 0 level.
In summary, the technical indicators provide mixed signals at present. While the MACD and various reversal candlestick patterns hint at a potential bearish trend, it is advisable not to interpret these signals as definitive until the slower-moving indicators, namely the EMA 50 and EMA 200, undergo a death cross.
CHF, Unemployment Rate
Actual 2% vs forecast 2.1%
USD, Balance of trade
Forecast $-59.9B vs Previous $-58.3B

Trading foreign exchange on margin carries a high level of risk, and may not be suitable for all investors. Before deciding to trade foreign exchange you should carefully consider your investment objectives, level of experience, and risk appetite.
Nothing contained in this website should be construed as investment advice. Any reference to an investment's past or potential performance is not, and should not be construed as, a recommendation or as a guarantee of any specific outcome or profit.