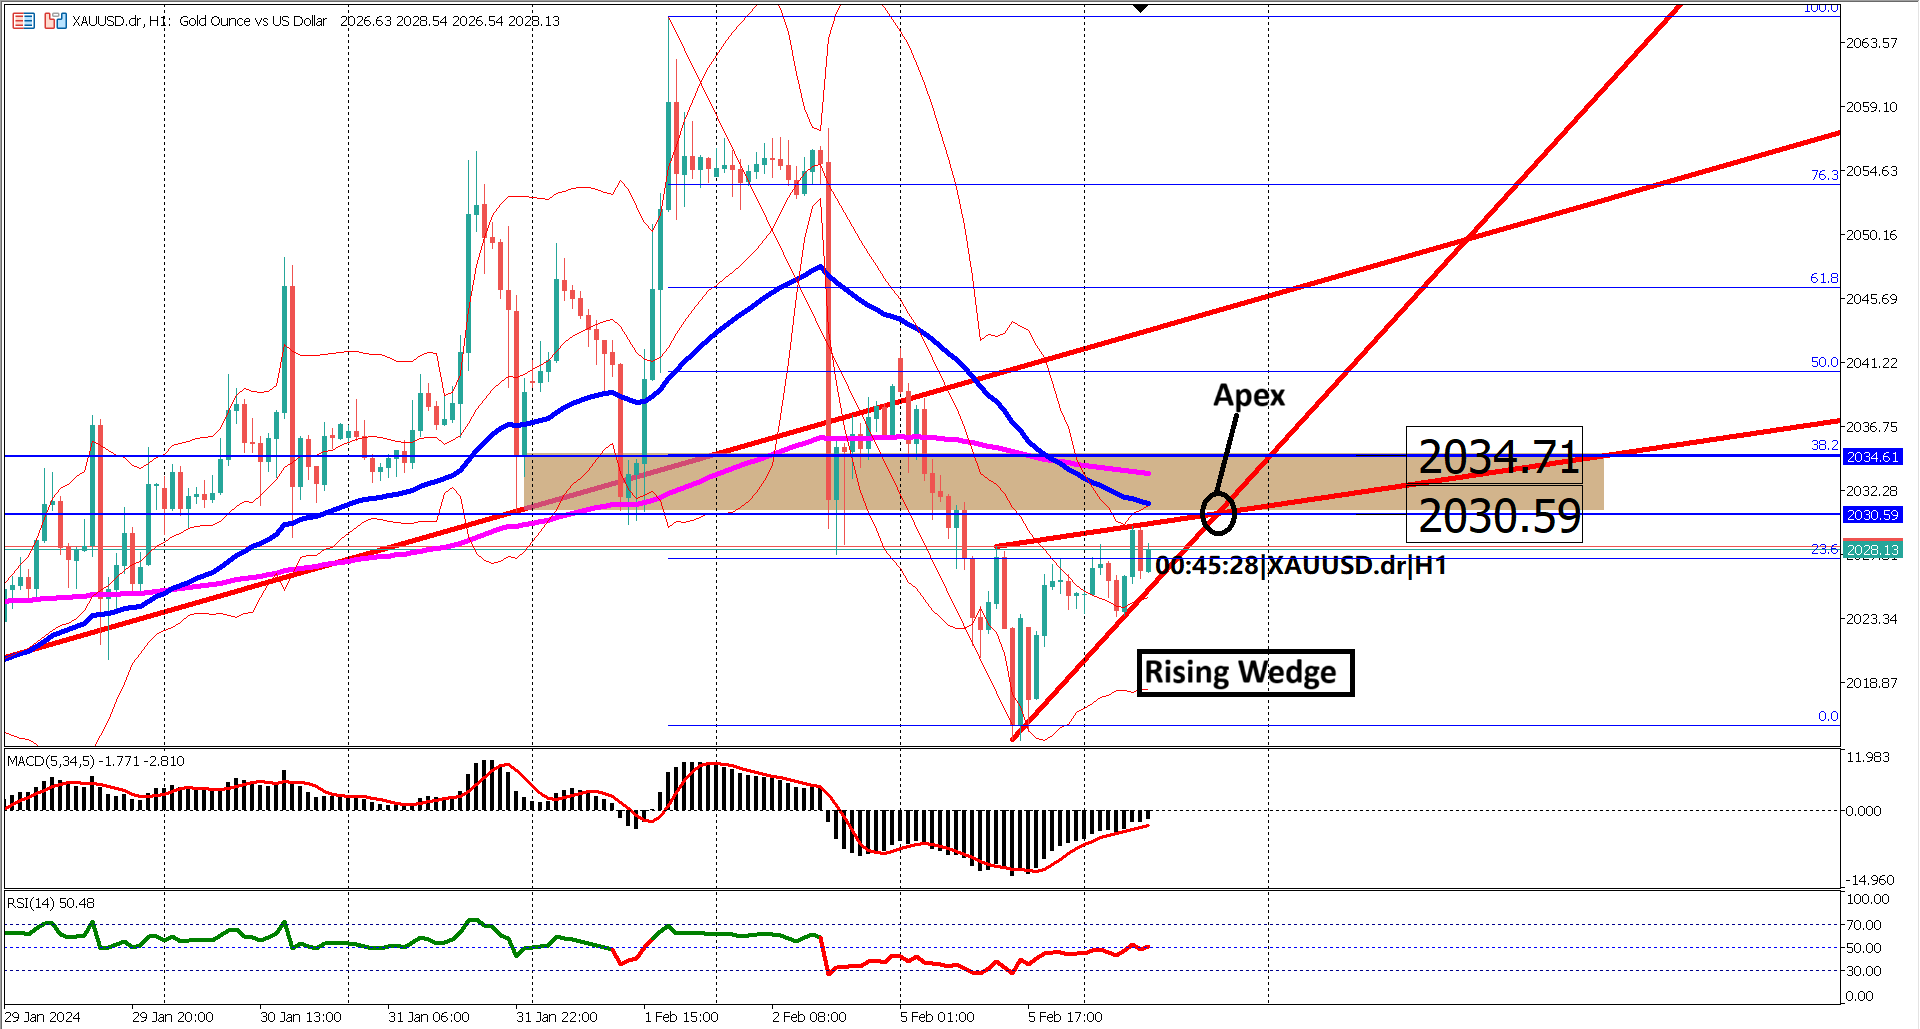

Amidst recent market fluctuations, XTIUSD faces a period of bearish correction, characterized by the formation of either an ascending trend channel or a rising wedge chart pattern over the last two trading sessions.
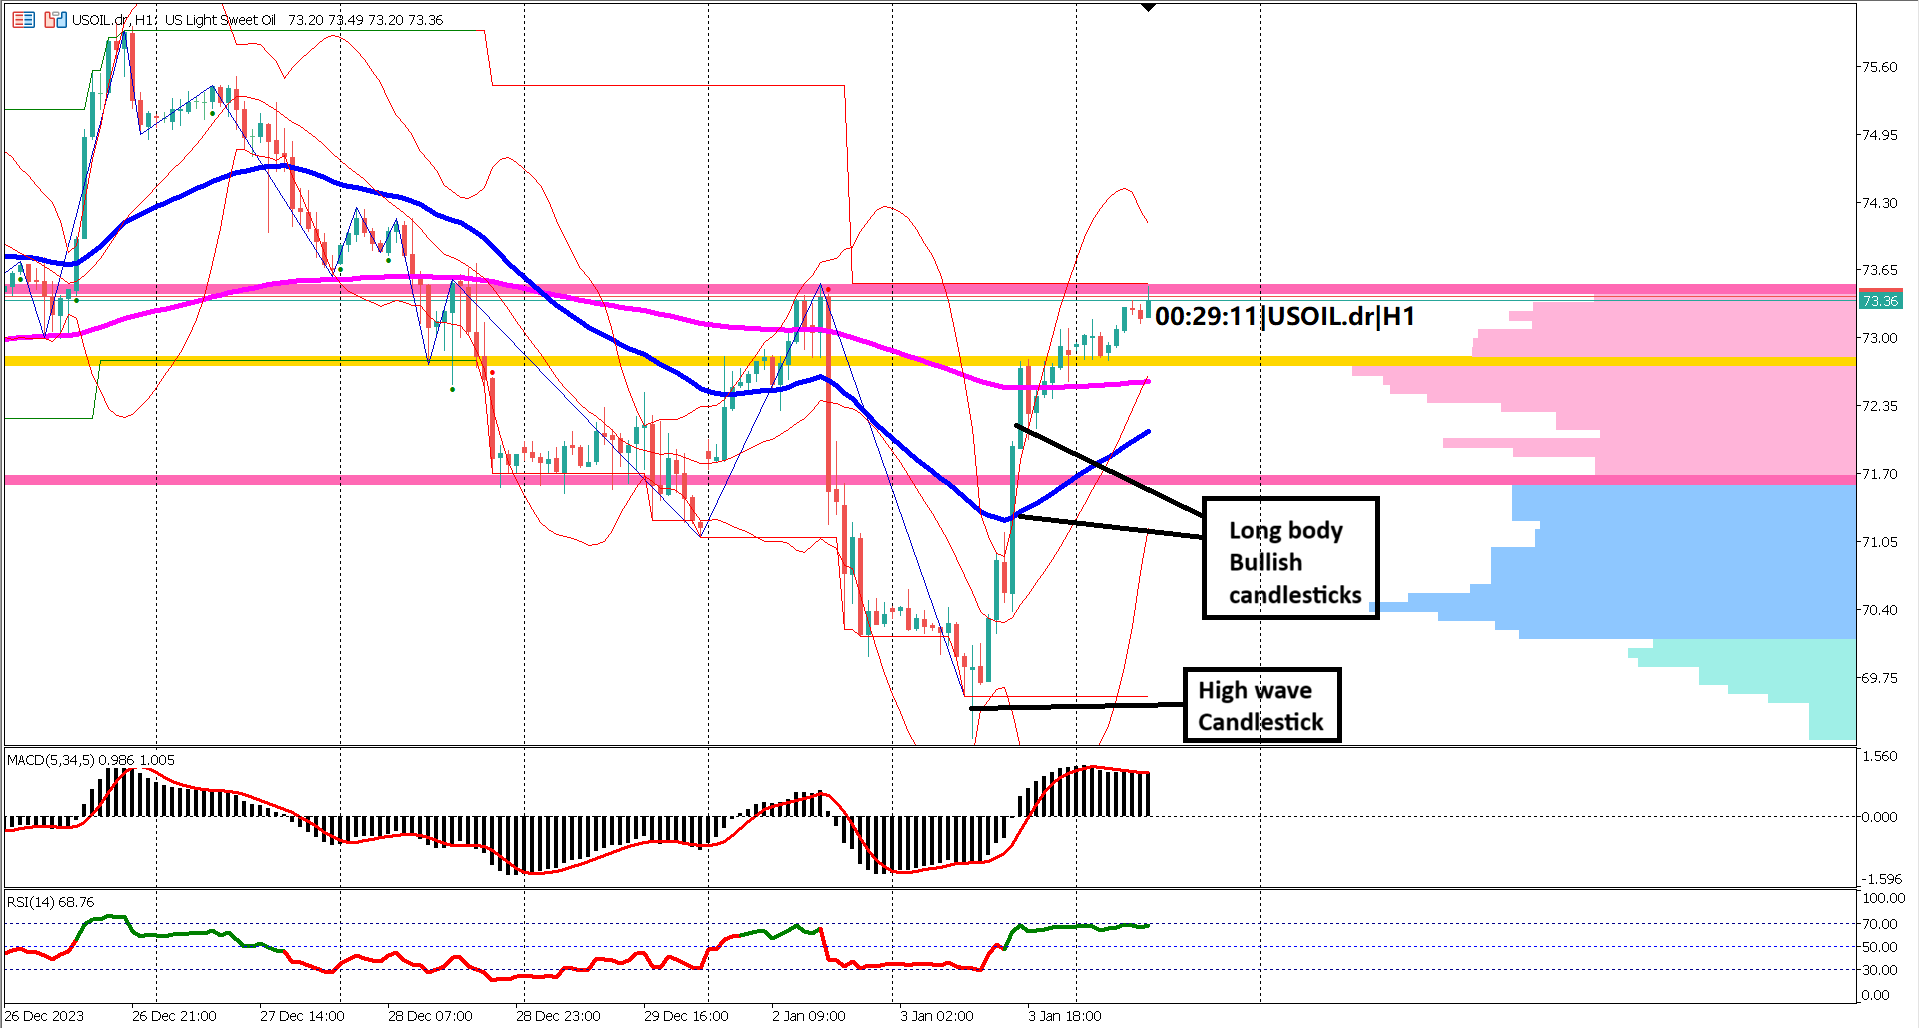
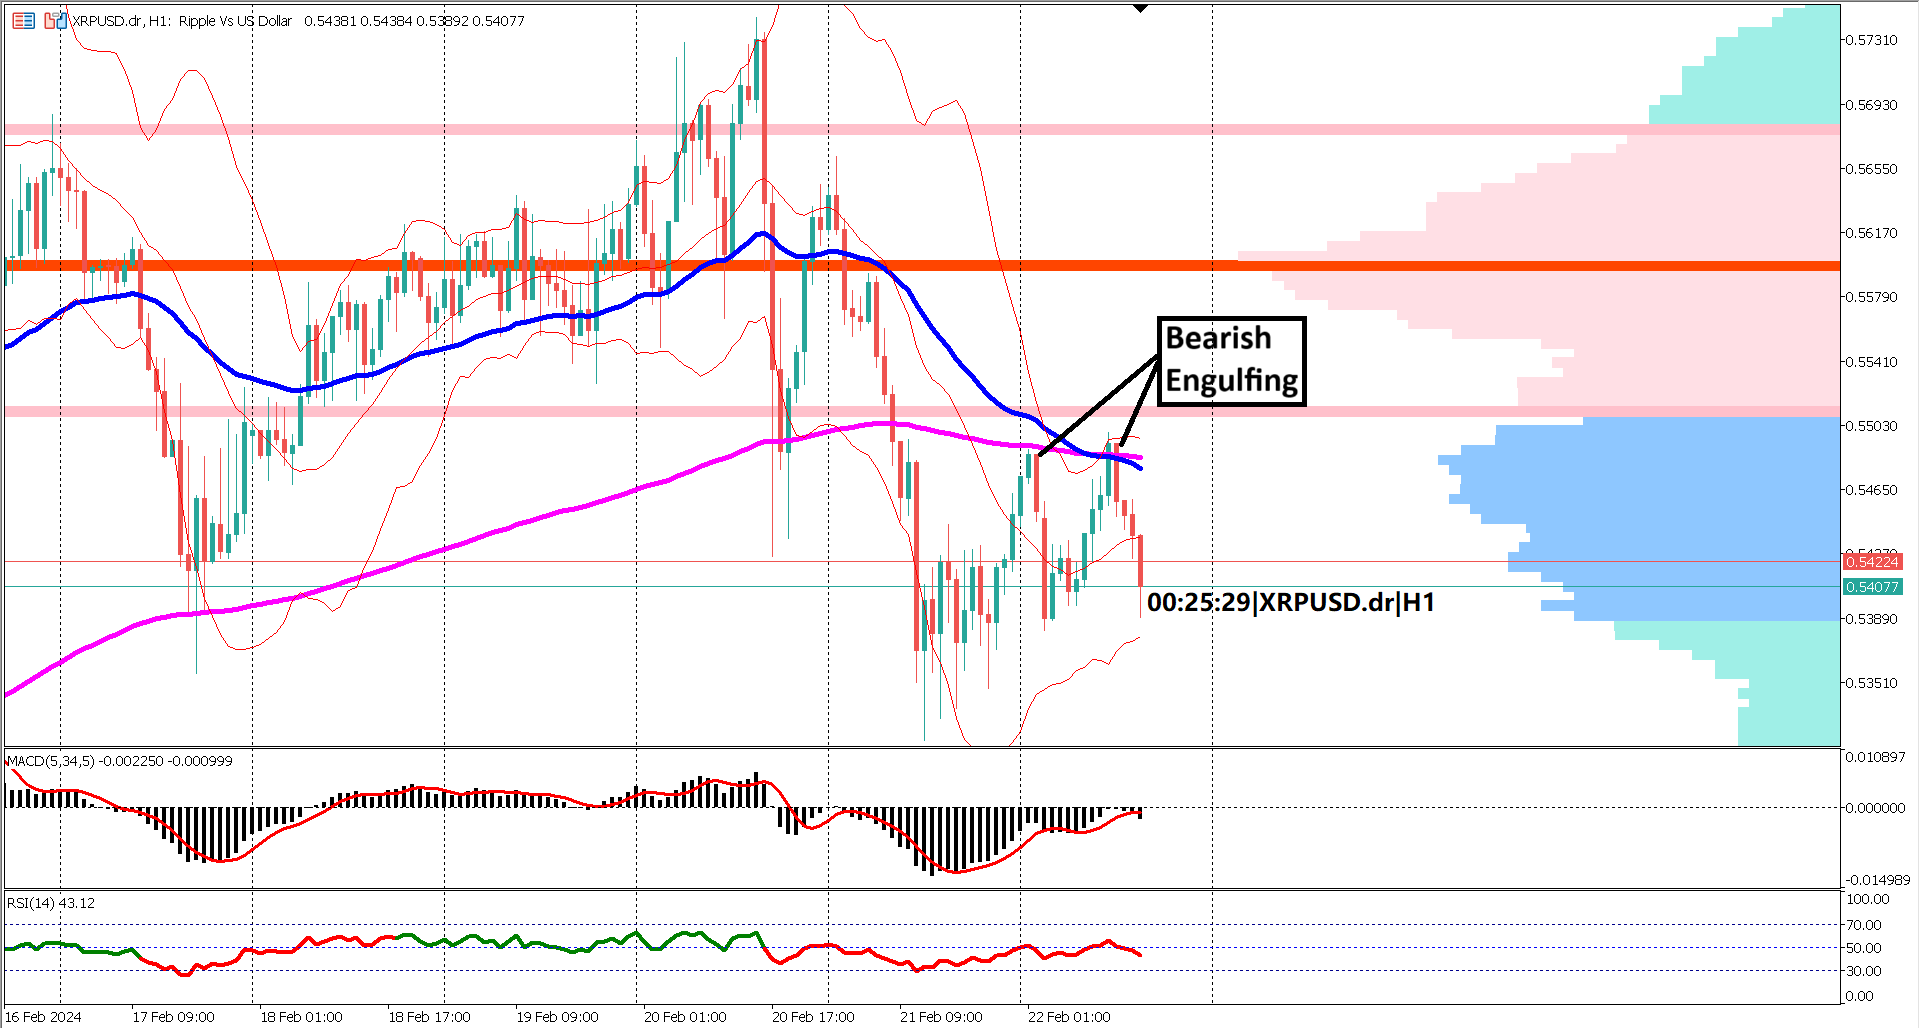
Key resistance levels loom ahead, notably the zone between $74.00-74.60, marked by a cluster of bearish engulfing candlestick patterns observed three trading days ago. This area serves as a critical barrier, indicative of significant bearish pressure.
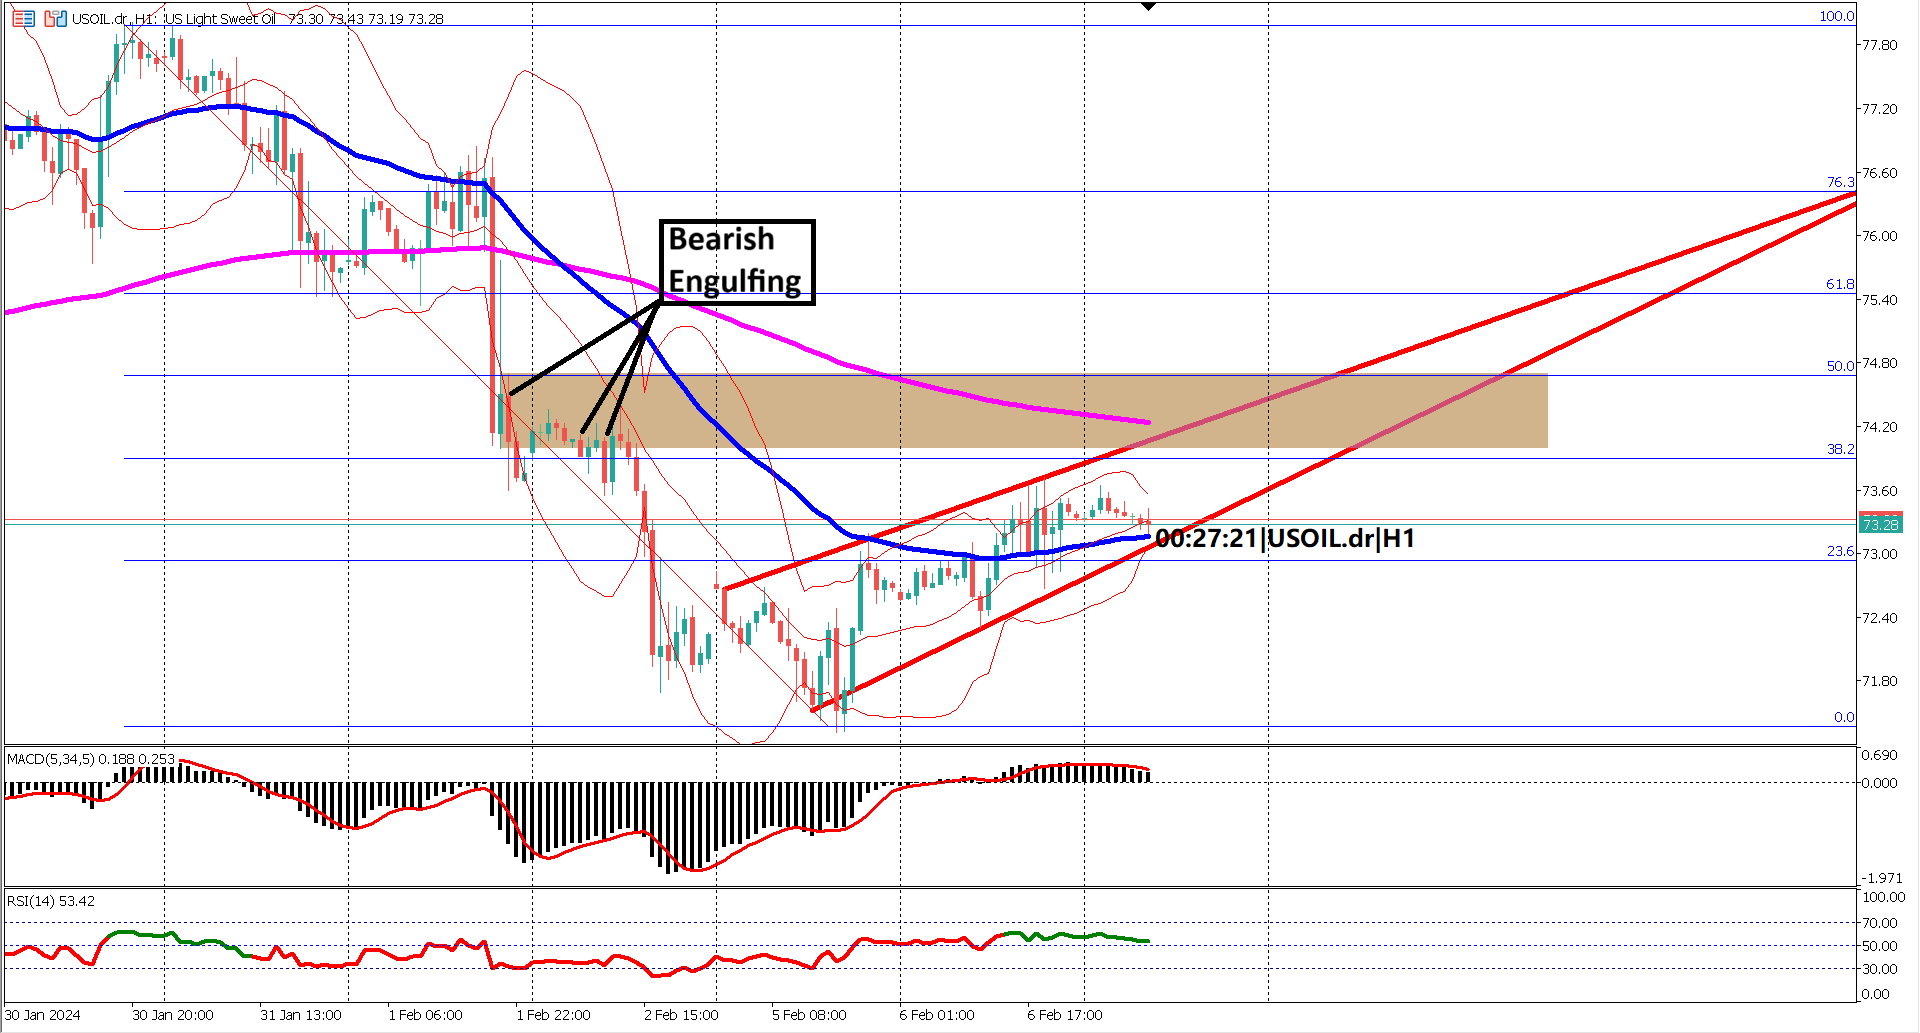
Additionally, attention is drawn to the EMA 200, where XTIUSD has encountered resistance amid a death cross formation over the past three sessions. As the EMA 50 converges towards the EMA 200, further price interaction with this level is anticipated before potential downward continuation.
Today's focus centers on a key economic release for XTI, with economists forecasting higher crude oil inventories in the US. This projection suggests a potential increase in supply, which could drive prices lower if realized as expected or higher.
Analysis of the Bollinger Bands indicates a short-term bullish trend, as prices breach the upper band repeatedly over the past two trading days. However, a breach of the lower band may signal a continuation of the long-term bearish trend.
Oscillator indicators provide mixed signals, with both RSI and MACD pointing bullish. RSI above 50 and MACD signal line above the zero mark suggest potential selling opportunities on pullbacks or higher prices before further downward movement.
In conclusion, XTIUSD presents potential selling opportunities amidst the ongoing pullback. Traders should monitor closely for a break below the chart pattern, which may signal the onset of a bearish trend continuation. Stay informed, stay ahead!
Forecast 1.700M vs Previous 1.234M
Forecast 1.10B vs Previous 1.57B

Trading foreign exchange on margin carries a high level of risk, and may not be suitable for all investors. Before deciding to trade foreign exchange you should carefully consider your investment objectives, level of experience, and risk appetite.
Nothing contained in this website should be construed as investment advice. Any reference to an investment's past or potential performance is not, and should not be construed as, a recommendation or as a guarantee of any specific outcome or profit.