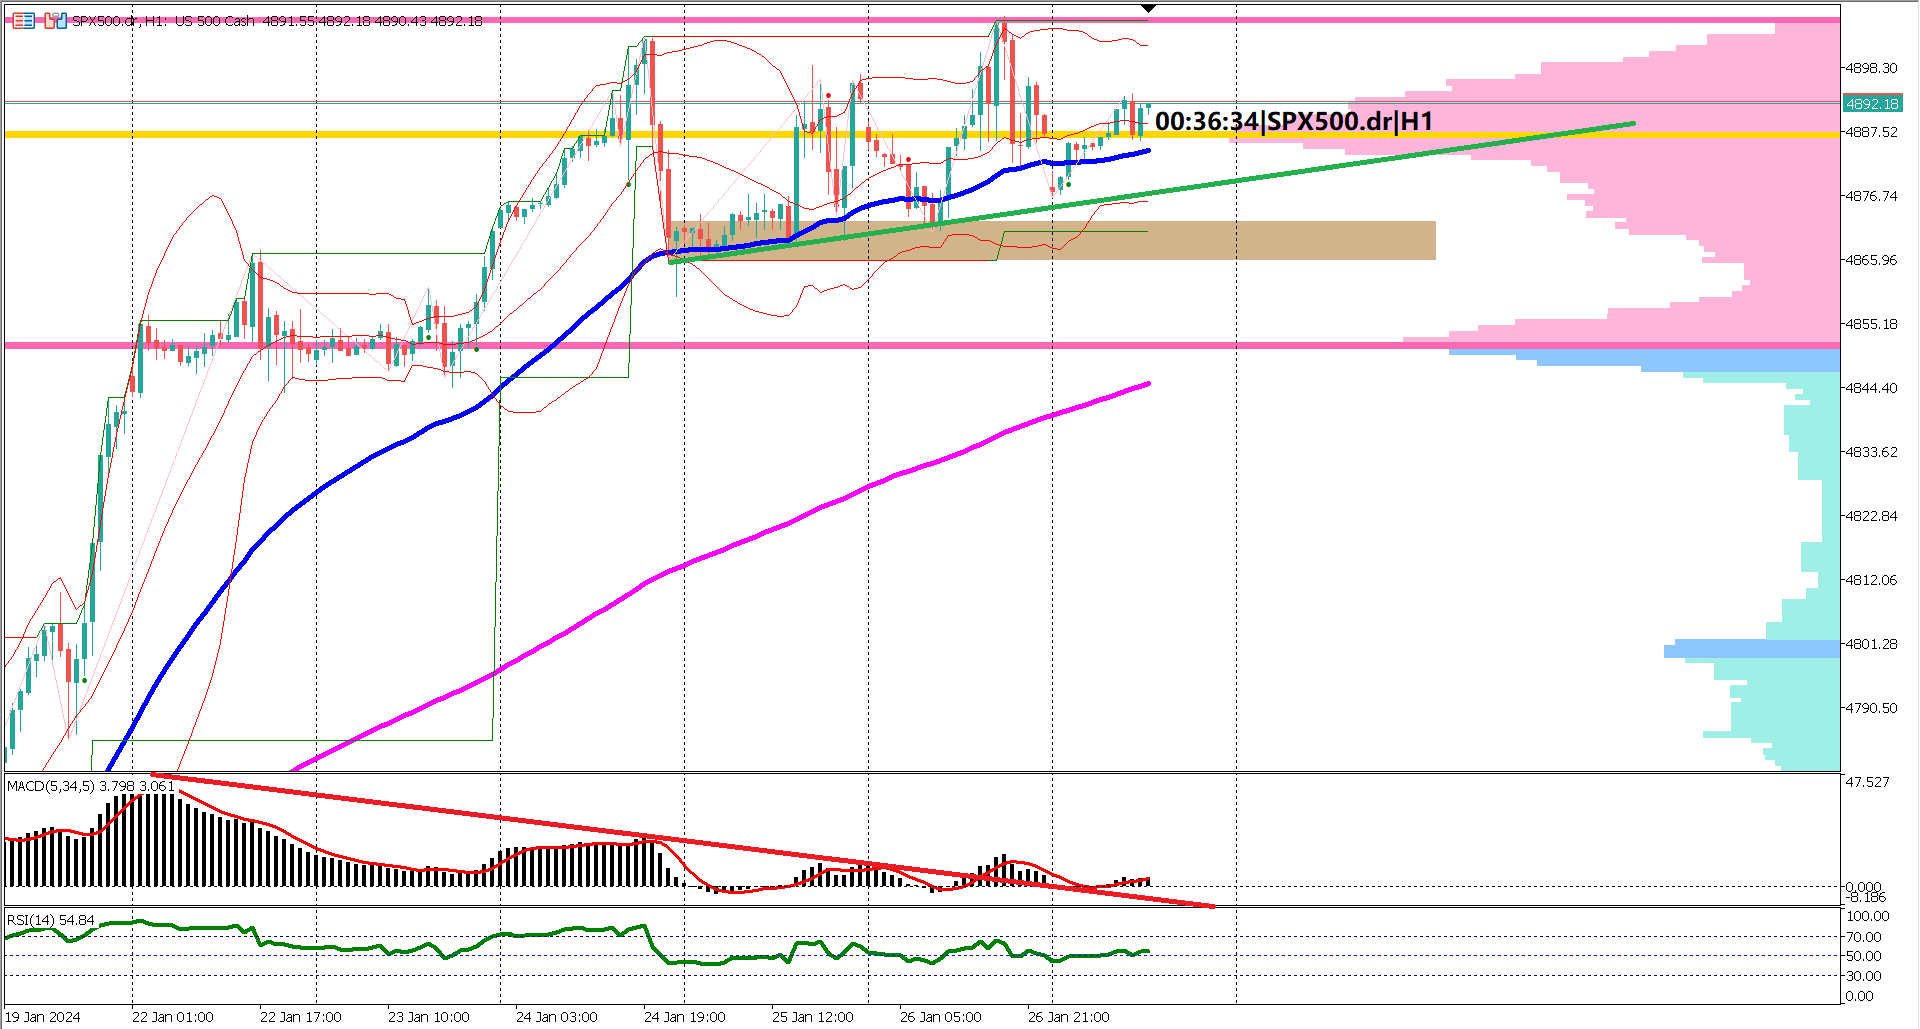
 Amidst a backdrop of uncertainty, the SPX500 is traversing a sideways path, coiling within the confines of a symmetrical triangle chart pattern. At the heart of this pattern lies a pivotal intersection, the apex, residing at $4959, acting as a crucial resistance point. Conversely, a noteworthy support level lies at $4934, previously a resistance that has since transformed into a stronghold of support.
The directional bias of the SPX500 is poised delicately on a knife's edge. A breach below the key support level could signify a bearish reversal, suggesting a shift in sentiment towards the downside. Conversely, should prices honor the support and ascend beyond the resistance, it may signal a resumption of the bullish trajectory.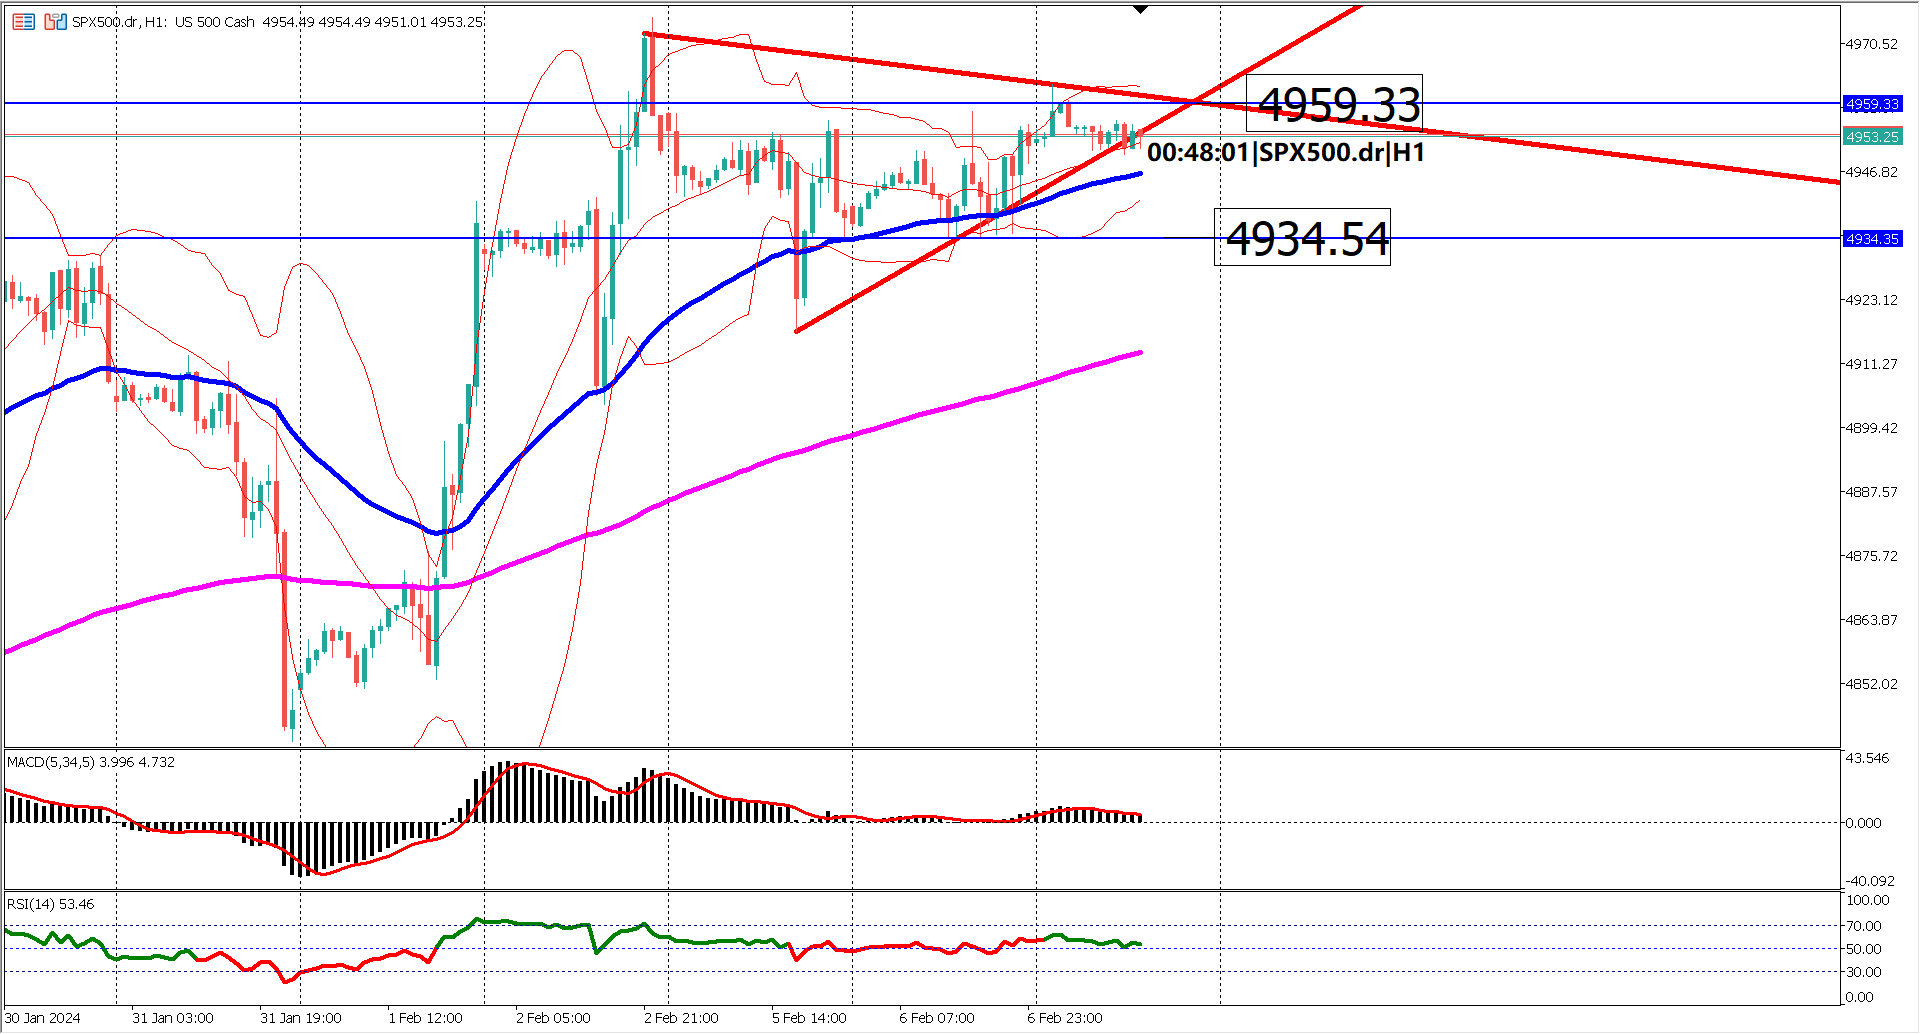
A glance at the EMA 50 and 200 reveals a harmonious alignment, both pointing upwards. This convergence underscores the prevailing strength of the bullish momentum. Furthermore, the space between these moving averages serves as a supportive zone. A breach beneath the EMA 200 might foreshadow an impending reversal.
The Bollinger bands, oscillating between their upper and lower bounds over the past three trading sessions, corroborate the sideways movement. However, given the prevailing consolidation phase, relying solely on Bollinger bands breakout may prove unreliable. Instead, traders are urged to closely monitor price breakouts and chart pattern formations for more robust signals.
In examining the oscillator indicators, bullish sentiments persist. The MACD's signal line hovers comfortably above the zero line, indicative of a bullish trend, while the RSI maintains its position above the 40% threshold, affirming positive market sentiment.
In conclusion, the SPX500 remains entrenched in bullish territory, with the potential for further upside movement. However, traders are advised to exercise caution, particularly in light of the pivotal support level. A breach below this level could negate the bullish outlook, paving the way for a possible bearish reversal. Stay vigilant and adapt to evolving market conditions.
Sideways Movement: The SPX500 is currently consolidating within a symmetrical triangle chart pattern, suggesting indecision in the market.
Crucial Levels: Watch the apex at $4959 as a significant resistance and $4934 as a key support-turned-resistance level. These levels could dictate the next directional move.
EMA Alignment: The EMA 50 and 200 are aligned upwards, signaling the prevailing bullish momentum. However, a breach below the EMA 200 might hint at a potential trend reversal.
Bollinger Bands: Oscillation between the upper and lower bands indicates a sideways trend. Traders should prioritize price breakouts and chart patterns for clearer signals.
Oscillator Indicators: Both MACD and RSI continue to reflect bullish sentiment. However, vigilance is crucial, especially around the pivotal support level, as a breach could shift the outlook to bearish.
Forecast 1.700M vs Previous 1.234M
Forecast 1.10B vs Previous 1.57B

Trading foreign exchange on margin carries a high level of risk, and may not be suitable for all investors. Before deciding to trade foreign exchange you should carefully consider your investment objectives, level of experience, and risk appetite.
Nothing contained in this website should be construed as investment advice. Any reference to an investment's past or potential performance is not, and should not be construed as, a recommendation or as a guarantee of any specific outcome or profit.