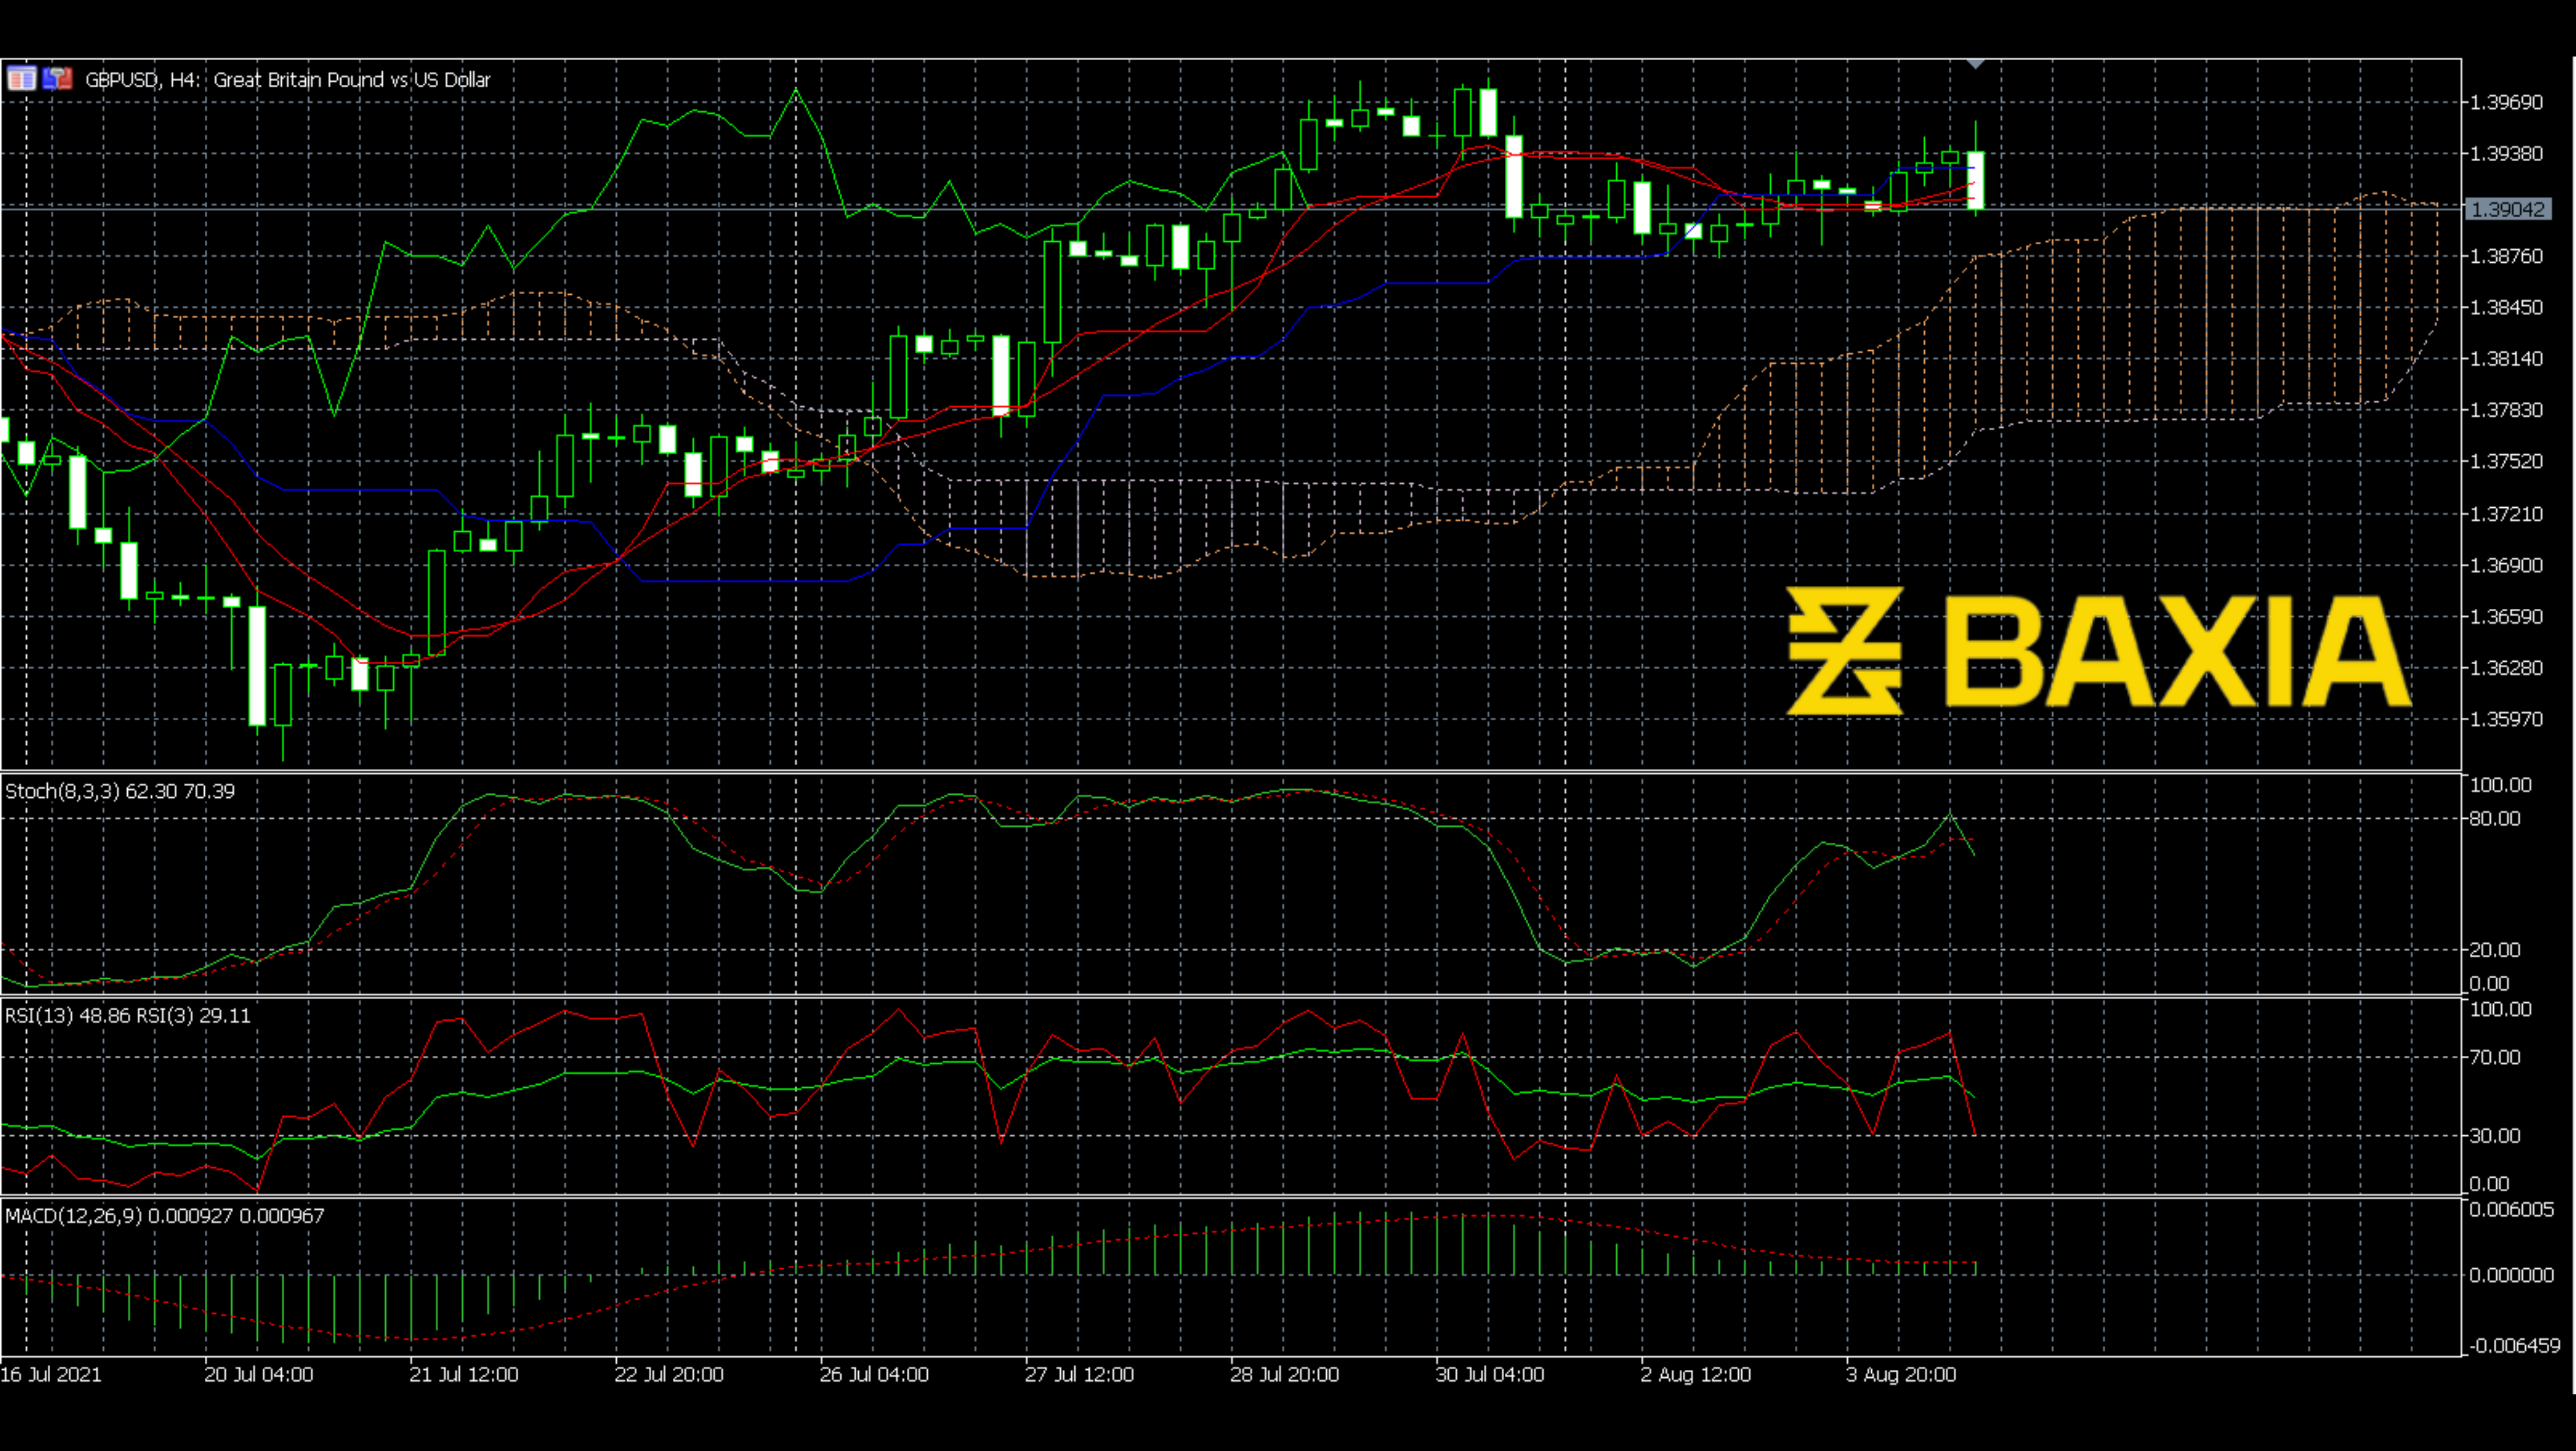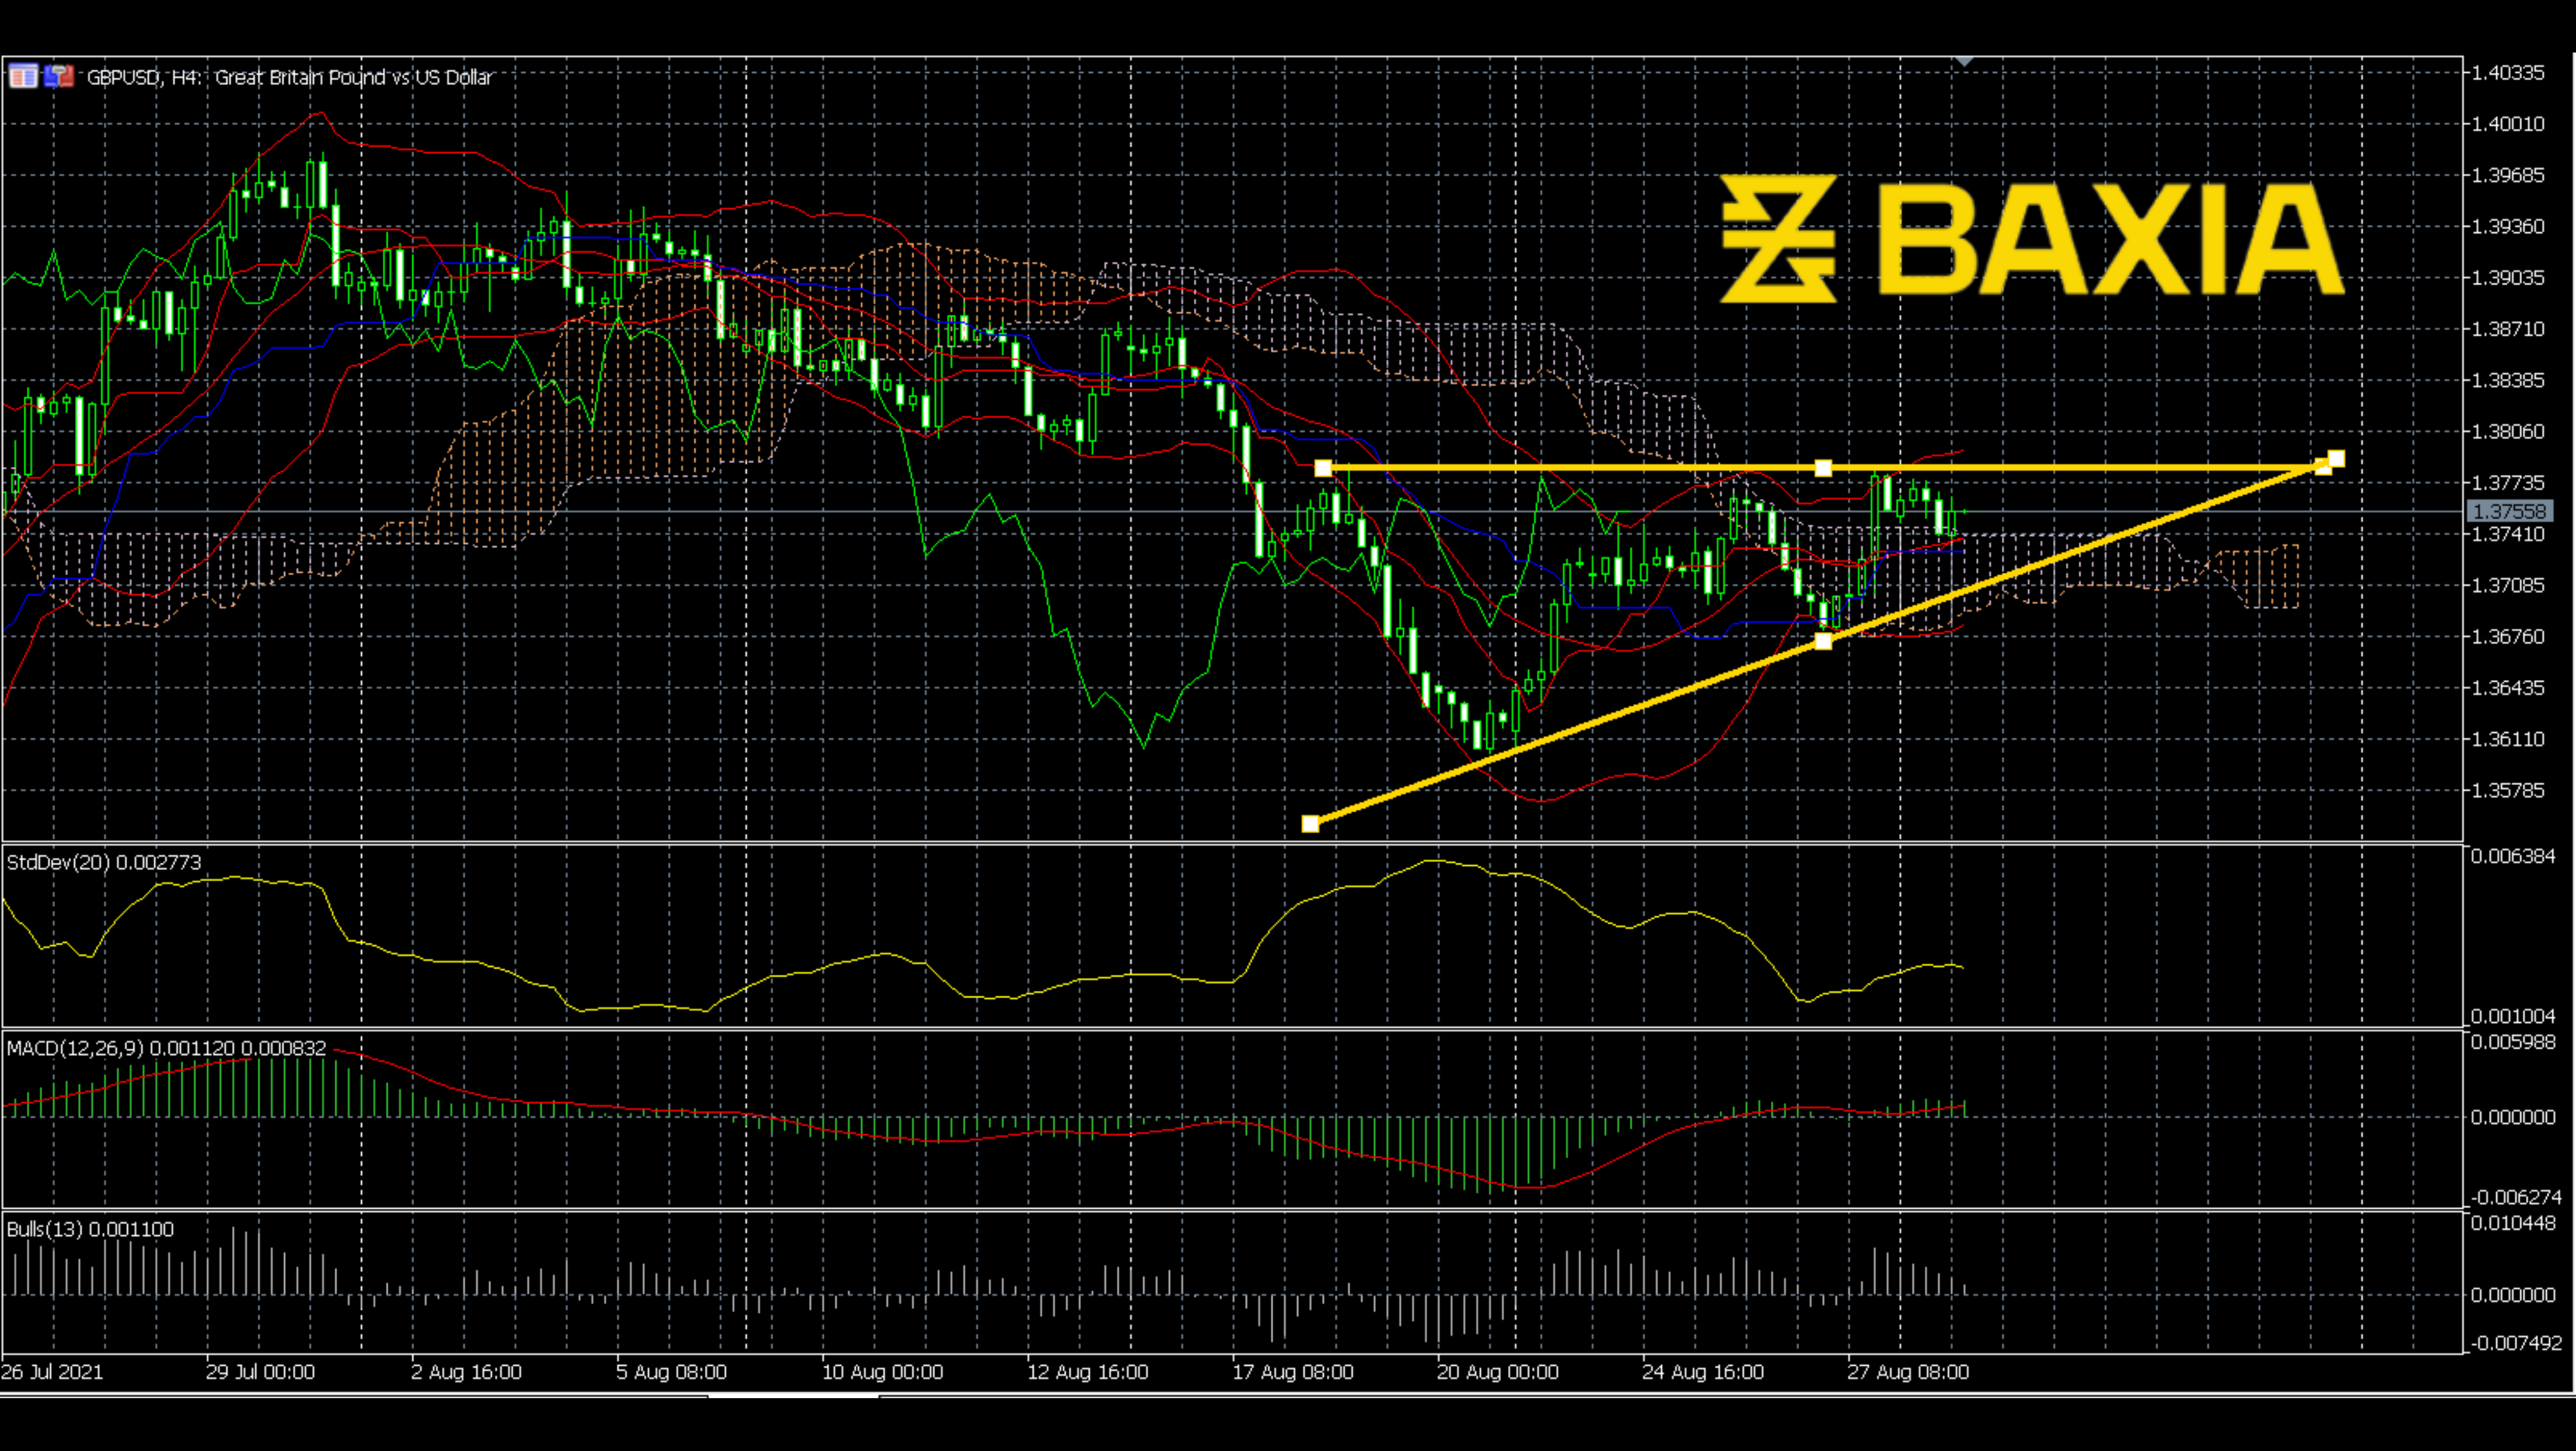

The previous upward trend lasted for around two weeks. From the 4H chart, we can see that the upward trend was powerful; however, it stopped suddenly; the resistance seemed to be strong. After the resistance, the price has been down 1.8 percent in two days.
The Fibonacci retracement shows that the price now met the 50% level, which is a point that is worth thinking about. Will the price continue to go down? Or a reclaim? Unlike the 61.8% level, the 50% level is comparatively embarrassed. It is neither a strong support level nor a minor retracement.
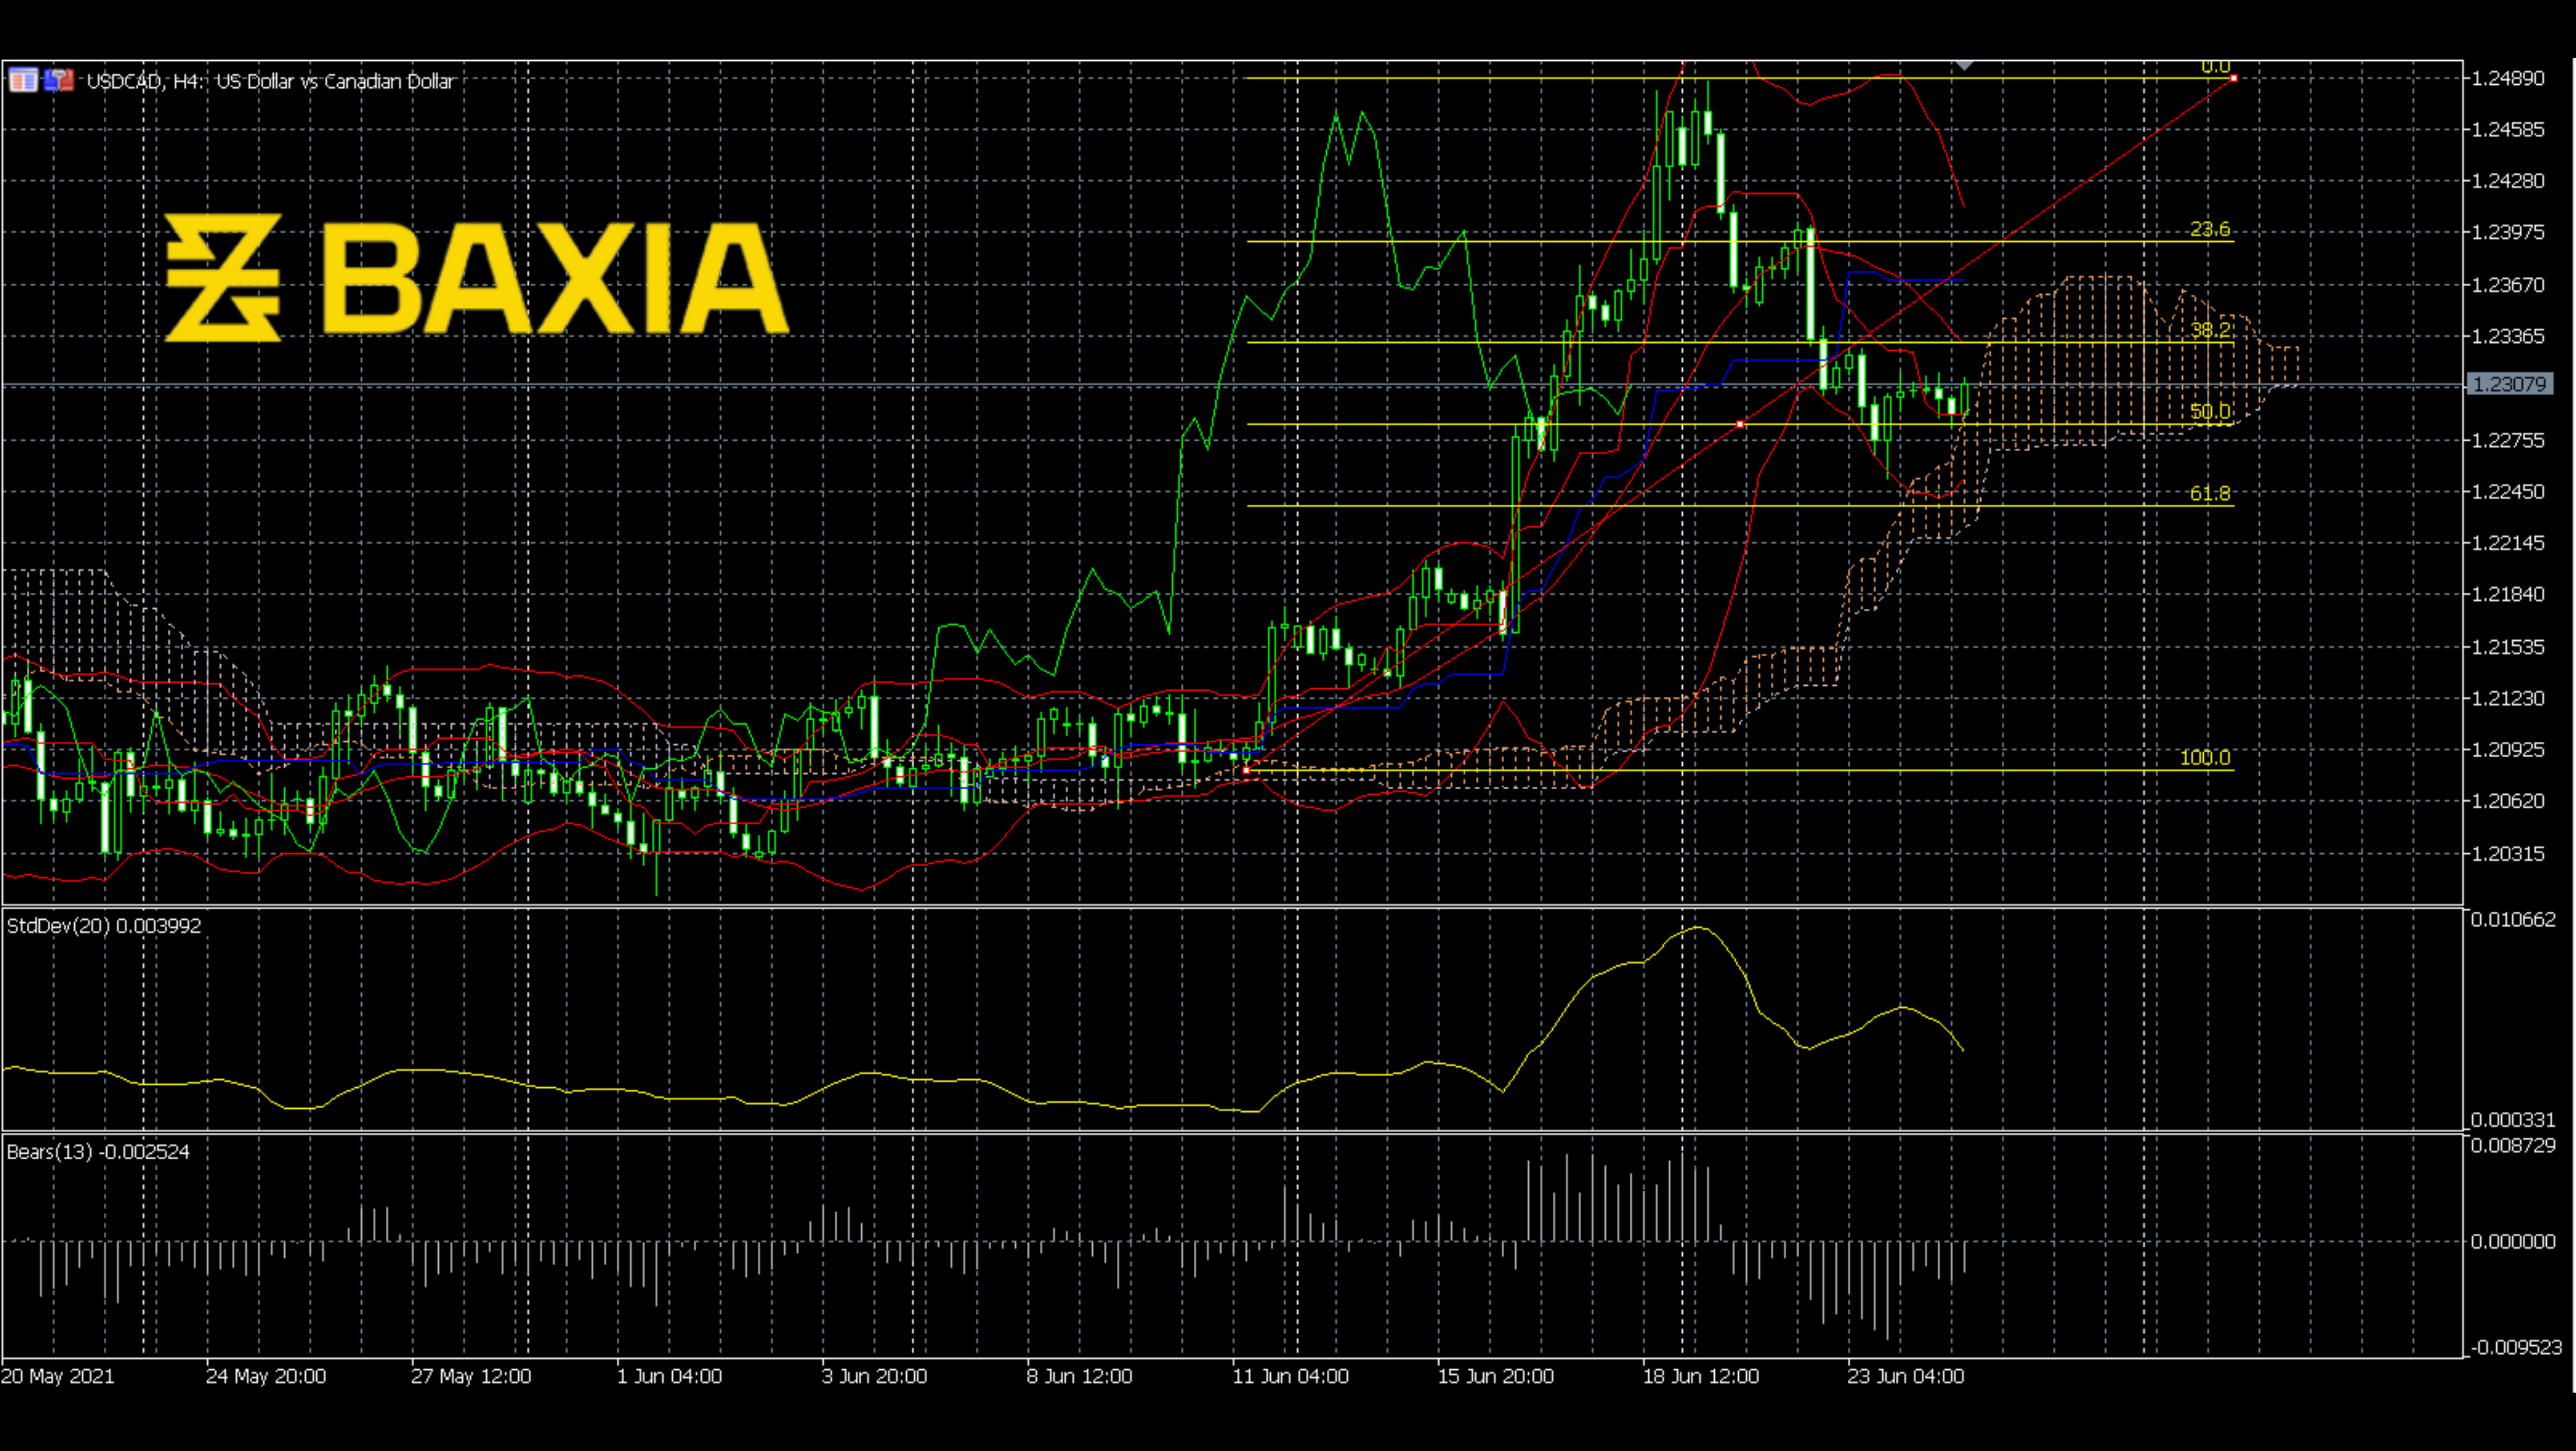
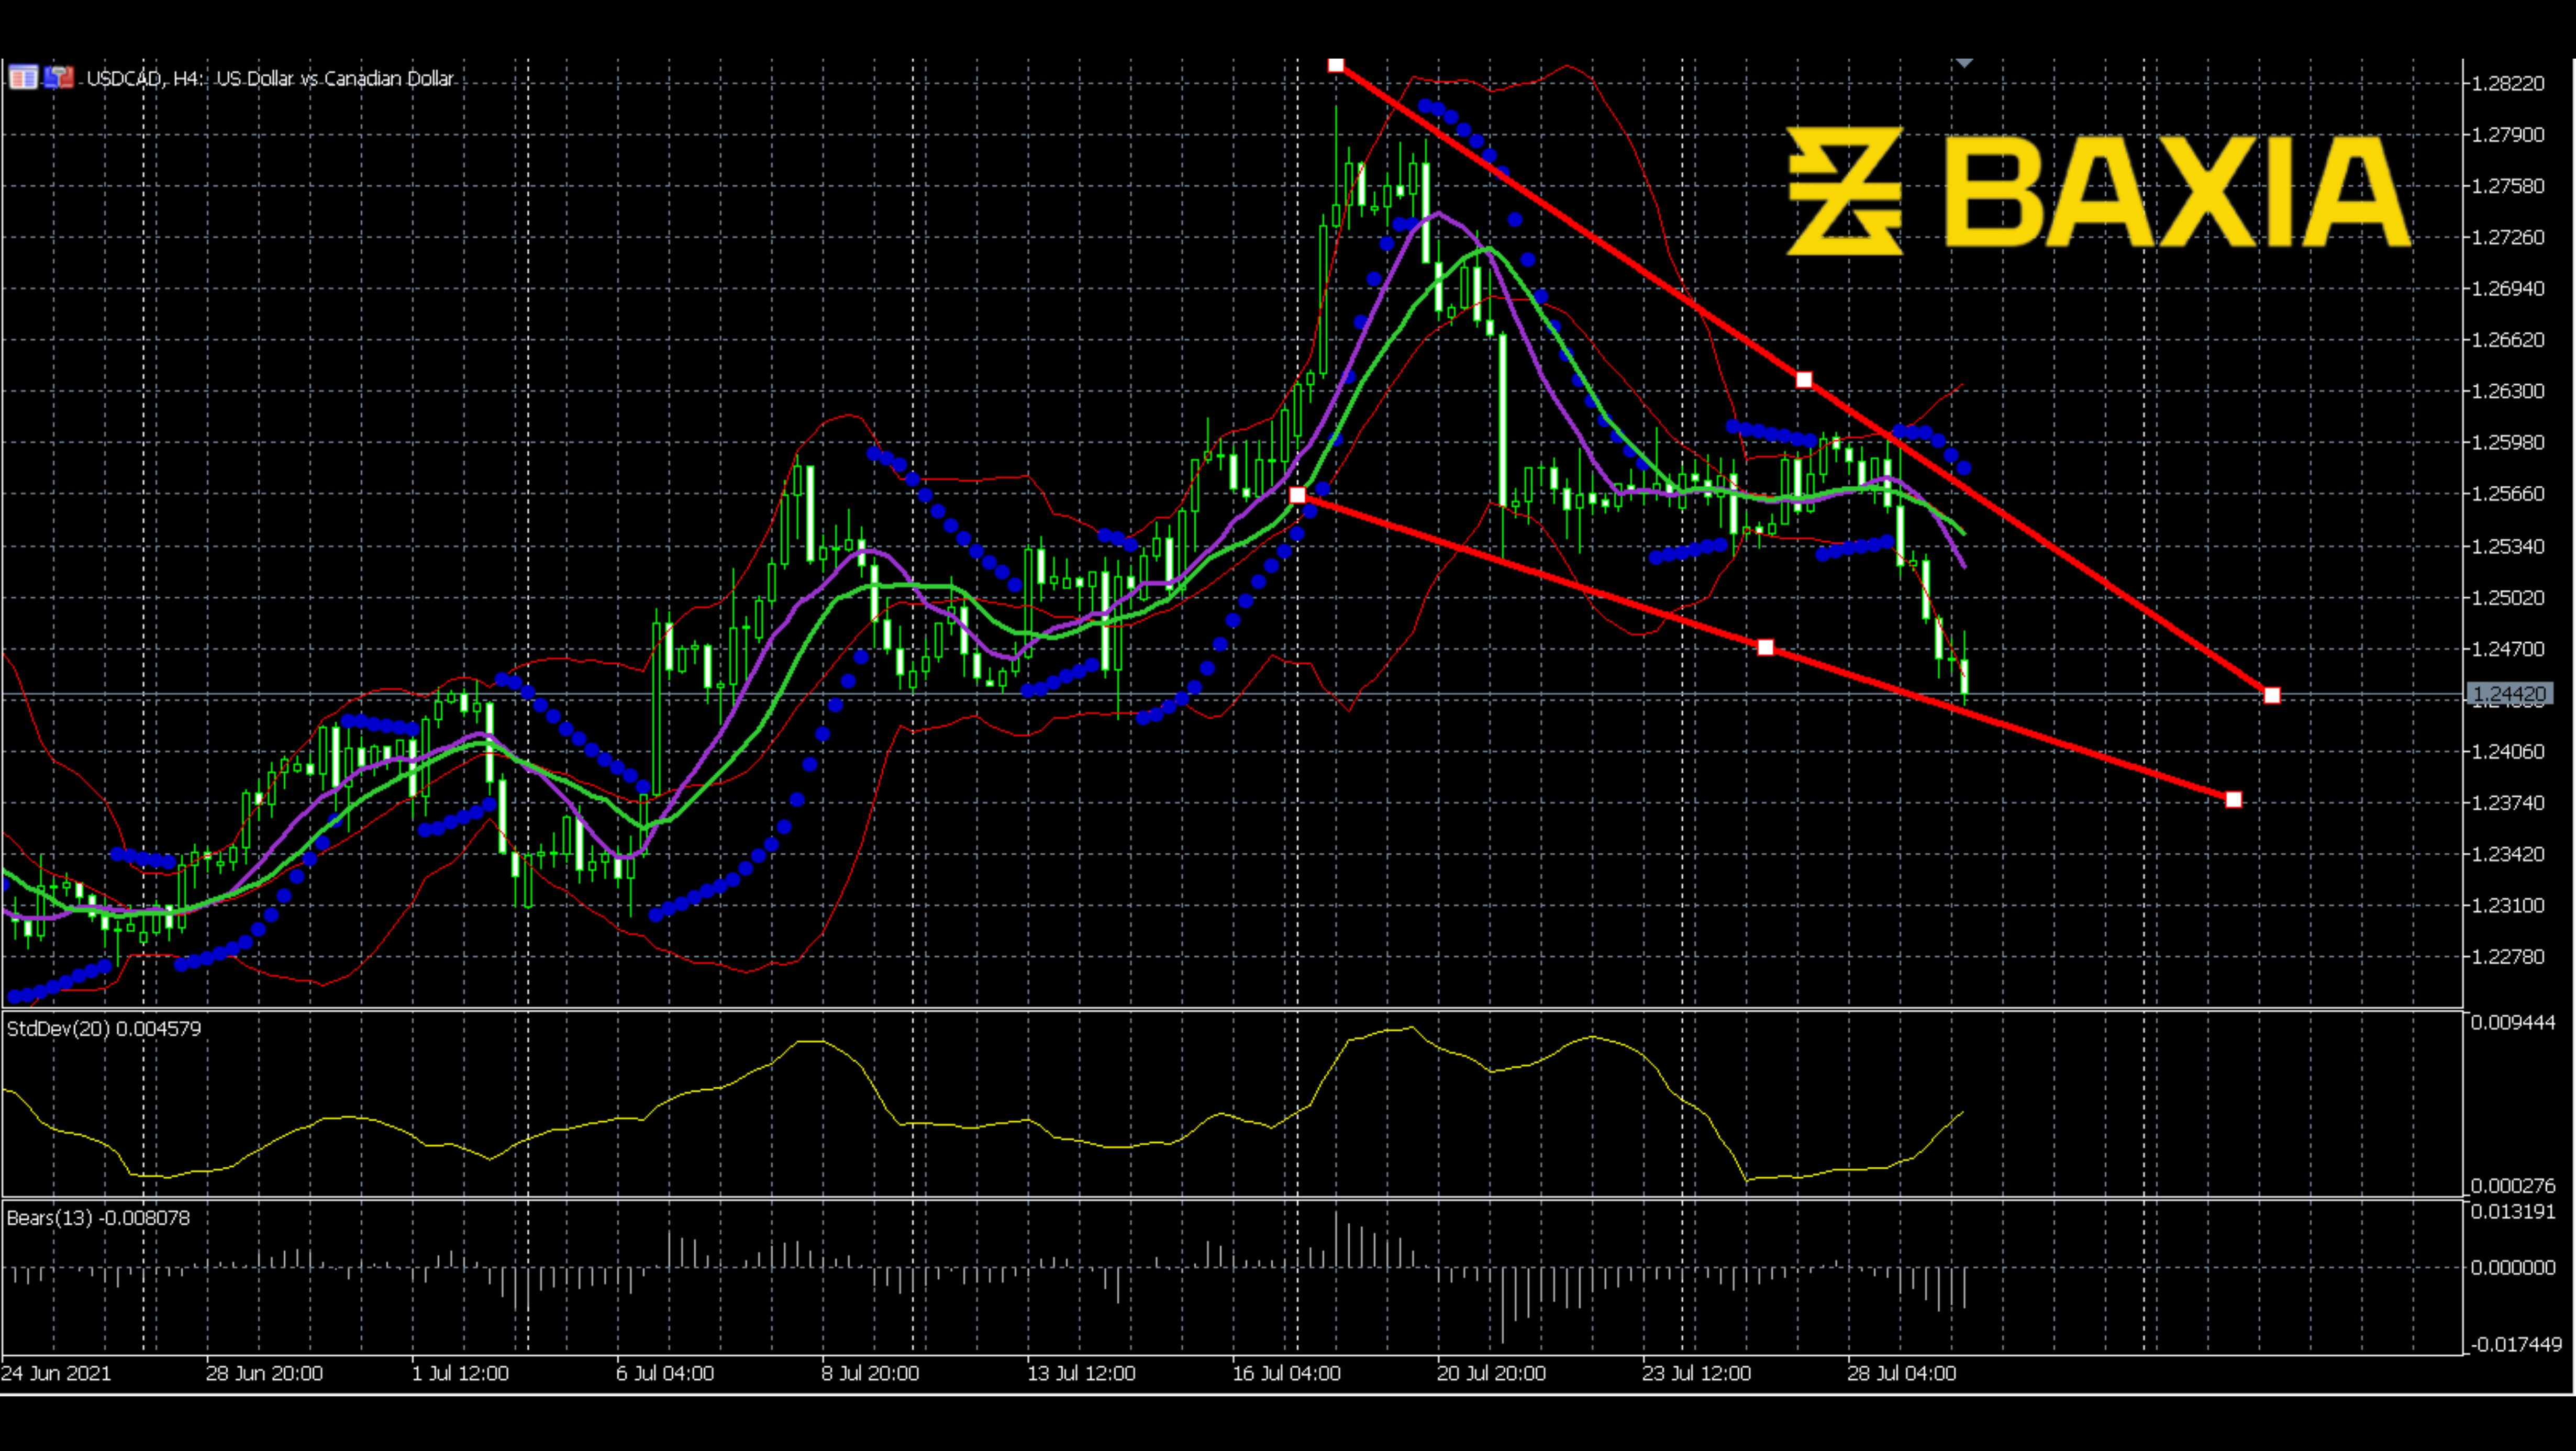
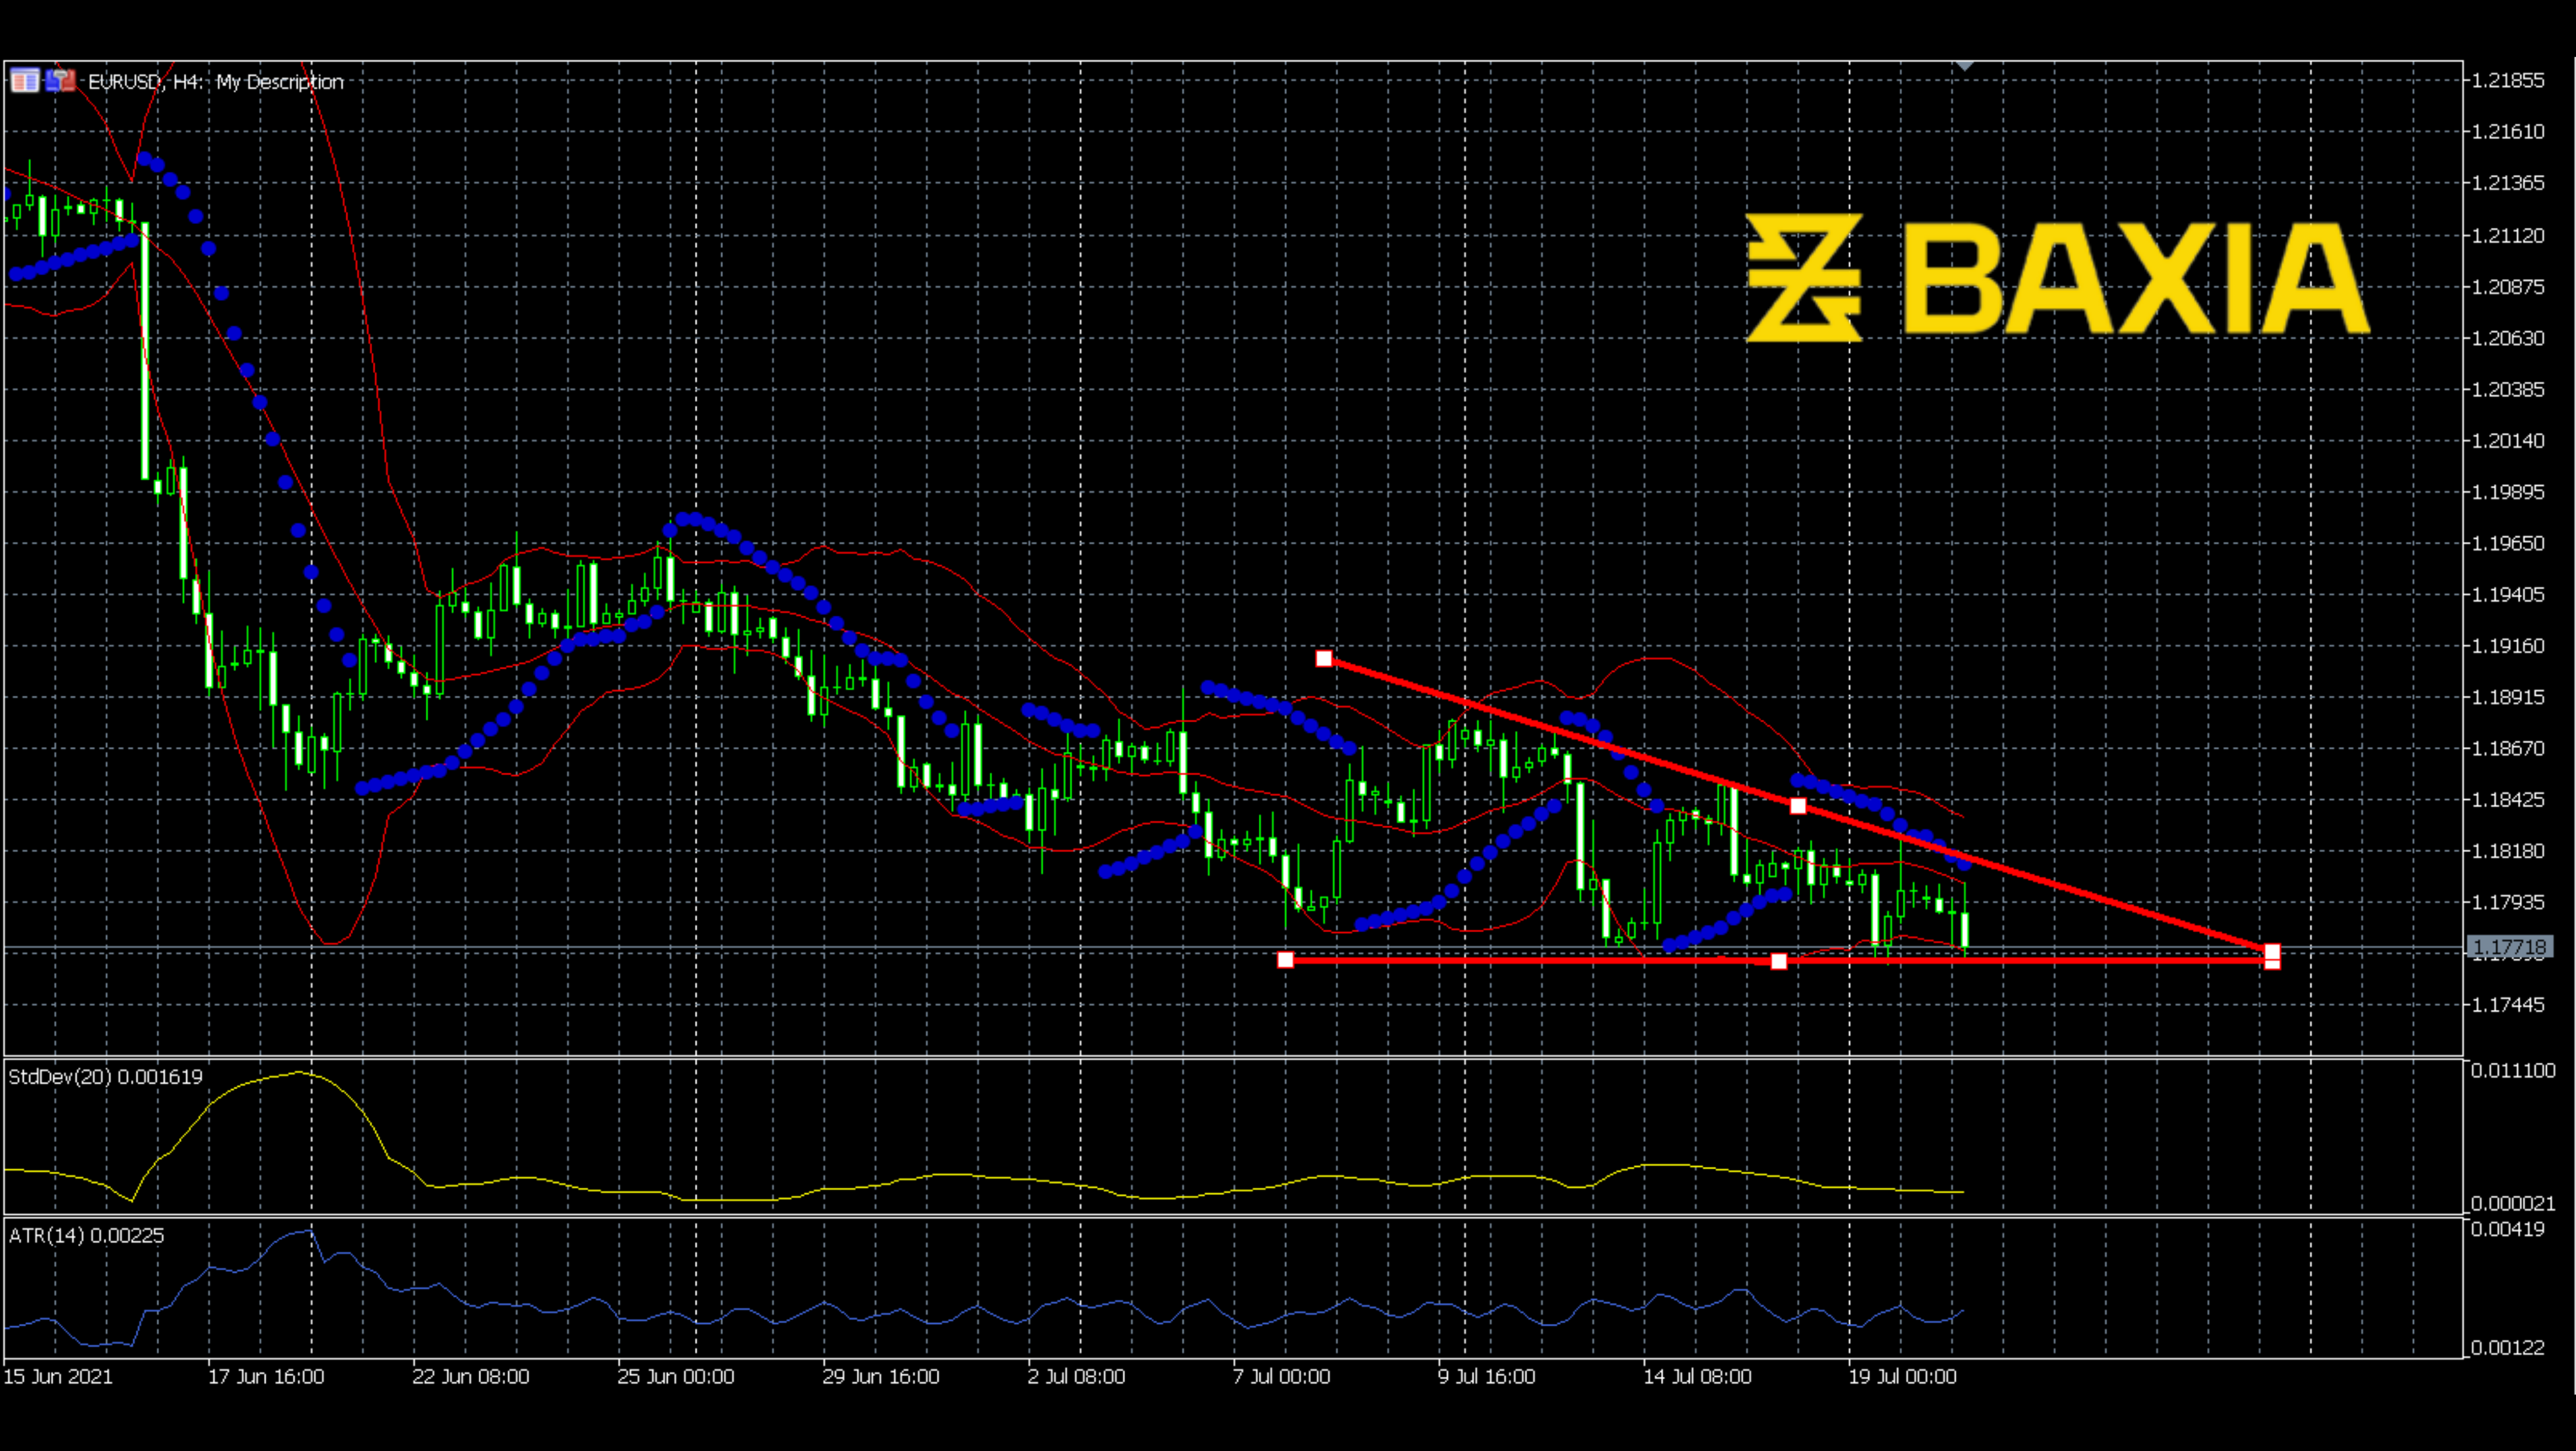
The Bollinger Bands shrunk again, which means the breakout has not started yet. We can still expect a fluctuation. Ichimoku cools down from a thick part; however, it is still at a high level. Bear power also shows a bearish signal; the potential of the downward trend can be seen here.
From the signal above, I can tell that the downward trend has not stopped yet. Although a small wave showed up, the standard deviation is still going down. Let’s expect the price to go down.
We love to hear new ideas from traders and want to know what you think!
If you like this topic and want to suggest future topics that you find helpful, let us know by clicking the ‘submit your feedback’ button below.

Trading foreign exchange on margin carries a high level of risk, and may not be suitable for all investors. Before deciding to trade foreign exchange you should carefully consider your investment objectives, level of experience, and risk appetite.
Nothing contained in this website should be construed as investment advice. Any reference to an investment's past or potential performance is not, and should not be construed as, a recommendation or as a guarantee of any specific outcome or profit.