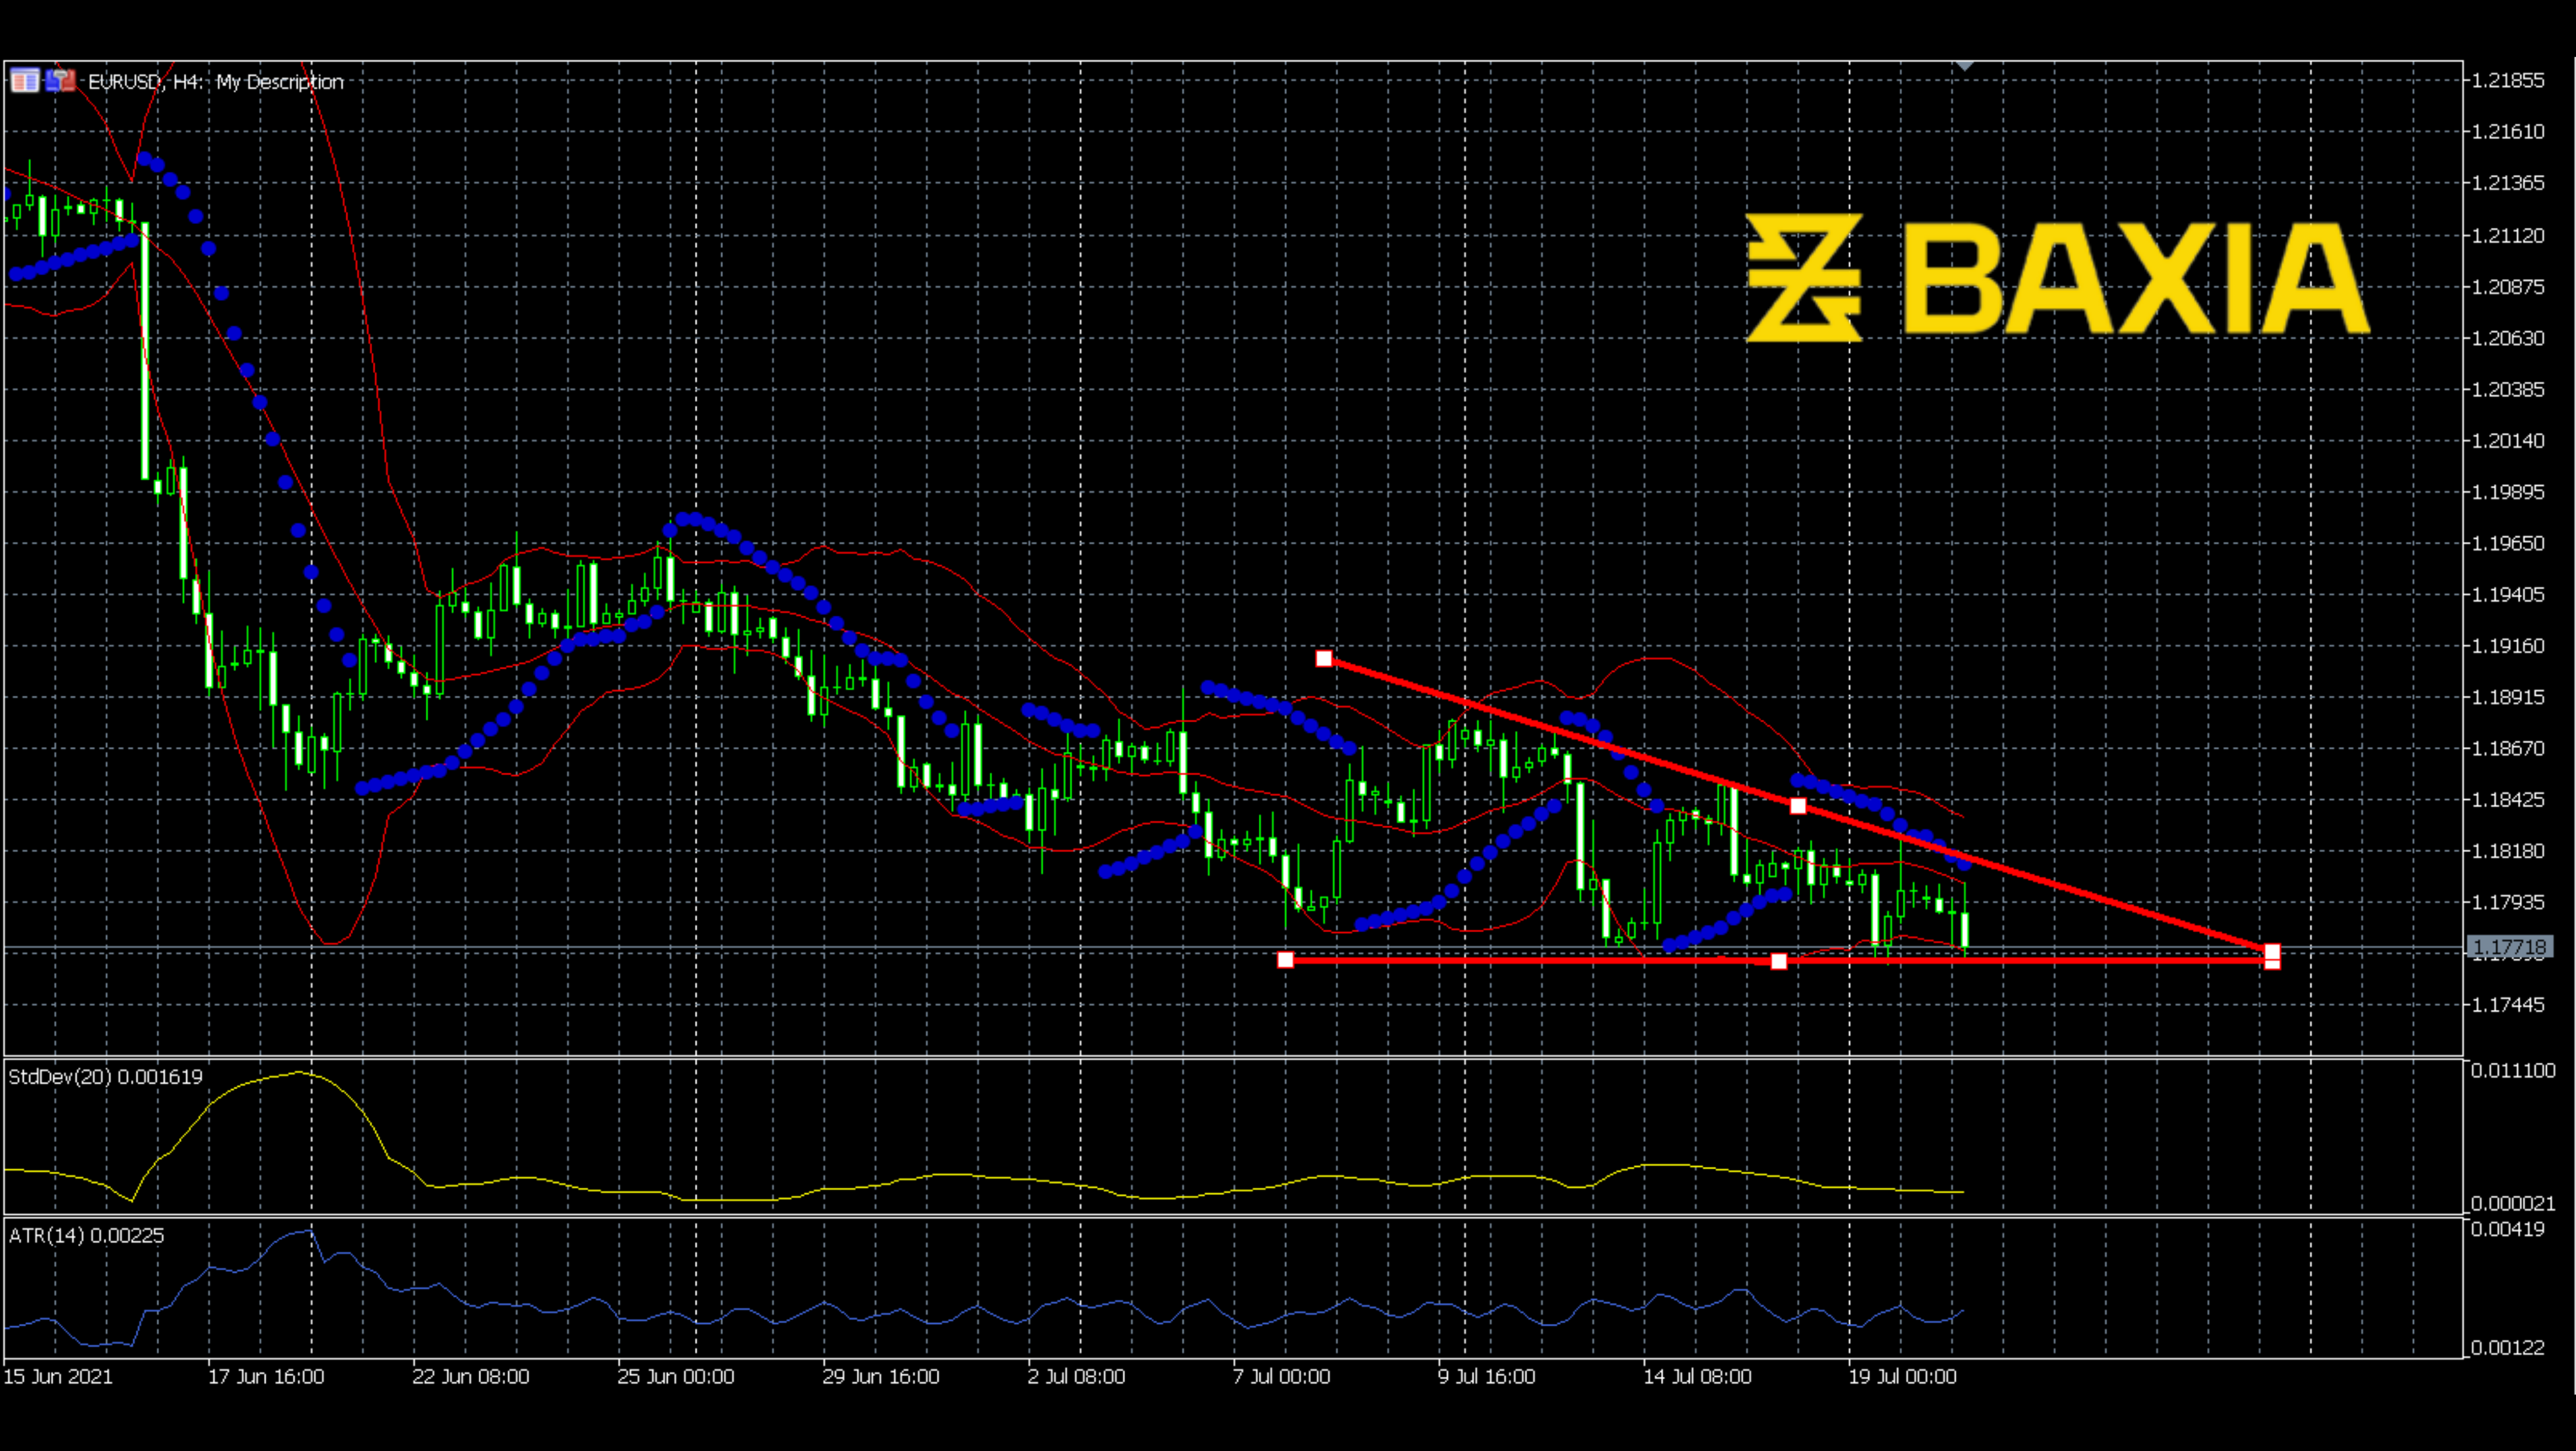

The price of USDCAD had risen since May 18th. The upward movement had lasted two months during the rising movement. The price had gone steeper and steeper; however, the upward trend stopped suddenly on Jul 19th, which shocked many traders. The downward trend was also steep; it went down 2.63% during eight days.
As can be seen, the falling waves have been making a falling wedge. The falling wedge is a bullish signal, so will the price go up after the wedge finishes?
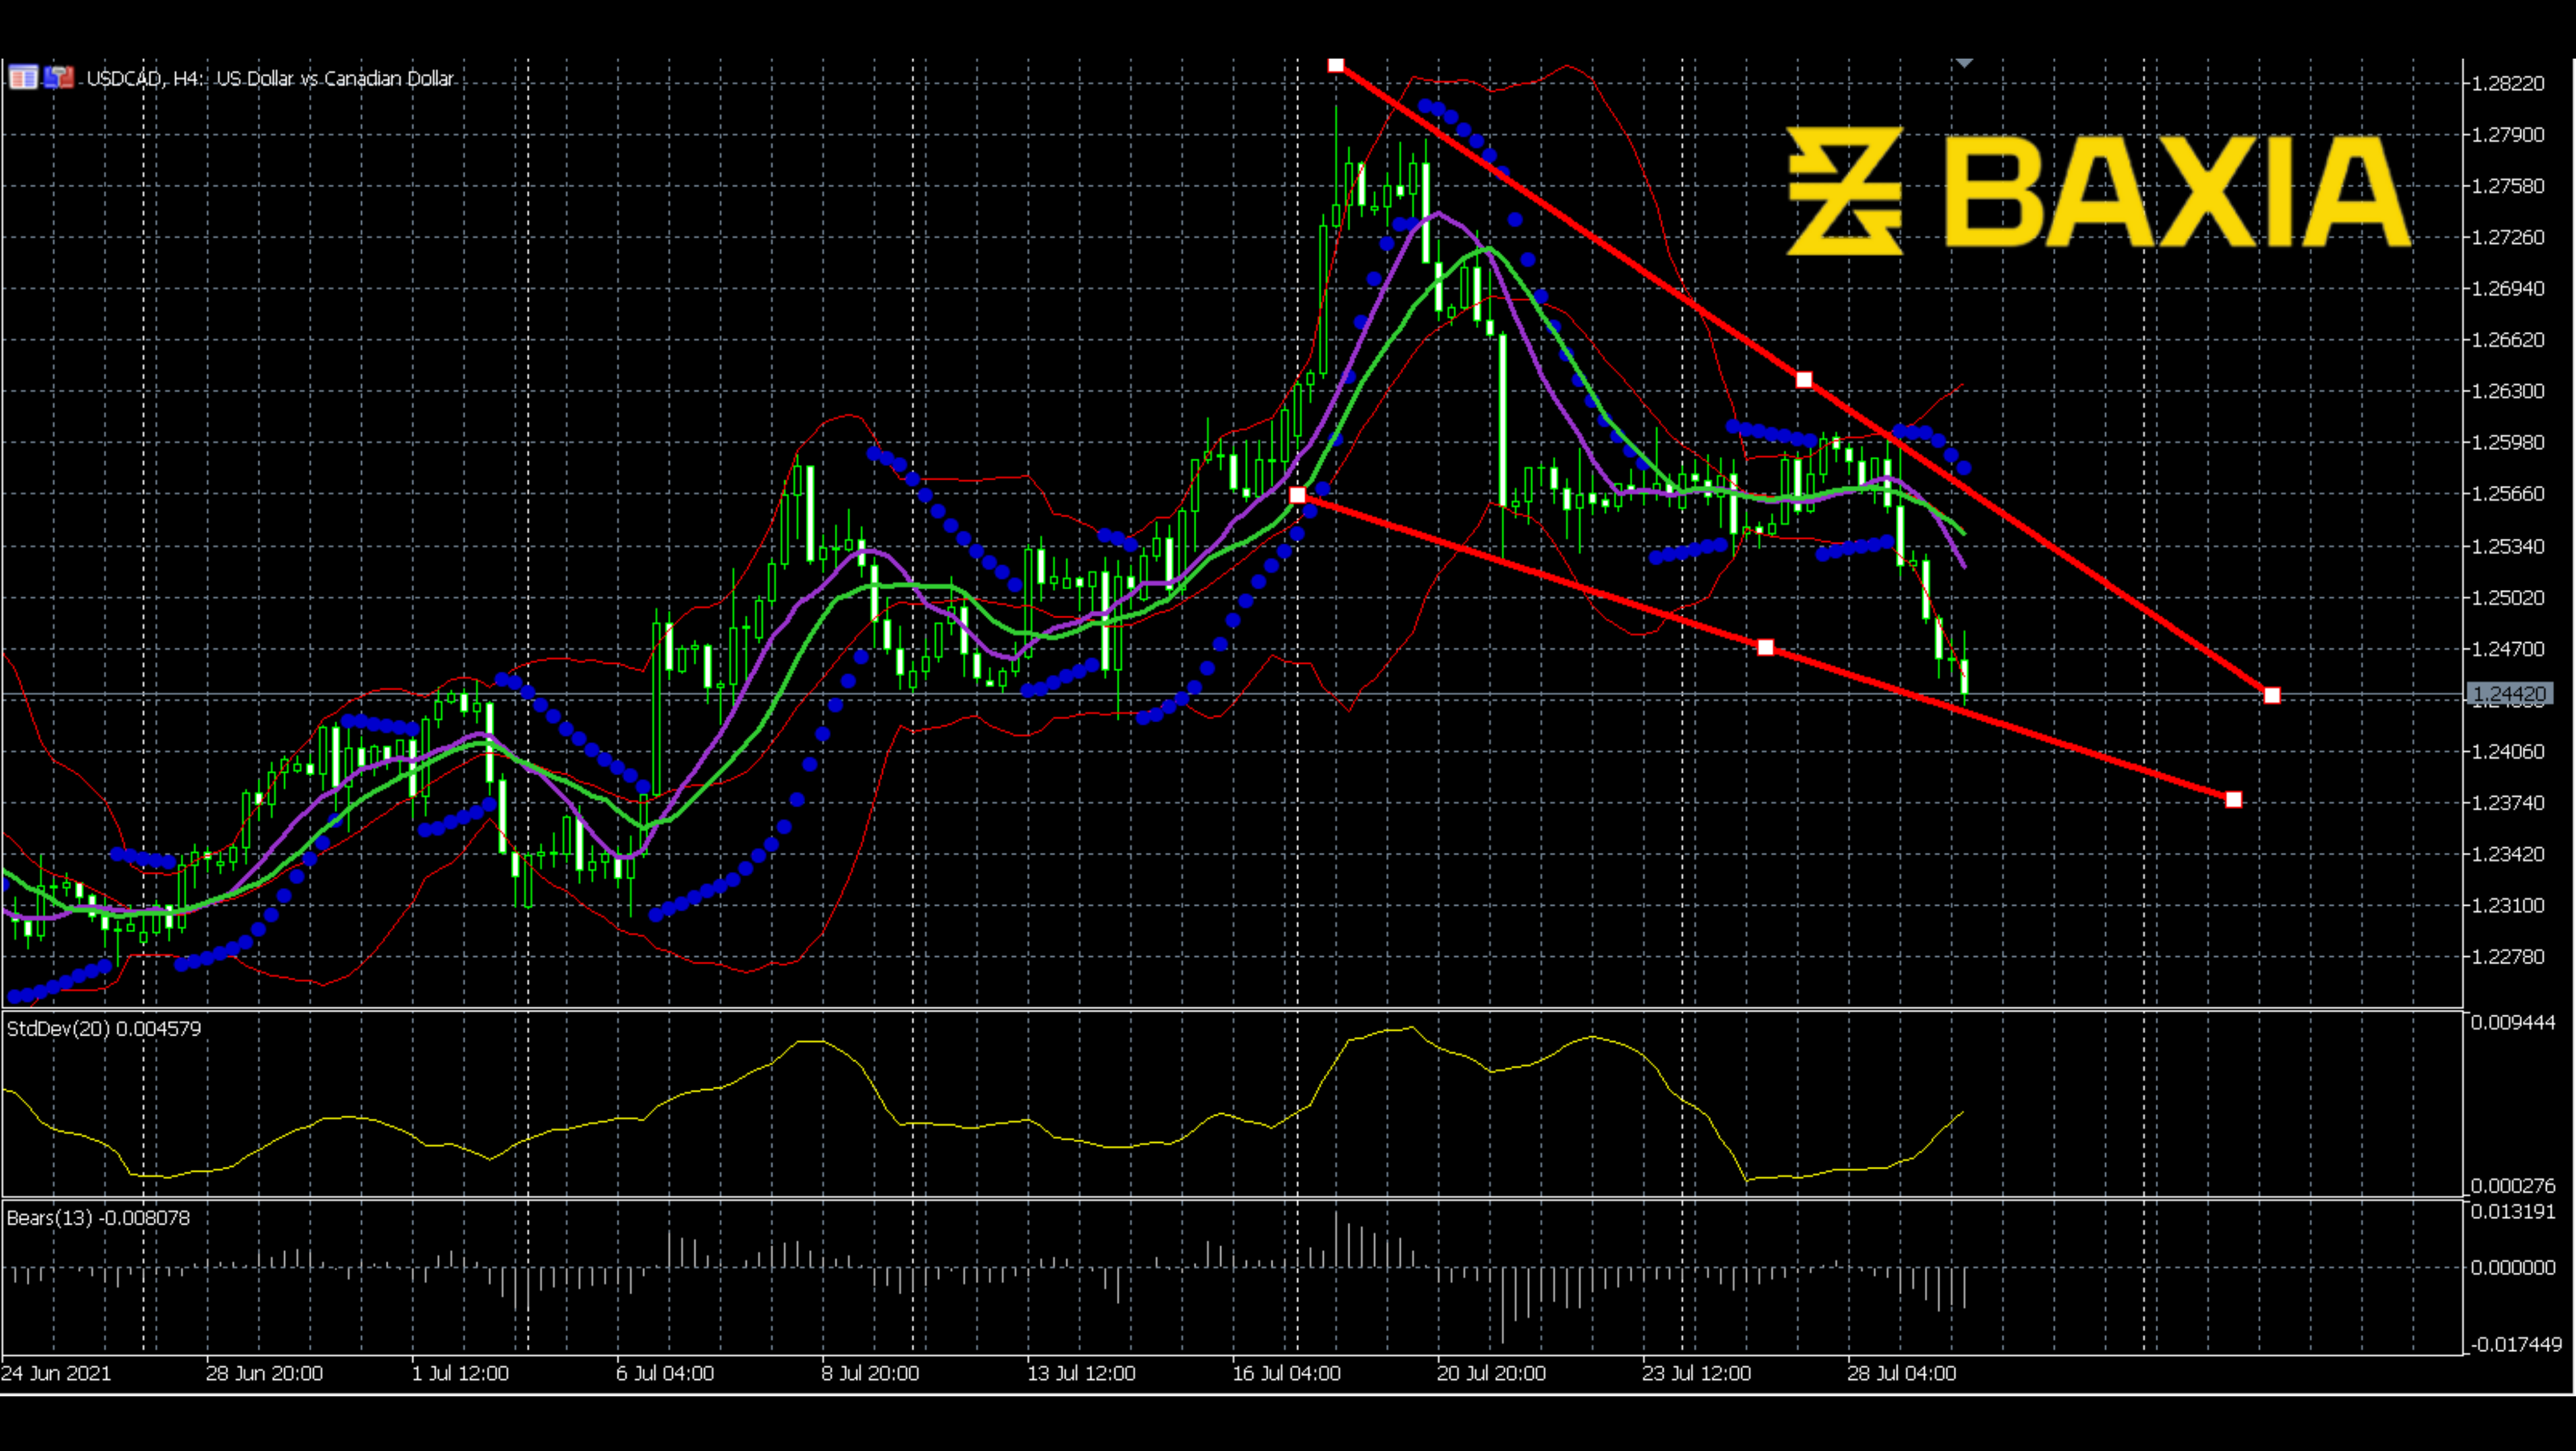
The second wave of the falling wadge started from an extreme Bollinger band shrinking; the price line broke down again, giving support pressure to the price. The standard deviation also goes up, which means the fluctuation has not stopped yet; the price still has room to go. The bulls power reached the bottom recently; a bounce-back may take place. Although the moving averages do now show bullish signals, they are lagging indicators.
We love to hear new ideas from traders and want to know what you think!
If you like this topic and want to suggest future topics that you find helpful, let us know by clicking the ‘submit your feedback’ button below.

Trading foreign exchange on margin carries a high level of risk, and may not be suitable for all investors. Before deciding to trade foreign exchange you should carefully consider your investment objectives, level of experience, and risk appetite.
Nothing contained in this website should be construed as investment advice. Any reference to an investment's past or potential performance is not, and should not be construed as, a recommendation or as a guarantee of any specific outcome or profit.