
The XRPUSD pair is currently undergoing a meticulous dance on the 4-hour time frame, with significant market signals hinting at a potential shift in its trajectory. In this analysis, we dissect the critical cues influencing XRPUSD's price action and explore the possibilities that lie ahead.
XRPUSD has encountered a formidable resistance zone ranging from 0.64681 to 0.63528, highlighted by an orange rectangle on the charts. A bearish engulfing candle, a potent reversal signal, emerged as the price approached this zone. This suggests a strong defense by sellers at these levels, warranting careful observation.
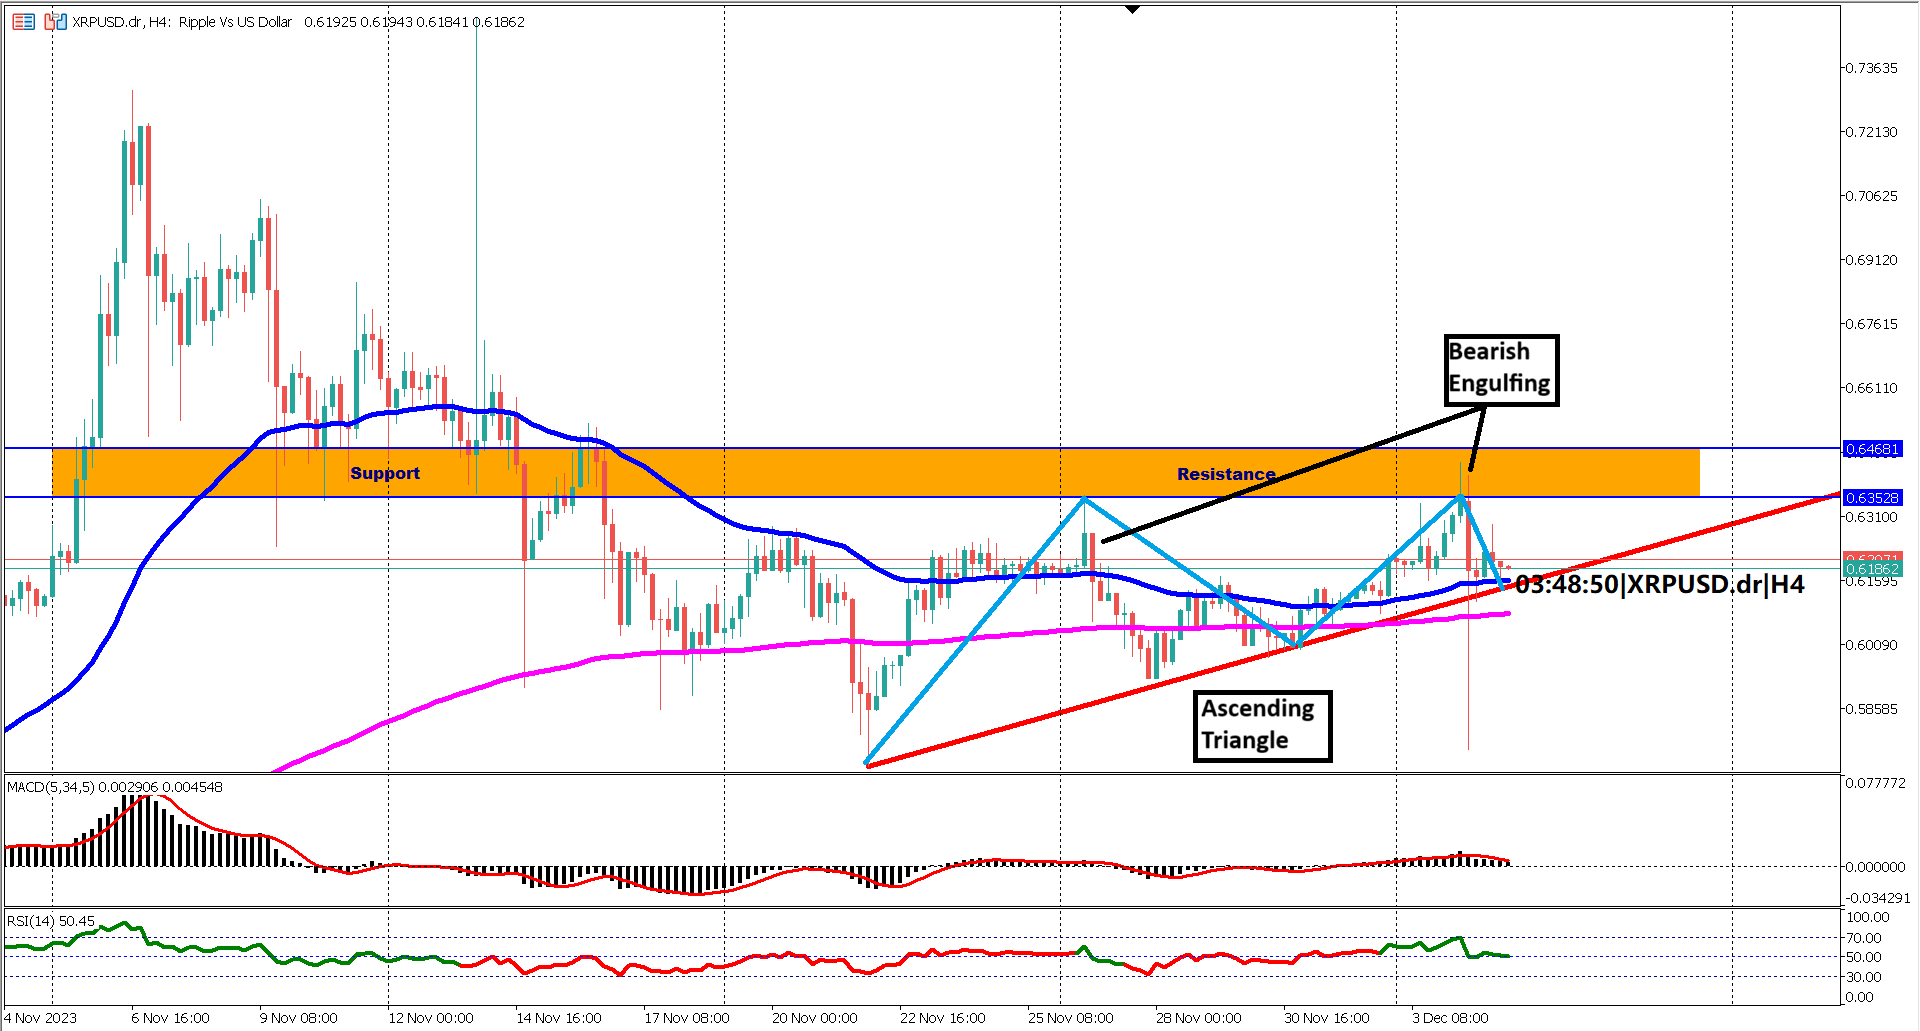
A closer look reveals the formation of an ascending triangle pattern, with the support advancing along the red ascending trendline. It's typically considered a bullish chart pattern, its significance is amplified in this context as XRPUSD has been in a short-term bearish trend since November 6th, 2023. Confirmation of a bullish reversal hinges on prices breaking above the key resistance level, while a breach of the ascending trendline could negate this pattern.
The Exponential Moving Averages (EMA) further add complexity to the analysis. While EMA 50 is currently above EMA 200, indicating ongoing bullish momentum, the narrowing range between the two suggests a potential weakening of the bullish trend. A panic selling could trigger a death cross on the EMA 50 & 200 which is a major bearish signal. Traders should closely monitor this convergence for insights into the market's strength.
The Relative Strength Index (RSI), an oscillator indicator, has dropped below the pivotal 50% level and is approaching 40%. A break below 40% could trigger panic selling and potentially lead to further declines. The RSI's behavior in the coming hours will provide valuable clues about market sentiment.
The Moving Average Convergence Divergence (MACD) oscillator signals a bullish correction, with both the signal line and histogram above the 0 line. However, caution is warranted as the histogram now resides below the signal line, indicating a nuanced market trend. Close attention is needed to discern whether the bullish correction will evolve into a sustained upward movement.
XRPUSD finds itself at a critical juncture, navigating between key resistance levels, bullish chart patterns, and oscillators reflecting both strength and caution. Traders and investors must remain vigilant, especially in the next 24-48 hours, as the RSI, MACD, and the battle at the resistance zone hold the keys to deciphering the cryptocurrency's next move. The market dynamics are in flux, and astute analysis and timely decisions will be paramount in navigating this intriguing phase of XRPUSD's journey.
Forecast -9.5% vs Previous -12.4%
Forecast 52% vs Previous 51.8%

Trading foreign exchange on margin carries a high level of risk, and may not be suitable for all investors. Before deciding to trade foreign exchange you should carefully consider your investment objectives, level of experience, and risk appetite.
Nothing contained in this website should be construed as investment advice. Any reference to an investment's past or potential performance is not, and should not be construed as, a recommendation or as a guarantee of any specific outcome or profit.