
EURUSD traders are closely watching today's key economic releases from the US, including the S&P Global US Manufacturing PMI, S&P Global Services PMI, and New Home Sales. Economists are forecasting improvements in the US economy. However, mixed results could suggest a weaker USD against the EUR.
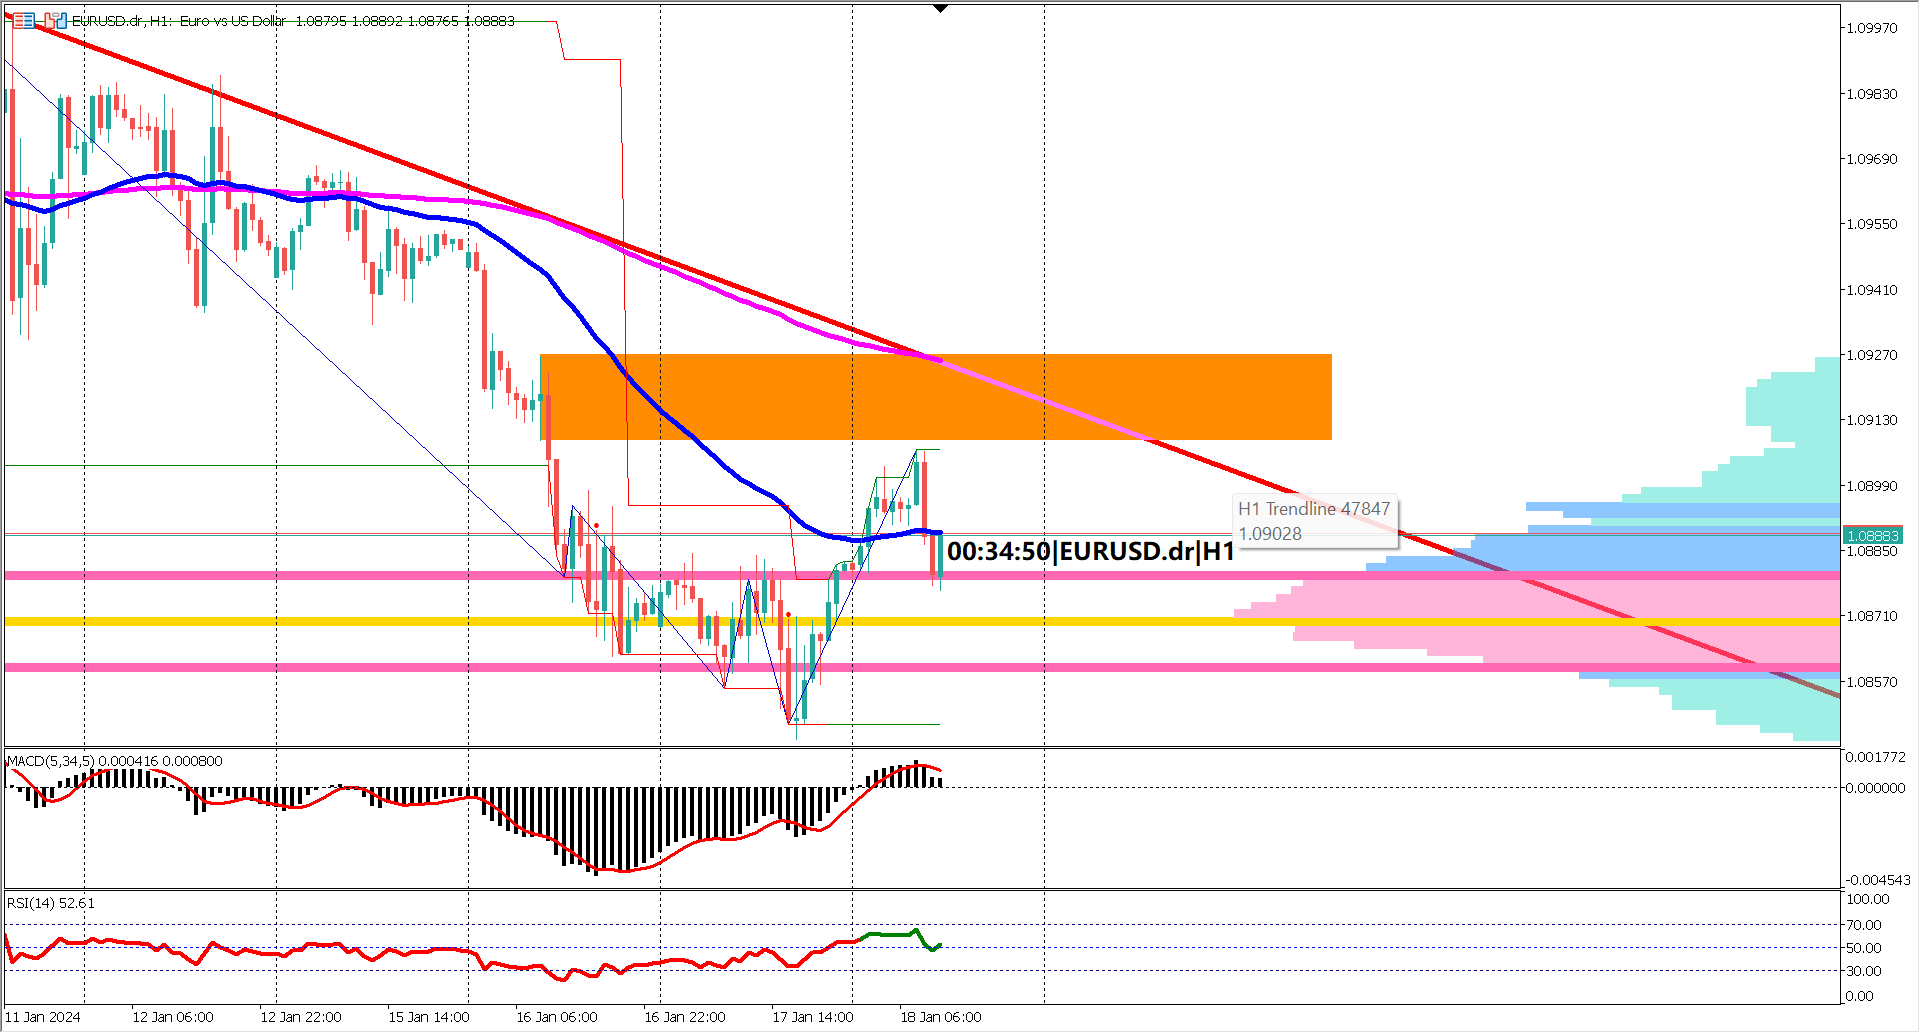
On the 1-hour timeframe, EURUSD has been trading in a sideways range for the last 6 to 7 trading days, forming a rectangle chart pattern with a range of 80 to 90 pips. A break above the upper side of this rectangle at 1.0690 could trigger a bullish reversal.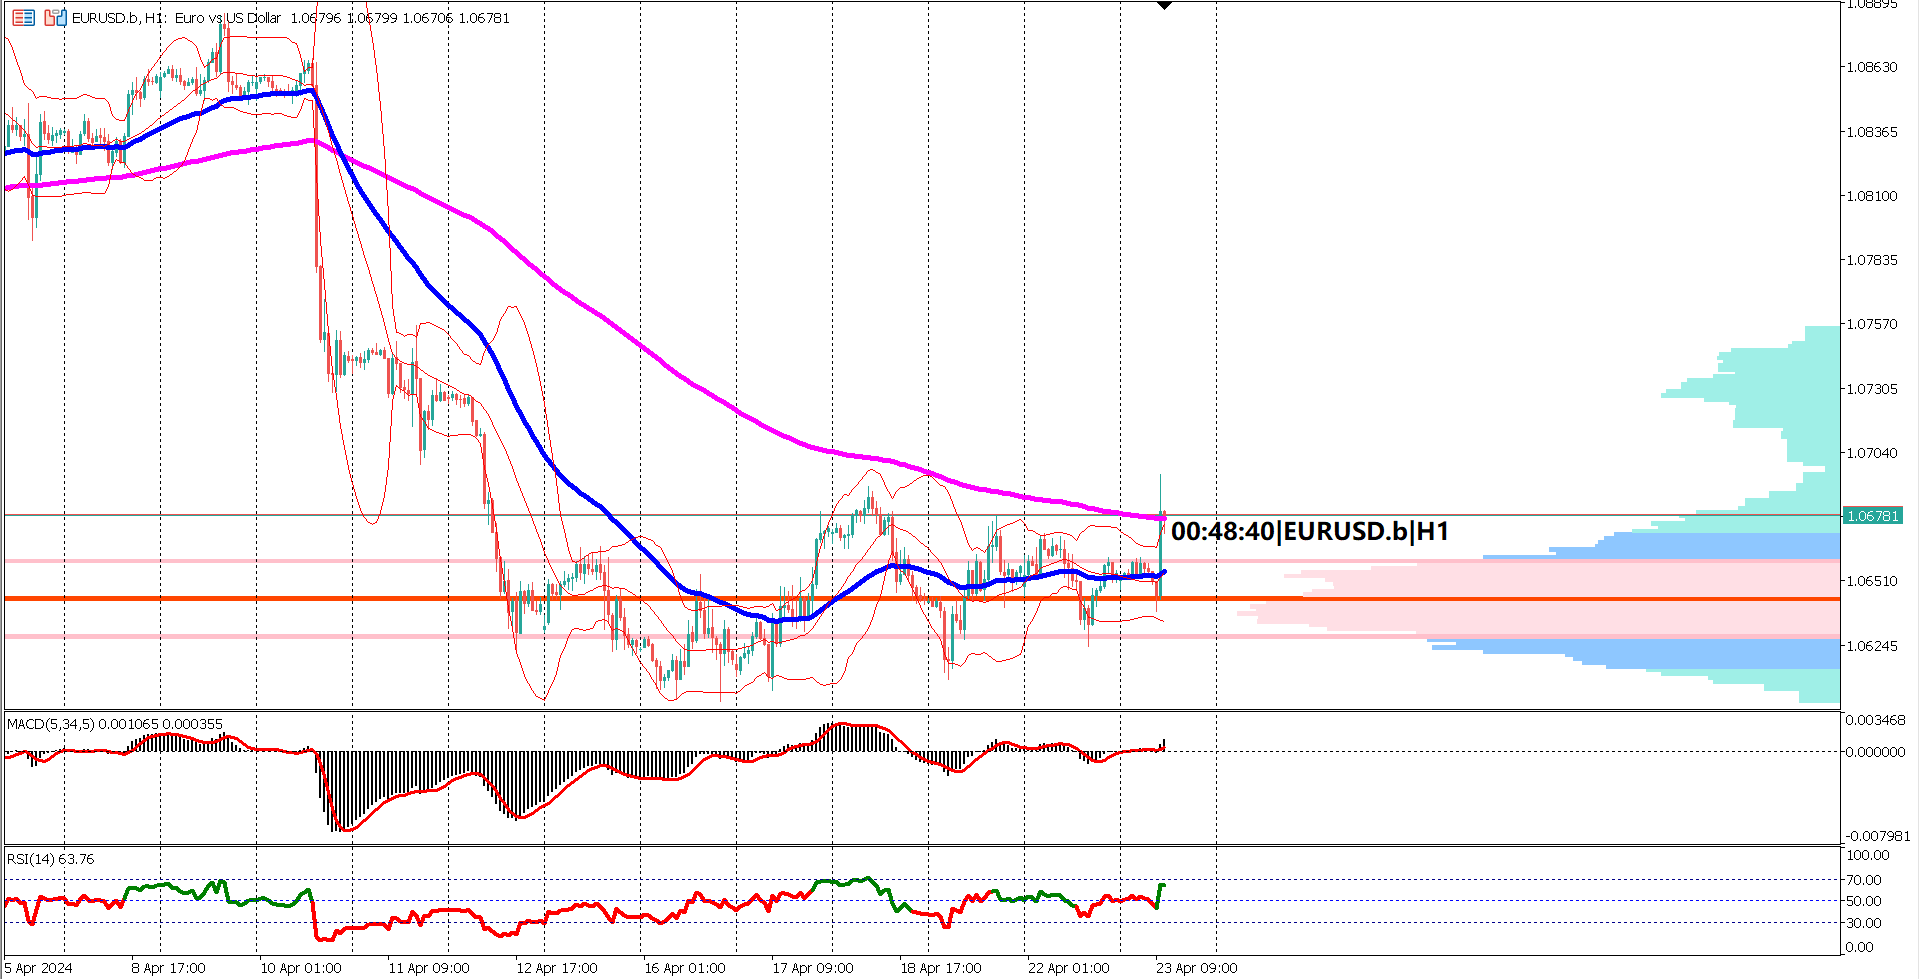
The EMA 50 is currently positioned below the EMA 200, signaling a bearish sentiment. However, the price is testing the EMA 200 as resistance. If this level doesn't hold, it may increase the likelihood of a break above the rectangle pattern. The bearish momentum appears to be slowing down as the distance between the EMA 50 and 200 narrows, with the EMA 50 pointing towards the EMA 200.
EURUSD is trading above the value area, marked by pink lines at 1.0660 and 1.0627, adding to the bullish signs.
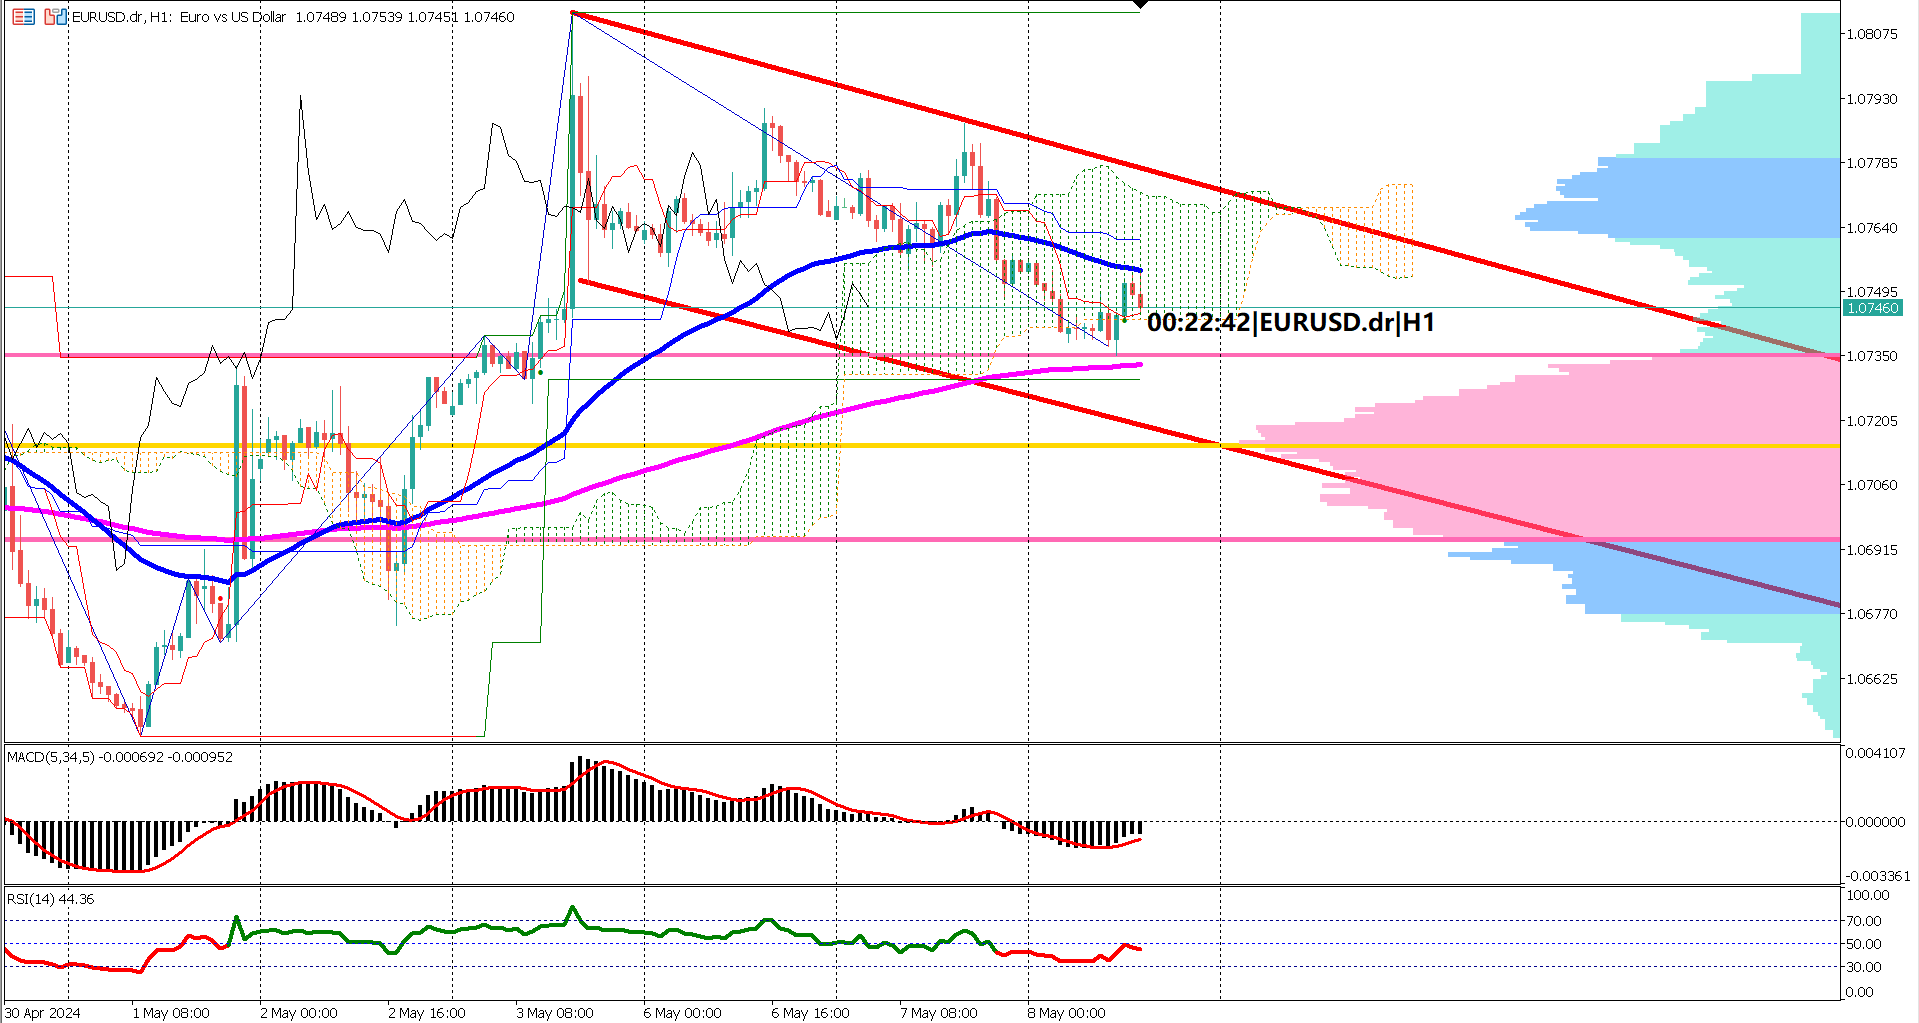
Both MACD and RSI indicators support a bullish sentiment. The MACD signal line is floating above the 0 line, while the RSI has broken above the 60% level, escaping the bearish zone. Overall, EURUSD is showing signs of a bullish reversal. A golden cross between the EMA 50 and 200 could confirm this bullish trend reversal.
In summary, EURUSD is eyeing a bullish reversal amid mixed US economic data and strong technical signals. Traders should monitor key support and resistance levels, as well as the upcoming economic releases, to navigate the current market conditions effectively. A break above the rectangle pattern and a golden cross between the EMA 50 and 200 could further confirm the bullish outlook for EURUSD.
Forecast 52.0 vs Previous 51.9
Forecast 52.0 vs Previous 51.7
Forecast 668K vs Previous 662K

Trading foreign exchange on margin carries a high level of risk, and may not be suitable for all investors. Before deciding to trade foreign exchange you should carefully consider your investment objectives, level of experience, and risk appetite.
Nothing contained in this website should be construed as investment advice. Any reference to an investment's past or potential performance is not, and should not be construed as, a recommendation or as a guarantee of any specific outcome or profit.