 During the Asian trading session, XRPUSD continued to climb, reaching new highs. However, towards the end of the session, the market underwent a correction. This correction found support during the European trading session, particularly on the mid-band of the Bollinger band, where a hammer candlestick pattern formed. The low of this hammer candlestick can be considered a key level of support, identified at 0.5594.
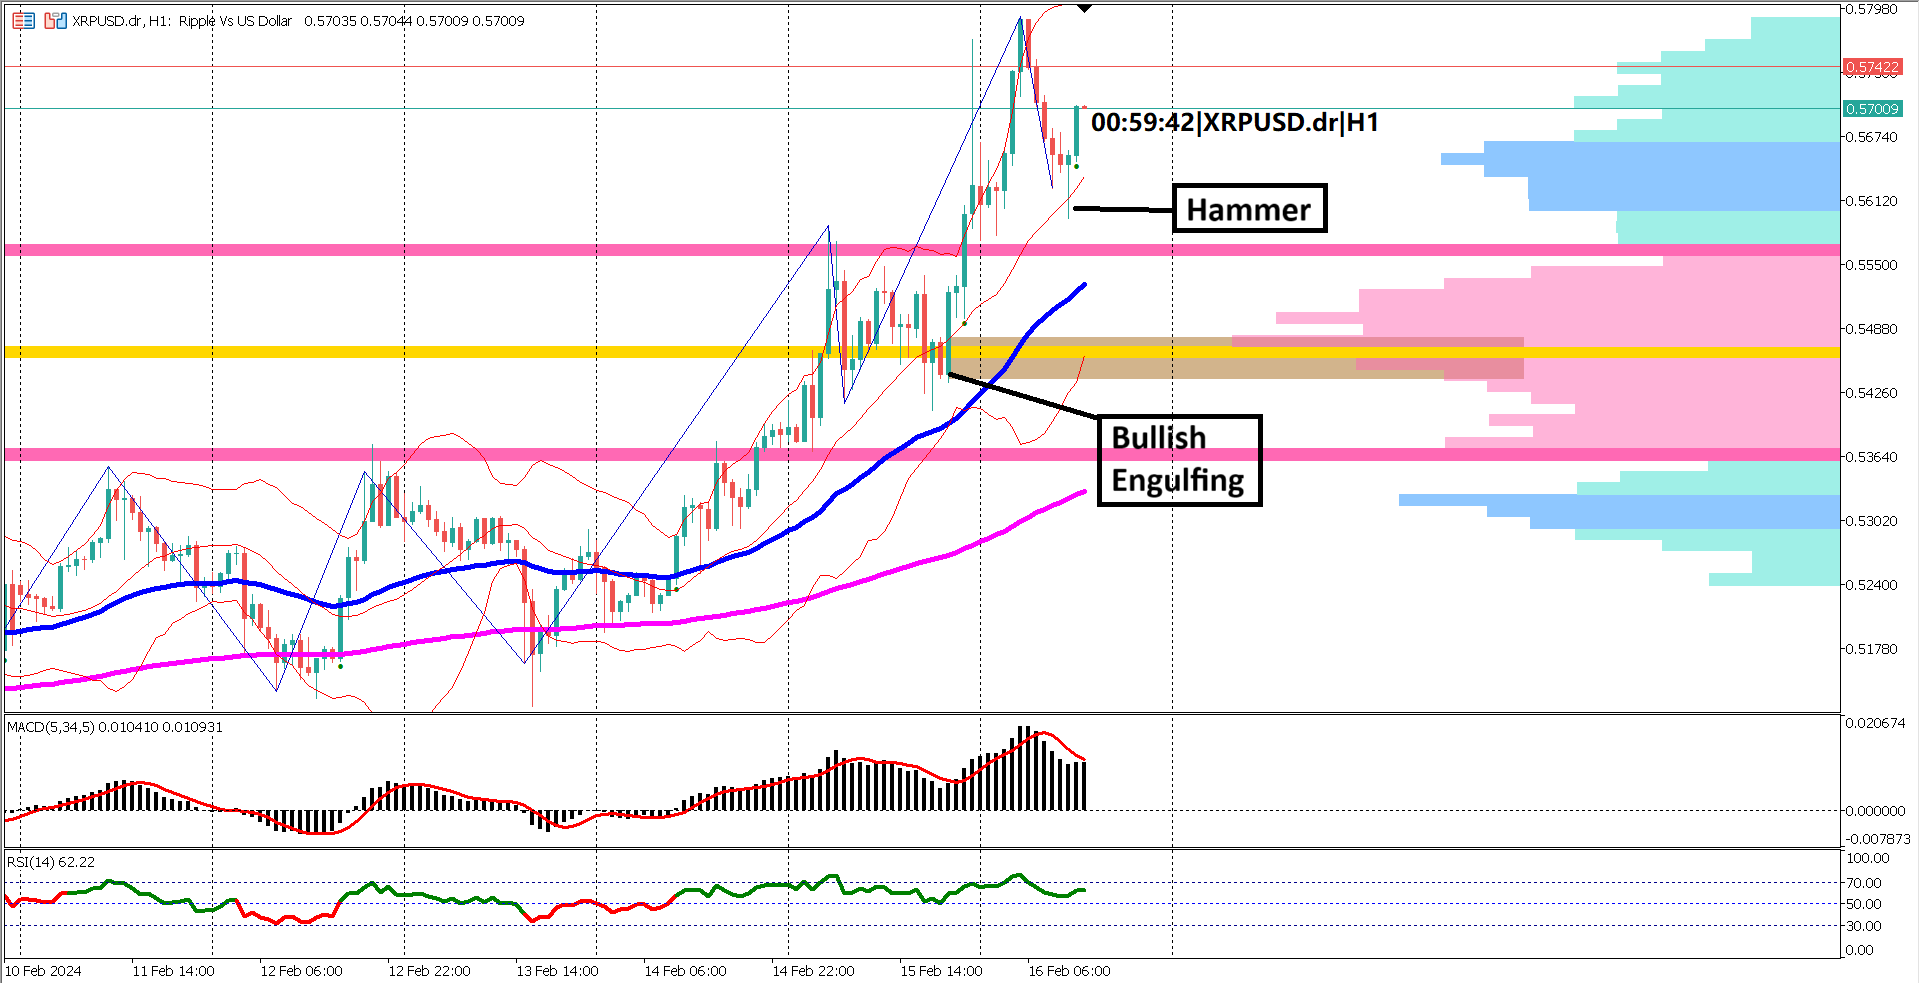
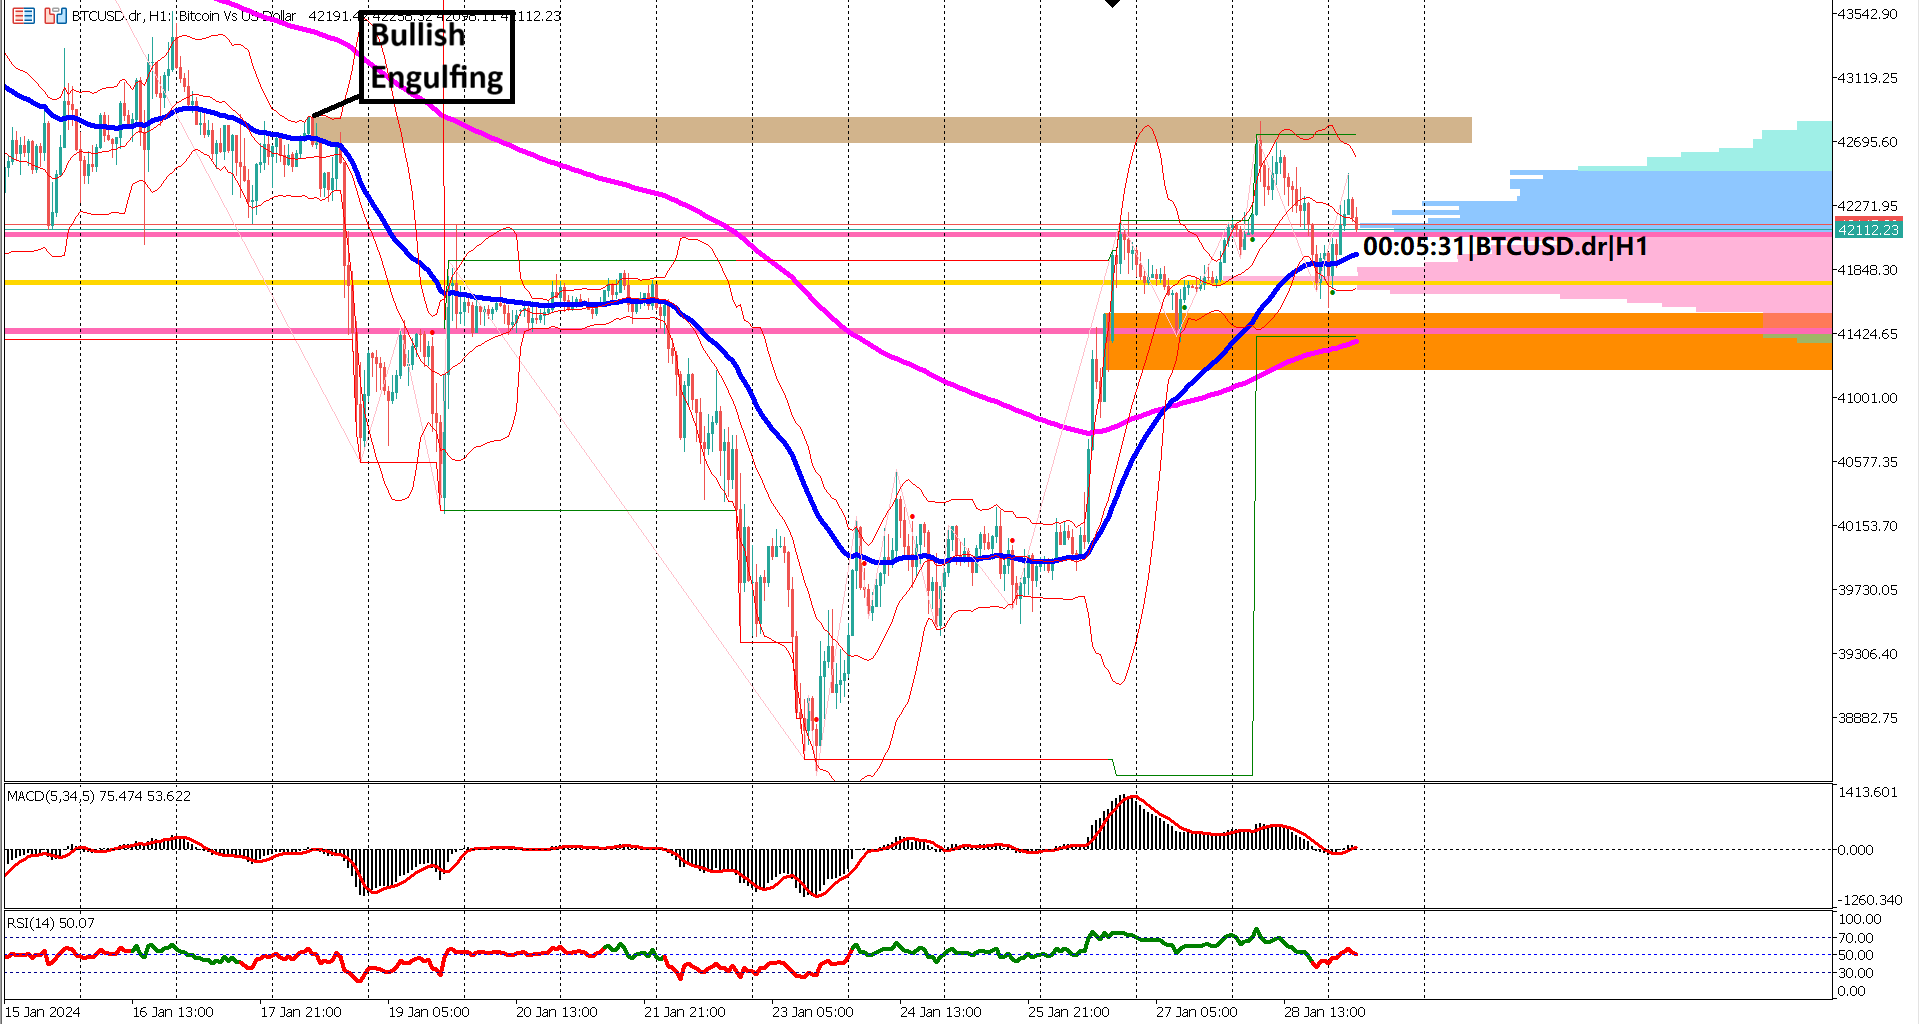
Technical indicators further support the bullish sentiment. Both the Exponential Moving Averages (EMA) 50 and 200 are trending upwards, with the distance between them widening. This indicates that the bullish momentum remains strong despite the correction towards the mid-band of the Bollinger band.
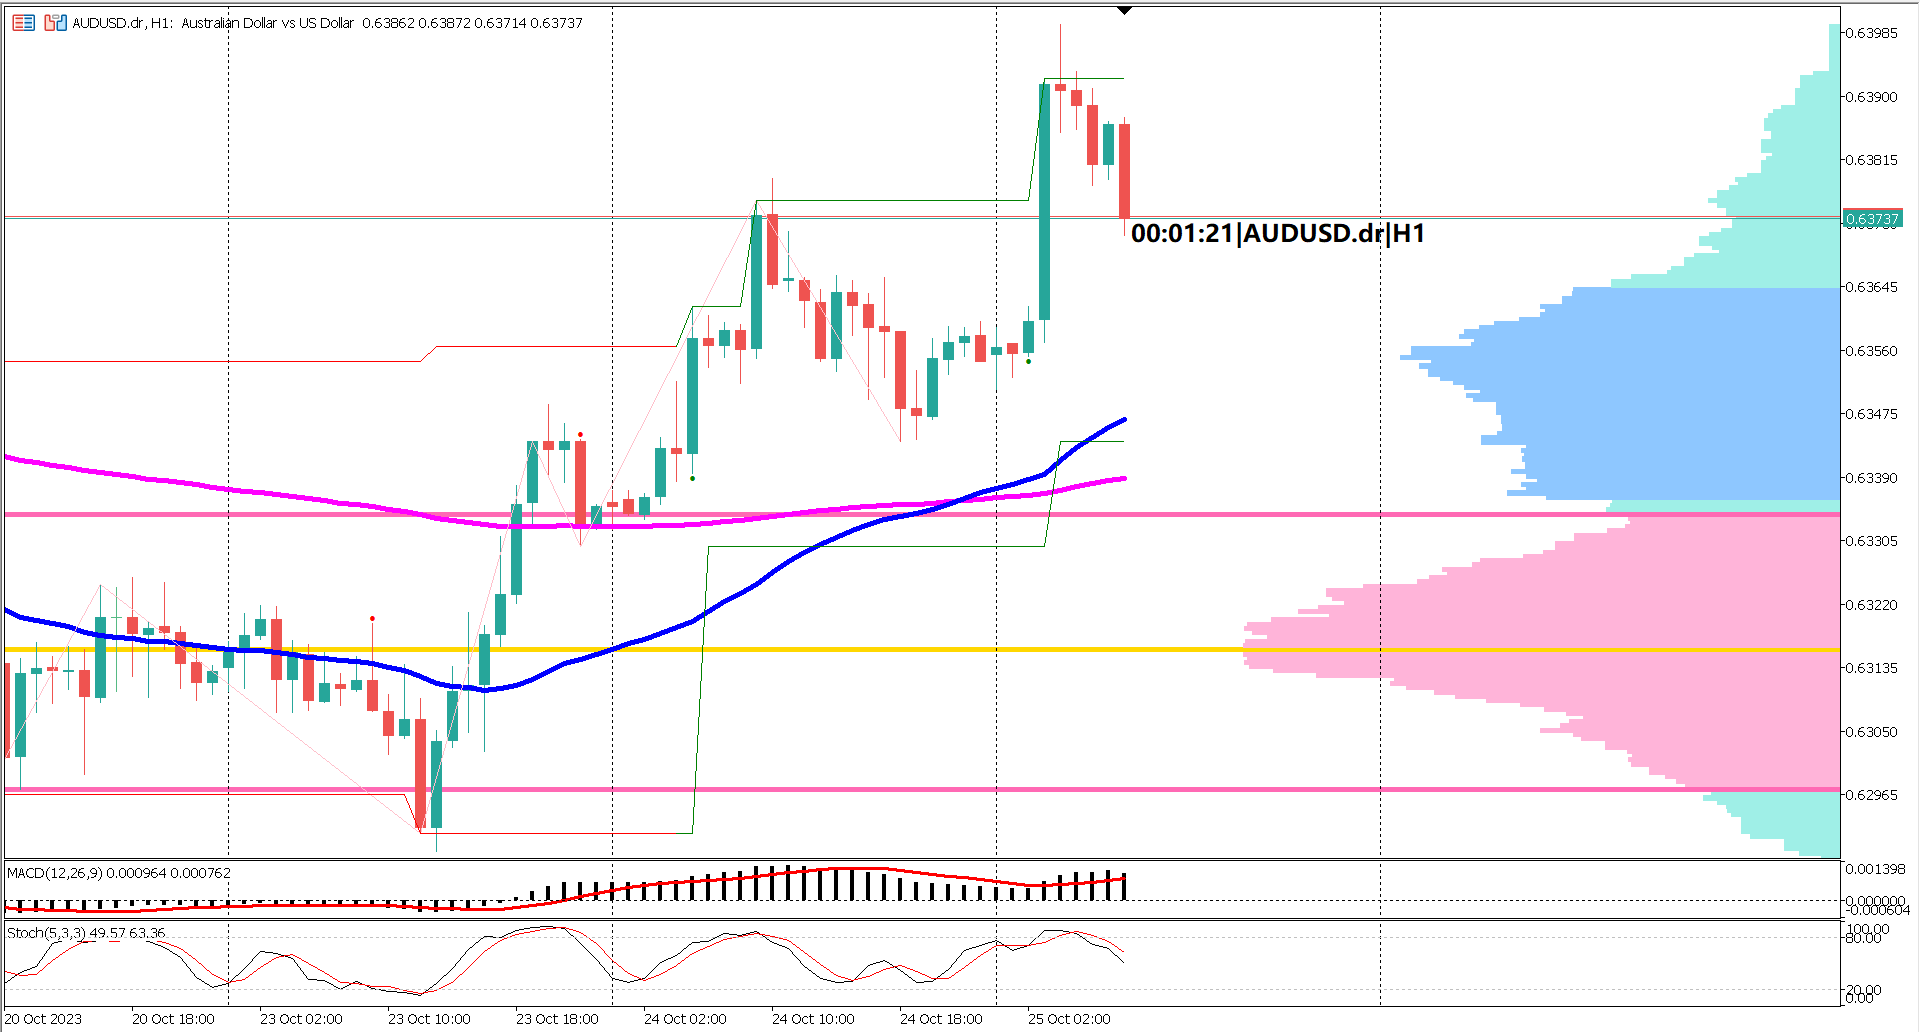
Additionally, the volume profile indicator reveals that prices are trading above the value area upper range, located at 0.5567. The lower side of the value area, marked by a pink horizontal line at 0.5364, serves as another key level of support.
Furthermore, traders are keeping a close eye on the bottom of the bullish engulfing candlestick pattern, which also serves as a significant level of support. A break below this bullish candlestick pattern could signal a retreat in bullish interest.
Oscillator indicators, such as the Moving Average Convergence Divergence (MACD) and Relative Strength Index (RSI), further confirm the bullish trend. The MACD signal line remains above the 0 line, while the RSI has consistently traded above the 40% level for the last 50 bars. Additionally, the MACD histogram indicates that momentum remains strong, with no signs of crossing below the 0 line.
Overall, the trend for XRPUSD is bullish, and the existing upward momentum may continue as long as the price remains above the upper bound of the volume profile's value area.
1. XRPUSD experienced a correction during the Asian trading session but found support during the European session.
2. Technical indicators, including EMAs, Bollinger bands, and volume profile, support the bullish sentiment.
3. Key levels of support include the mid-band of the Bollinger band, the value area lower range, and the bottom of the bullish engulfing candlestick pattern.
4. Oscillator indicators such as MACD and RSI confirm the bullish trend, with strong momentum.
5. The overall trend for XRPUSD is bullish, and traders should monitor key support levels for potential entry points in line with the upward momentum.
Actual 0.7% vs Forecast -1.6% vs Previous -2.1%
Actual 0.7% vs Forecast 1.5% vs Previous -3.3%
Forecast 1.509M vs Previous 1.493M
Forecast 0.1% vs Previous -0.1%

Trading foreign exchange on margin carries a high level of risk, and may not be suitable for all investors. Before deciding to trade foreign exchange you should carefully consider your investment objectives, level of experience, and risk appetite.
Nothing contained in this website should be construed as investment advice. Any reference to an investment's past or potential performance is not, and should not be construed as, a recommendation or as a guarantee of any specific outcome or profit.