 The recent dynamics in the XAU/USD market have been shaped by a variety of economic indicators and geopolitical factors. Let's delve into the key drivers influencing the price action of gold against the US Dollar.
The US Dollar has witnessed a resurgence, finding support amid diminishing expectations for an aggressive policy easing by the Federal Reserve. This shift in sentiment has pulled gold prices away from the two-week high reached in the previous session. Traders are closely monitoring the Fed's stance, as any hints of a change in interest rates can significantly impact the precious metal.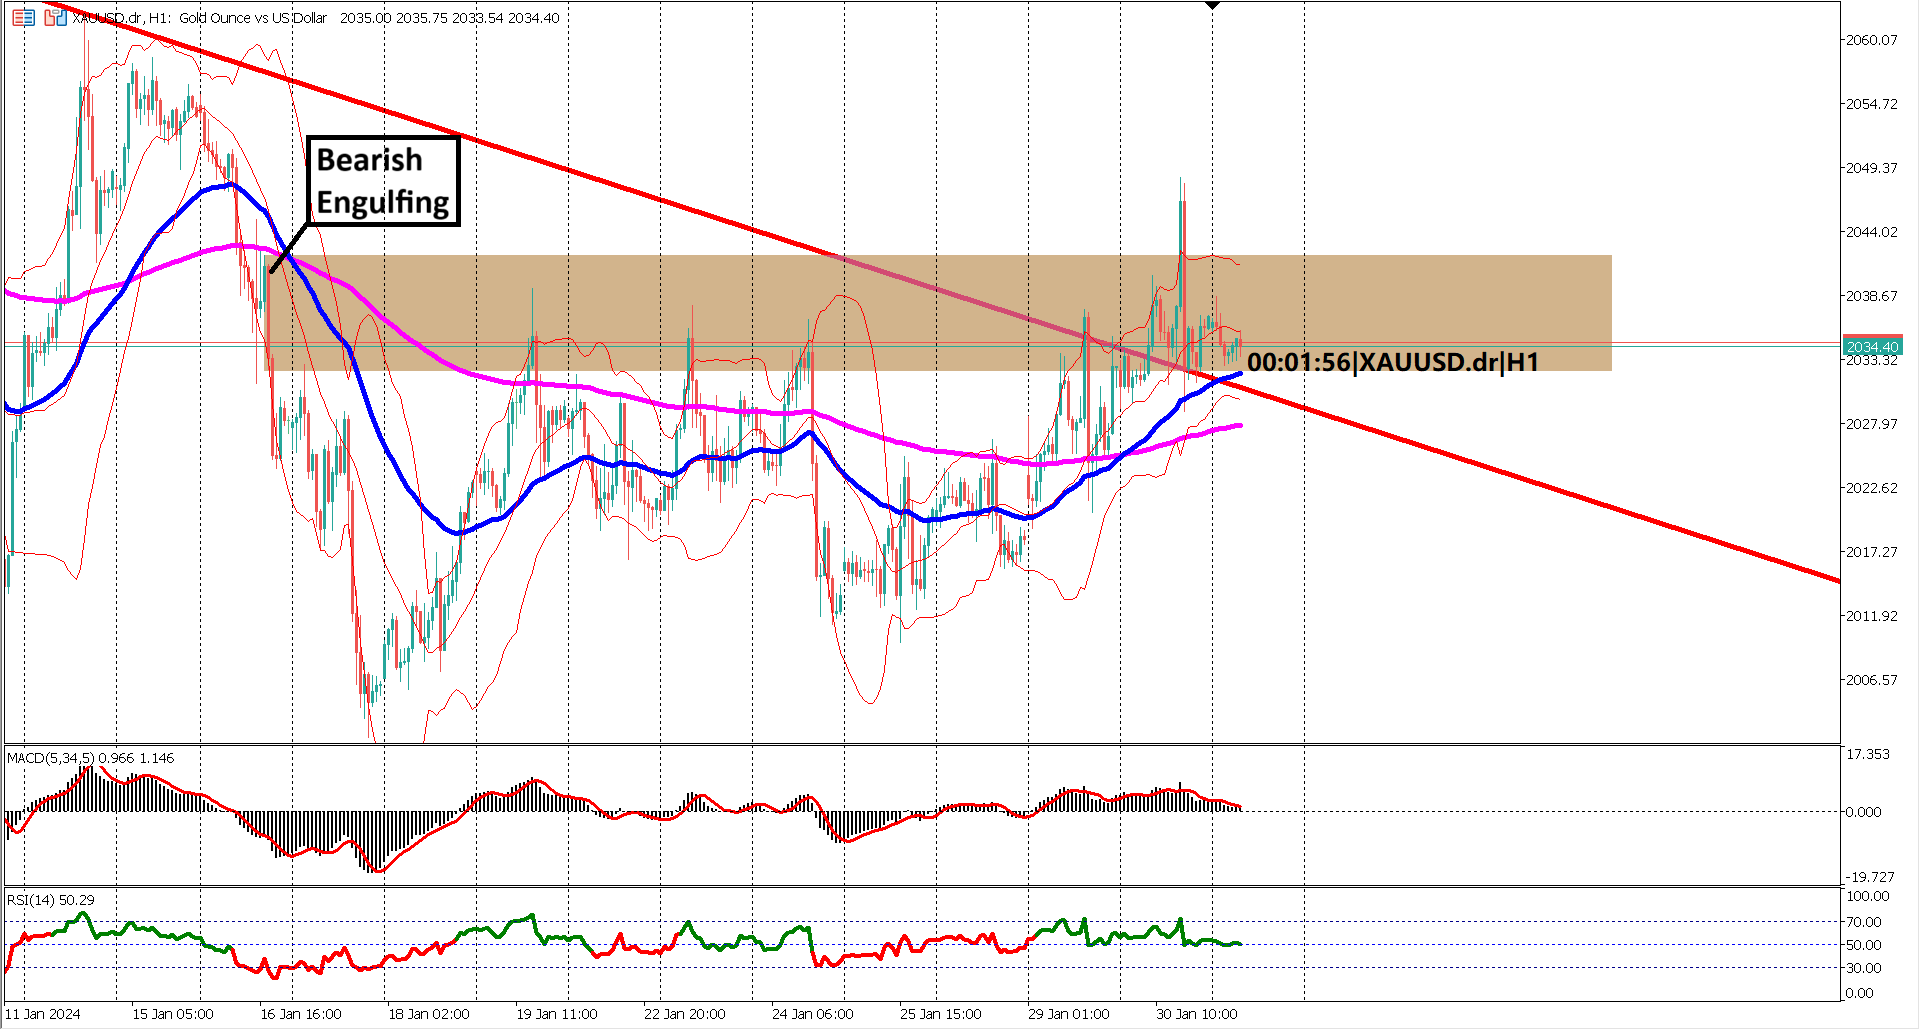
The Job Openings and Labor Turnover Survey (JOLTS) report, published by the Bureau of Labor Statistics, revealed an unexpected increase in US job openings to 9.02 million in December. This positive labor market data contributes to the strengthening of the US Dollar, exerting downward pressure on gold prices.
The Conference Board's US Consumer Confidence Index displayed a robust improvement, reaching its highest level since December 2021 at 114.8 in January. This positive consumer sentiment aligns with the International Monetary Fund's upgraded forecast for US economic growth in 2024 to 2.1%, signaling a favorable environment for the Fed to consider rate hikes.
Despite the upbeat economic indicators, certain factors continue to support gold. The yield on the 10-year US government bond hovers near the 4.0% threshold, creating a supportive backdrop for non-yielding assets like gold. Additionally, geopolitical risks and China's economic challenges contribute to the appeal of the precious metal as a safe-haven asset.
China's economic data, including the Manufacturing PMI remaining in contraction territory, underscores global economic concerns. However, a rise in the Non-Manufacturing PMI mitigates the impact and demonstrates resilience in certain sectors.
As investors await the Federal Open Market Committee (FOMC) policy decision, gold's future trajectory will largely depend on cues about potential interest rate cuts. Traders will closely follow the release of the ADP report on private-sector employment and Chicago PMI for further insights.
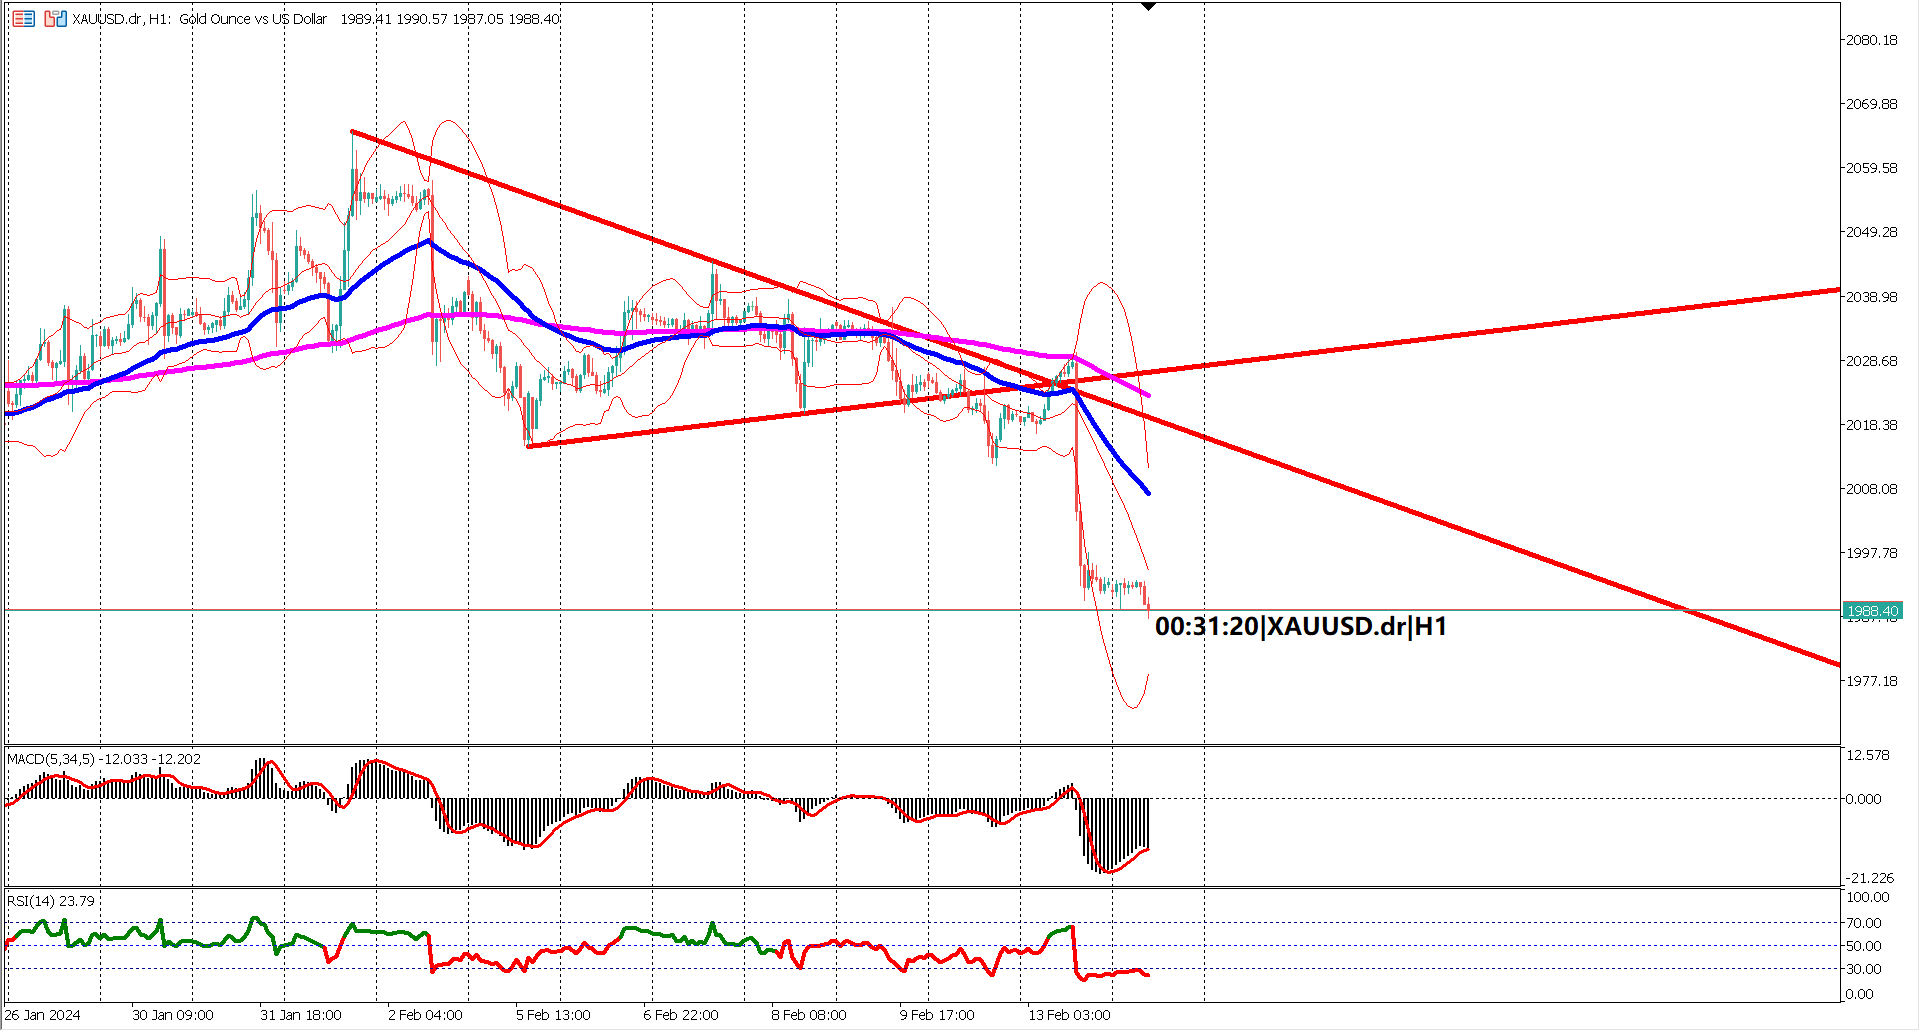
Examining the 1-hour timeframe chart, we observed a decisive break above the previously restraining descending red-colored trendline. This breakout, coupled with a breach of a key resistance level at $2042, marked a significant shift in market sentiment. The breakout was not without its challenges, as prices retraced immediately after the initial surge, testing the support provided by the former diagonal resistance, now turned into a support line. This kind of retest is a common occurrence in technical analysis, adding confirmation to the validity of the breakout.
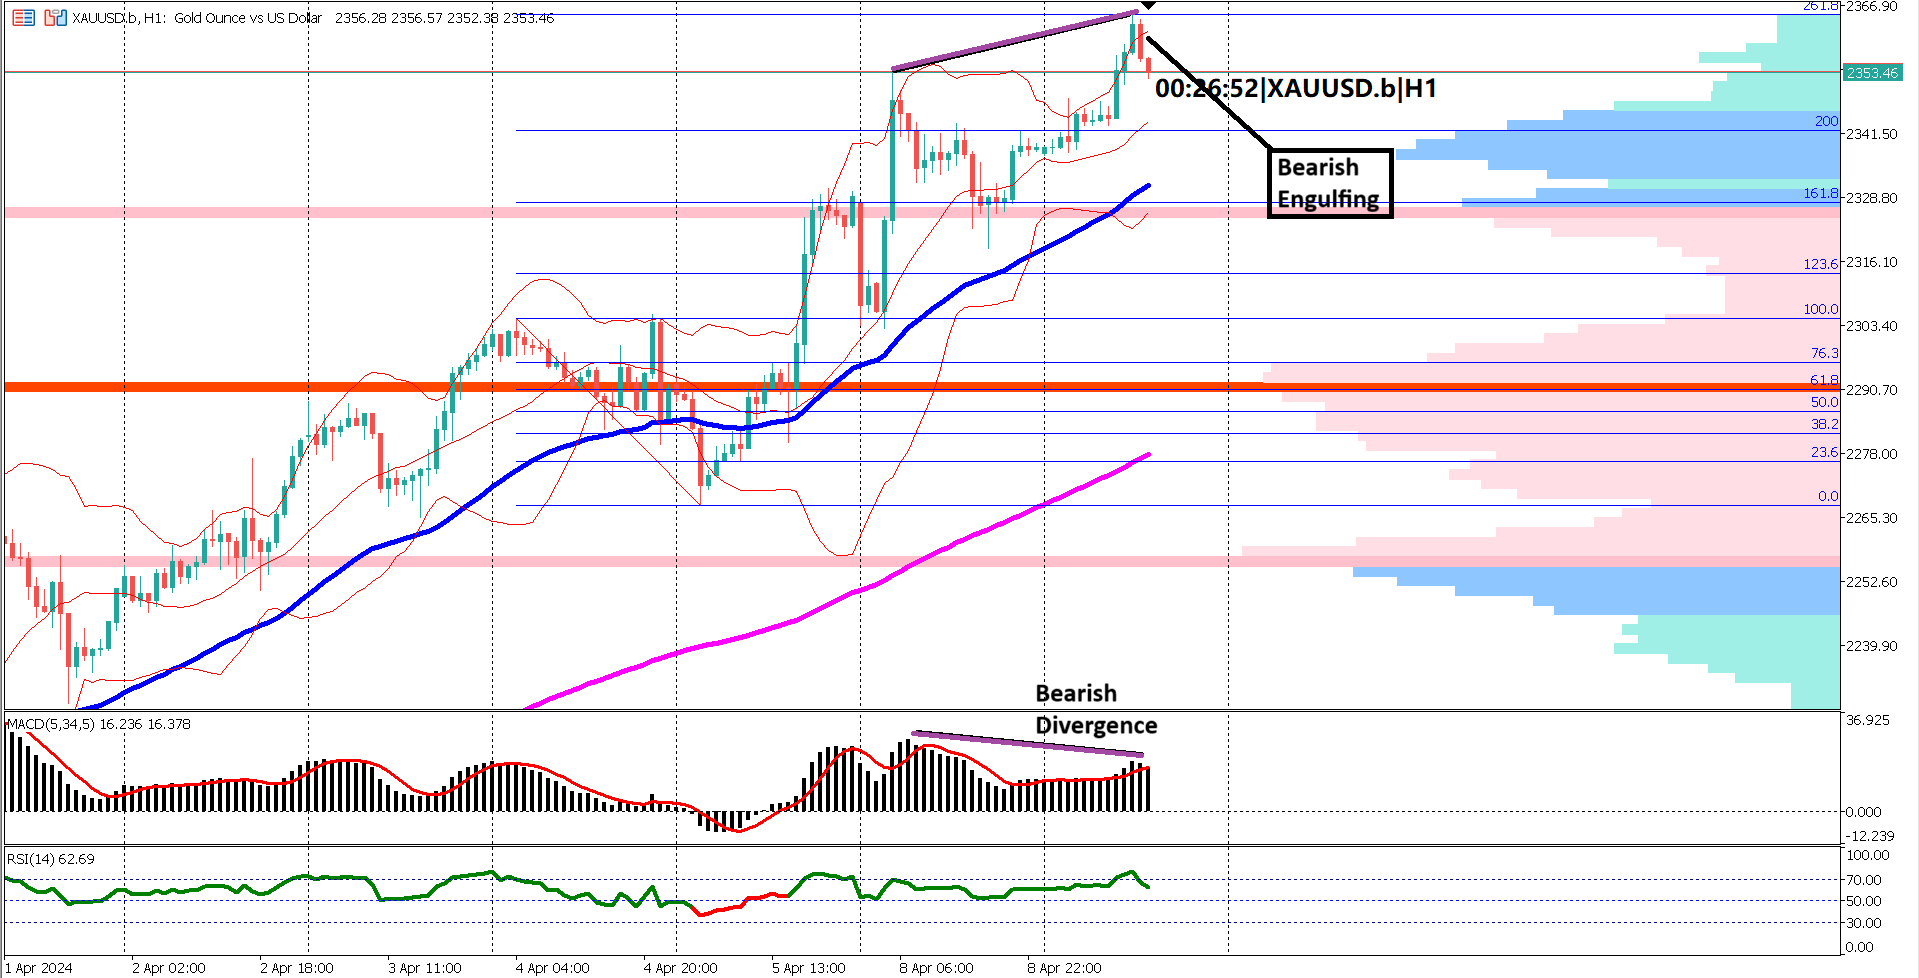
A critical level in this context is the $2042 resistance, identified from a bearish engulfing candlestick pattern that materialized on January 15th, 2024. The subsequent attempts to breach this level from January 18th to 24th further affirm its significance. The ability of prices to persistently test this level implies its crucial role in dictating market movements.
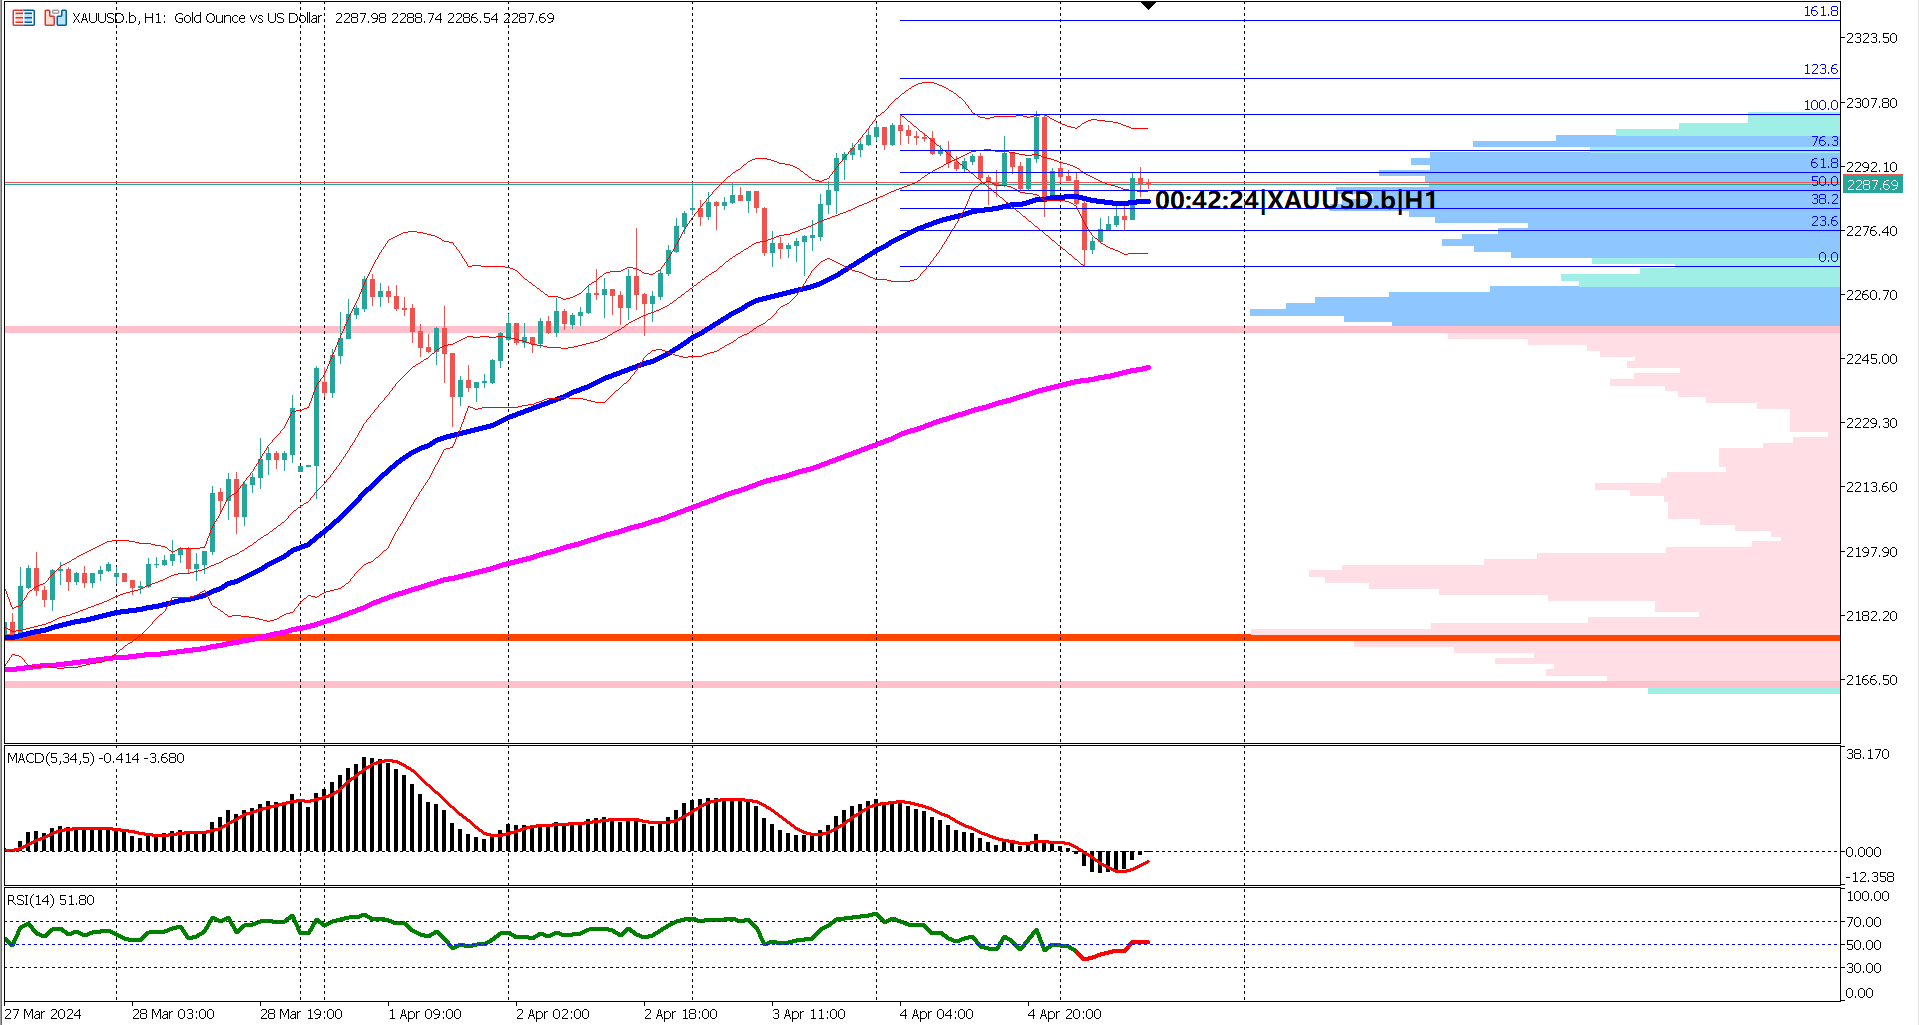
The emergence of a golden cross, where the Exponential Moving Average (EMA) 50 crosses above the EMA 200, amplifies the bullish momentum. This crossover signals a shift in the prevailing trend, indicating a potential continuation of the upward trajectory. The expanding/diverging nature of both EMAs further supports the notion of growing bullish momentum.
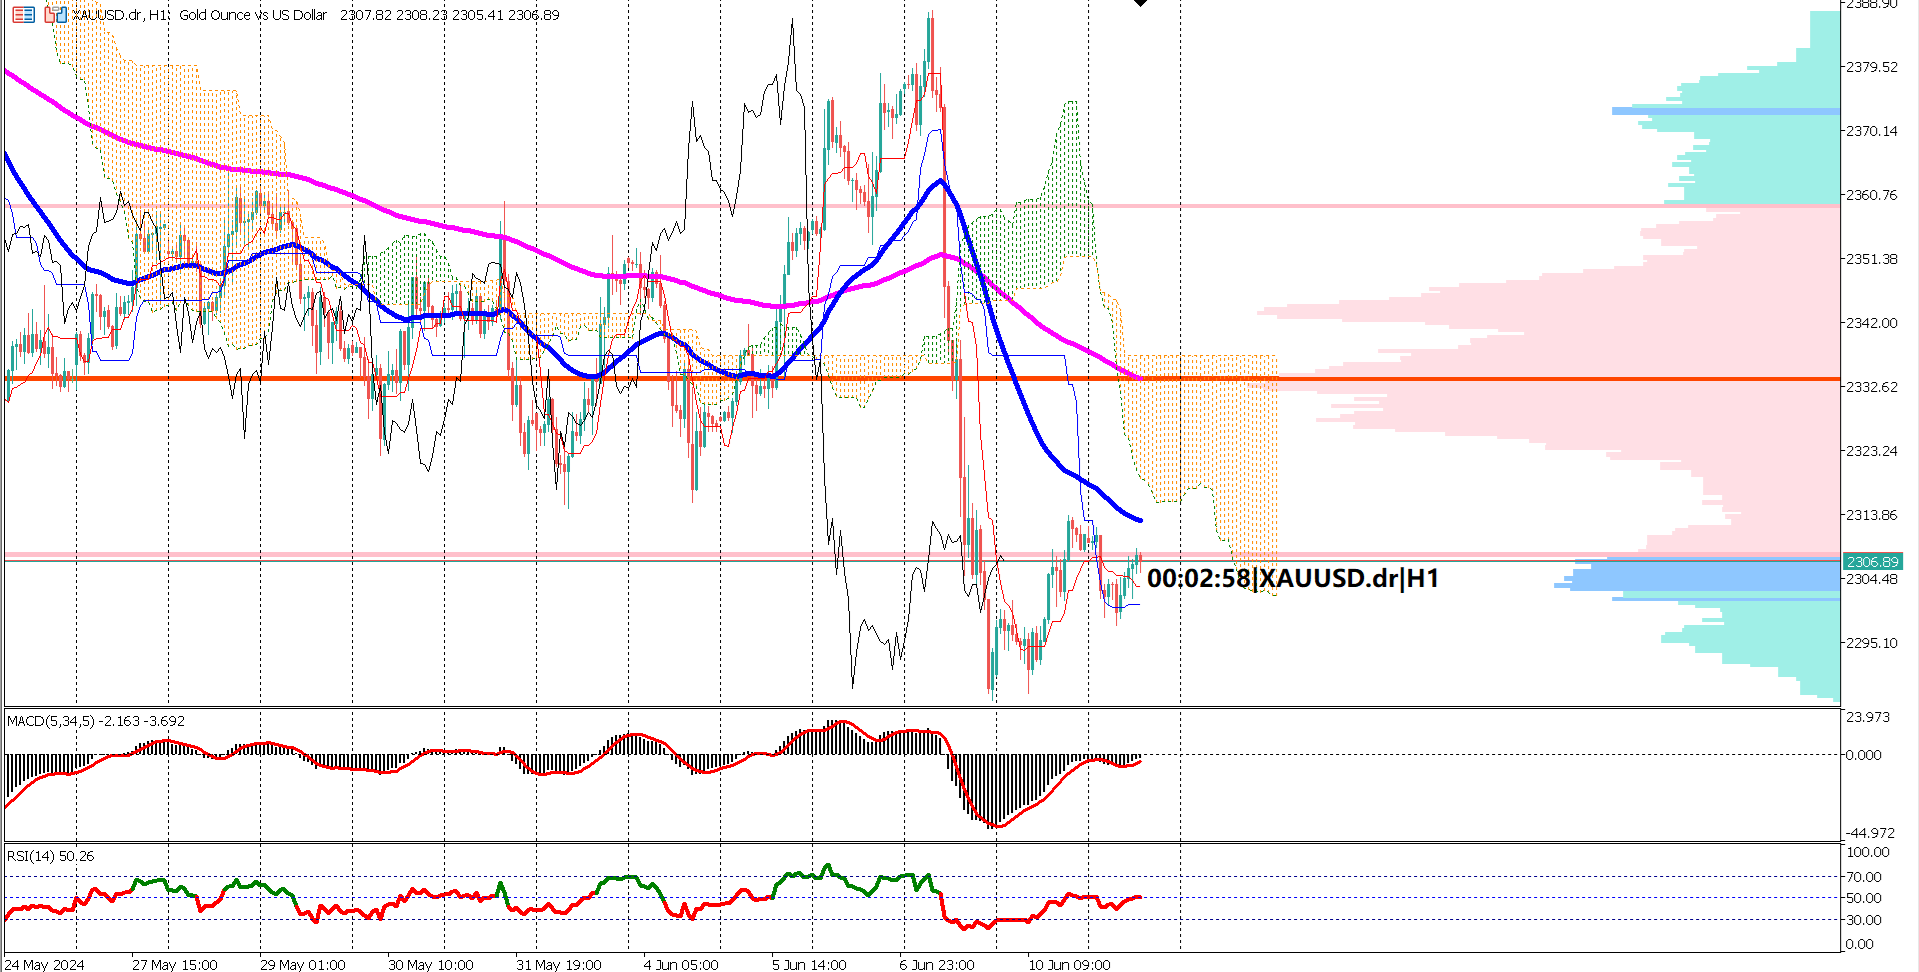
Now, let's focus on the technical oscillators that provide additional insights into market conditions. The Moving Average Convergence Divergence (MACD) indicator, a versatile tool for identifying trend direction and momentum, has been crucial in this analysis. Both the MACD signal line and histogram broke below the 0 level, signaling a bearish phase. However, the subsequent oscillation between negative and positive values suggests a non-trending or consolidating market.
Turning our attention to the Relative Strength Index (RSI), an oscillator measuring the speed and change of price movements, we find it hovering below the 50% level. This indicates a lack of strong bullish momentum, and despite remaining above the crucial 40% threshold, it has struggled to breach the 60% mark in the last 24 hours. This persistent stay below 60% suggests a potential struggle for the bulls to establish dominance.
In conclusion, XAU/USD is navigating through a complex landscape influenced by economic data, geopolitical events, and technical patterns. The technical landscape for XAU/USD reveals a complex interplay of factors. The breakout above the descending trendline and $2042 resistance, supported by a golden cross, signifies a potential shift towards a sustained bullish trend. However, oscillators like MACD and RSI suggest caution, indicating a need for a thorough evaluation of multiple indicators before making informed trading decisions.
Forecast 0.2% vs Previous 0.1%
Forecast 145K vs Previous 164K
Forecast 48.0 vs Previous 46.9

Trading foreign exchange on margin carries a high level of risk, and may not be suitable for all investors. Before deciding to trade foreign exchange you should carefully consider your investment objectives, level of experience, and risk appetite.
Nothing contained in this website should be construed as investment advice. Any reference to an investment's past or potential performance is not, and should not be construed as, a recommendation or as a guarantee of any specific outcome or profit.