
In the intricate dance of global currencies, GBPUSD finds itself at the center stage, influenced by recent developments in both the Federal Reserve and the Bank of England. The cautious tone set by Fed Chair Jerome Powell on Friday reverberated through the markets, as he acknowledged the impact of US monetary policy on the economy. Despite highlighting the Fed's readiness to take further tightening measures if needed, the prevailing sentiment leans towards the completion of the rate-hike cycle, casting a shadow on the Greenback.
On the British front, Bank of England Governor Andrew Bailey's commitment to achieving the 2% inflation objective echoes the determination to navigate economic challenges. The UK S&P Global/CIPS Manufacturing PMI's rise to 47.2 in November brings a glimmer of positivity, surpassing October's 46.7 and beating the market consensus of 46.6.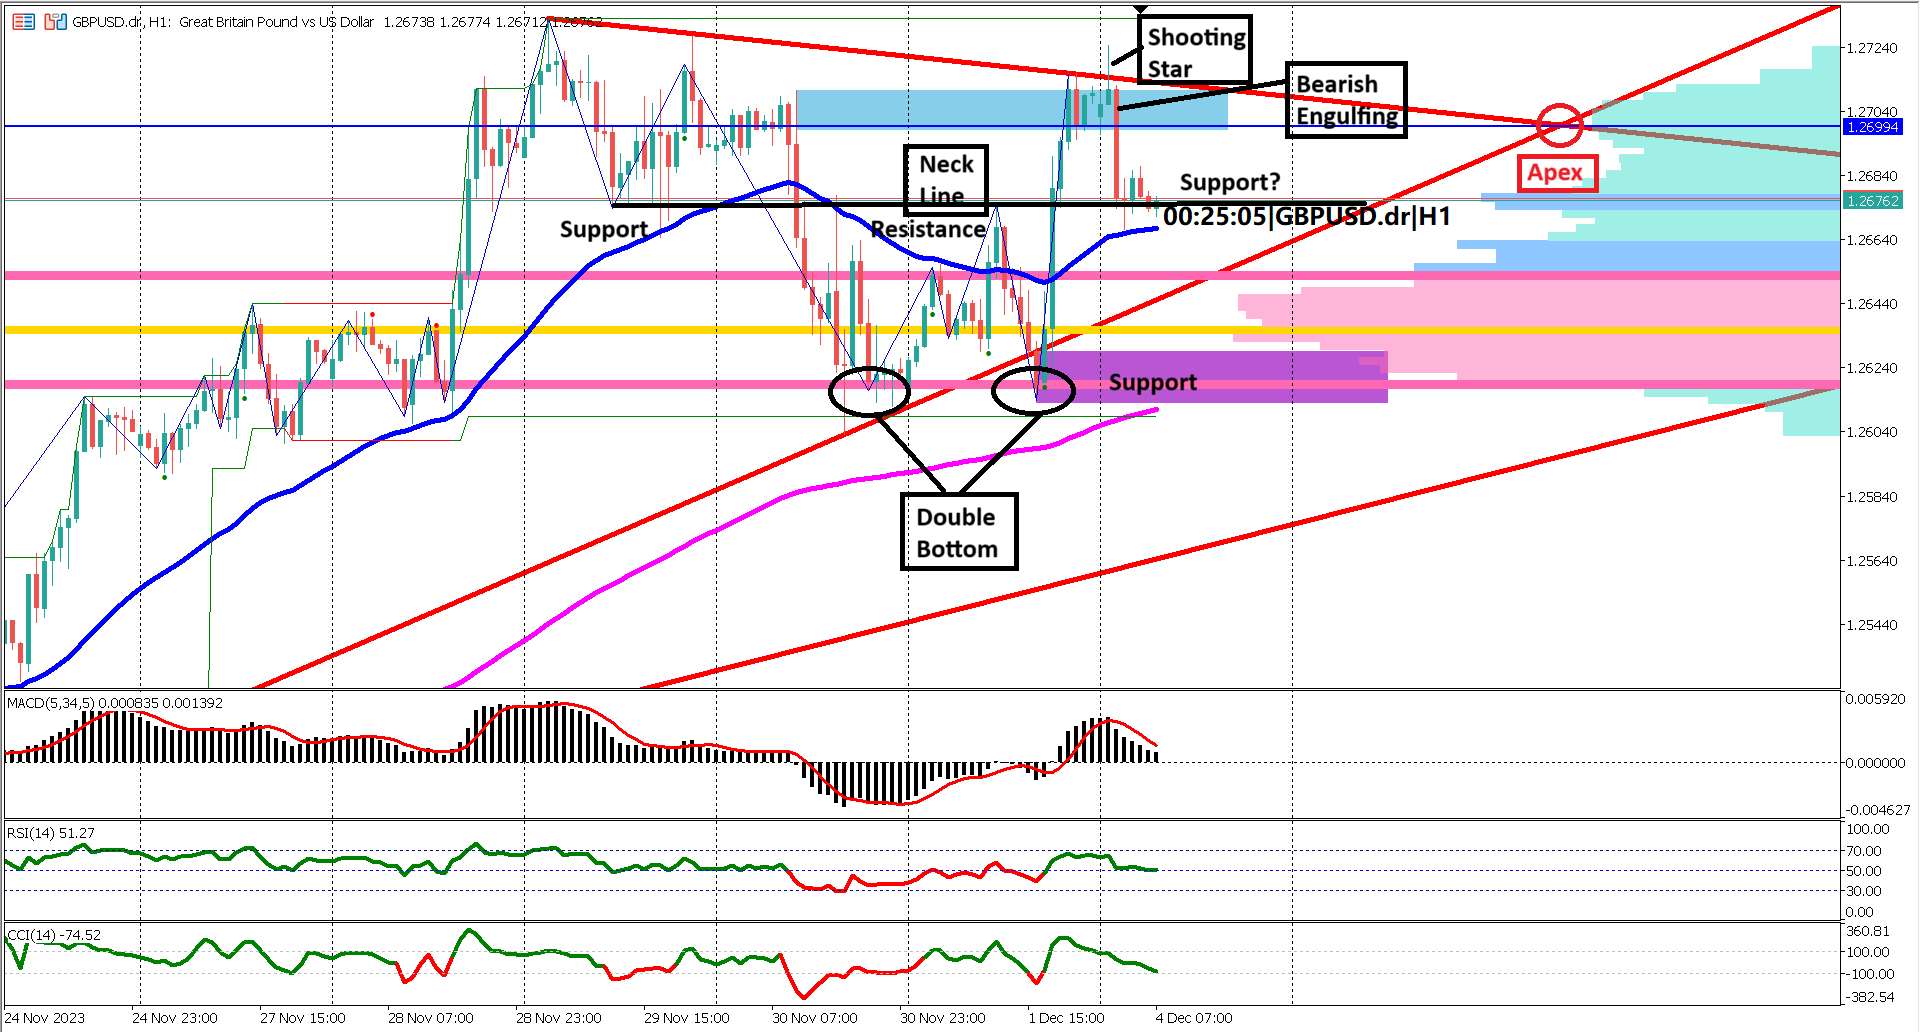
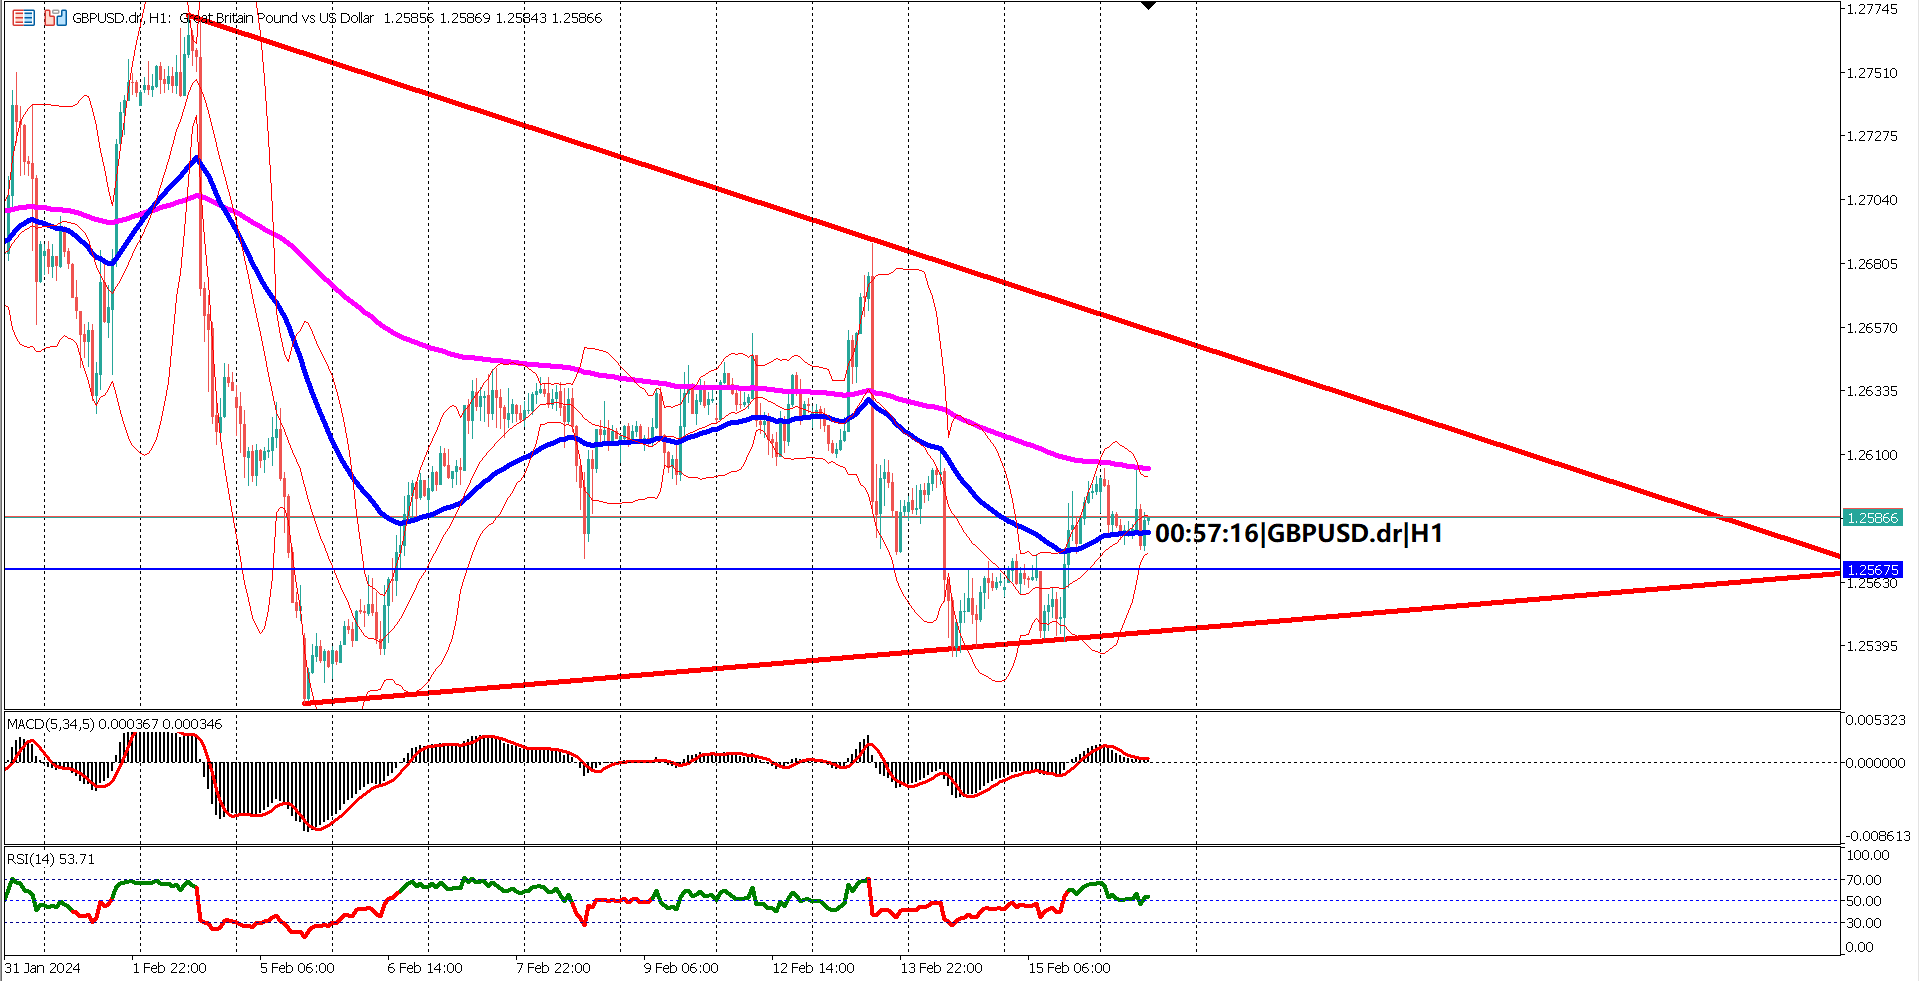
Zooming into the GBPUSD hourly timeframe chart price action, the last three trading days have seen a sideways movement since November 29, 2023. A symmetrical triangle, a continuation pattern of the current bullish trend, takes shape, adding a layer of anticipation to market dynamics. The confirmation of a double bottom, with a neckline breach at 1.26748, strengthens the case for bullish momentum.
The intriguing dynamics of the neckline, transitioning from support to resistance and back, suggest robust support that may propel a breakout from the symmetrical triangle to the upside. The double bottom's low serves as a key support level, with a breach potentially tilting the scales in favor of bearish control.
The apex, or the intersection of the symmetrical triangle trendlines, stands as a key resistance level at 1.26994. This level coincides with the bearish candlestick patterns of a shooting star and a bearish engulfing, reinforcing the resistance at the apex. A successful breach above this level signals a bullish continuation, setting the stage for a potential ascent to 1.2750 - 1.2800.
The EMA 50 & 200, stalwarts on the bullish side, exhibit signs of renewed strength. After a period of convergence during a correction, the lines are expanding again post-Friday's bullish rally, signaling a resurgence in bullish momentum.
Oscillator indicators contribute confluence to the bullish narrative. The RSI rebounded from the 40% zone, ascending to the 60% region post-Friday and maintaining a value above 40%. The MACD portrays a bullish correction, with both the signal and histogram comfortably above the 0 level. The CCI, residing safely above -100, signals a lack of oversold conditions.
Forecast 17.1B vs Previous 16.5B
Forecast -2.6% vs Previous 2.8%

Trading foreign exchange on margin carries a high level of risk, and may not be suitable for all investors. Before deciding to trade foreign exchange you should carefully consider your investment objectives, level of experience, and risk appetite.
Nothing contained in this website should be construed as investment advice. Any reference to an investment's past or potential performance is not, and should not be construed as, a recommendation or as a guarantee of any specific outcome or profit.