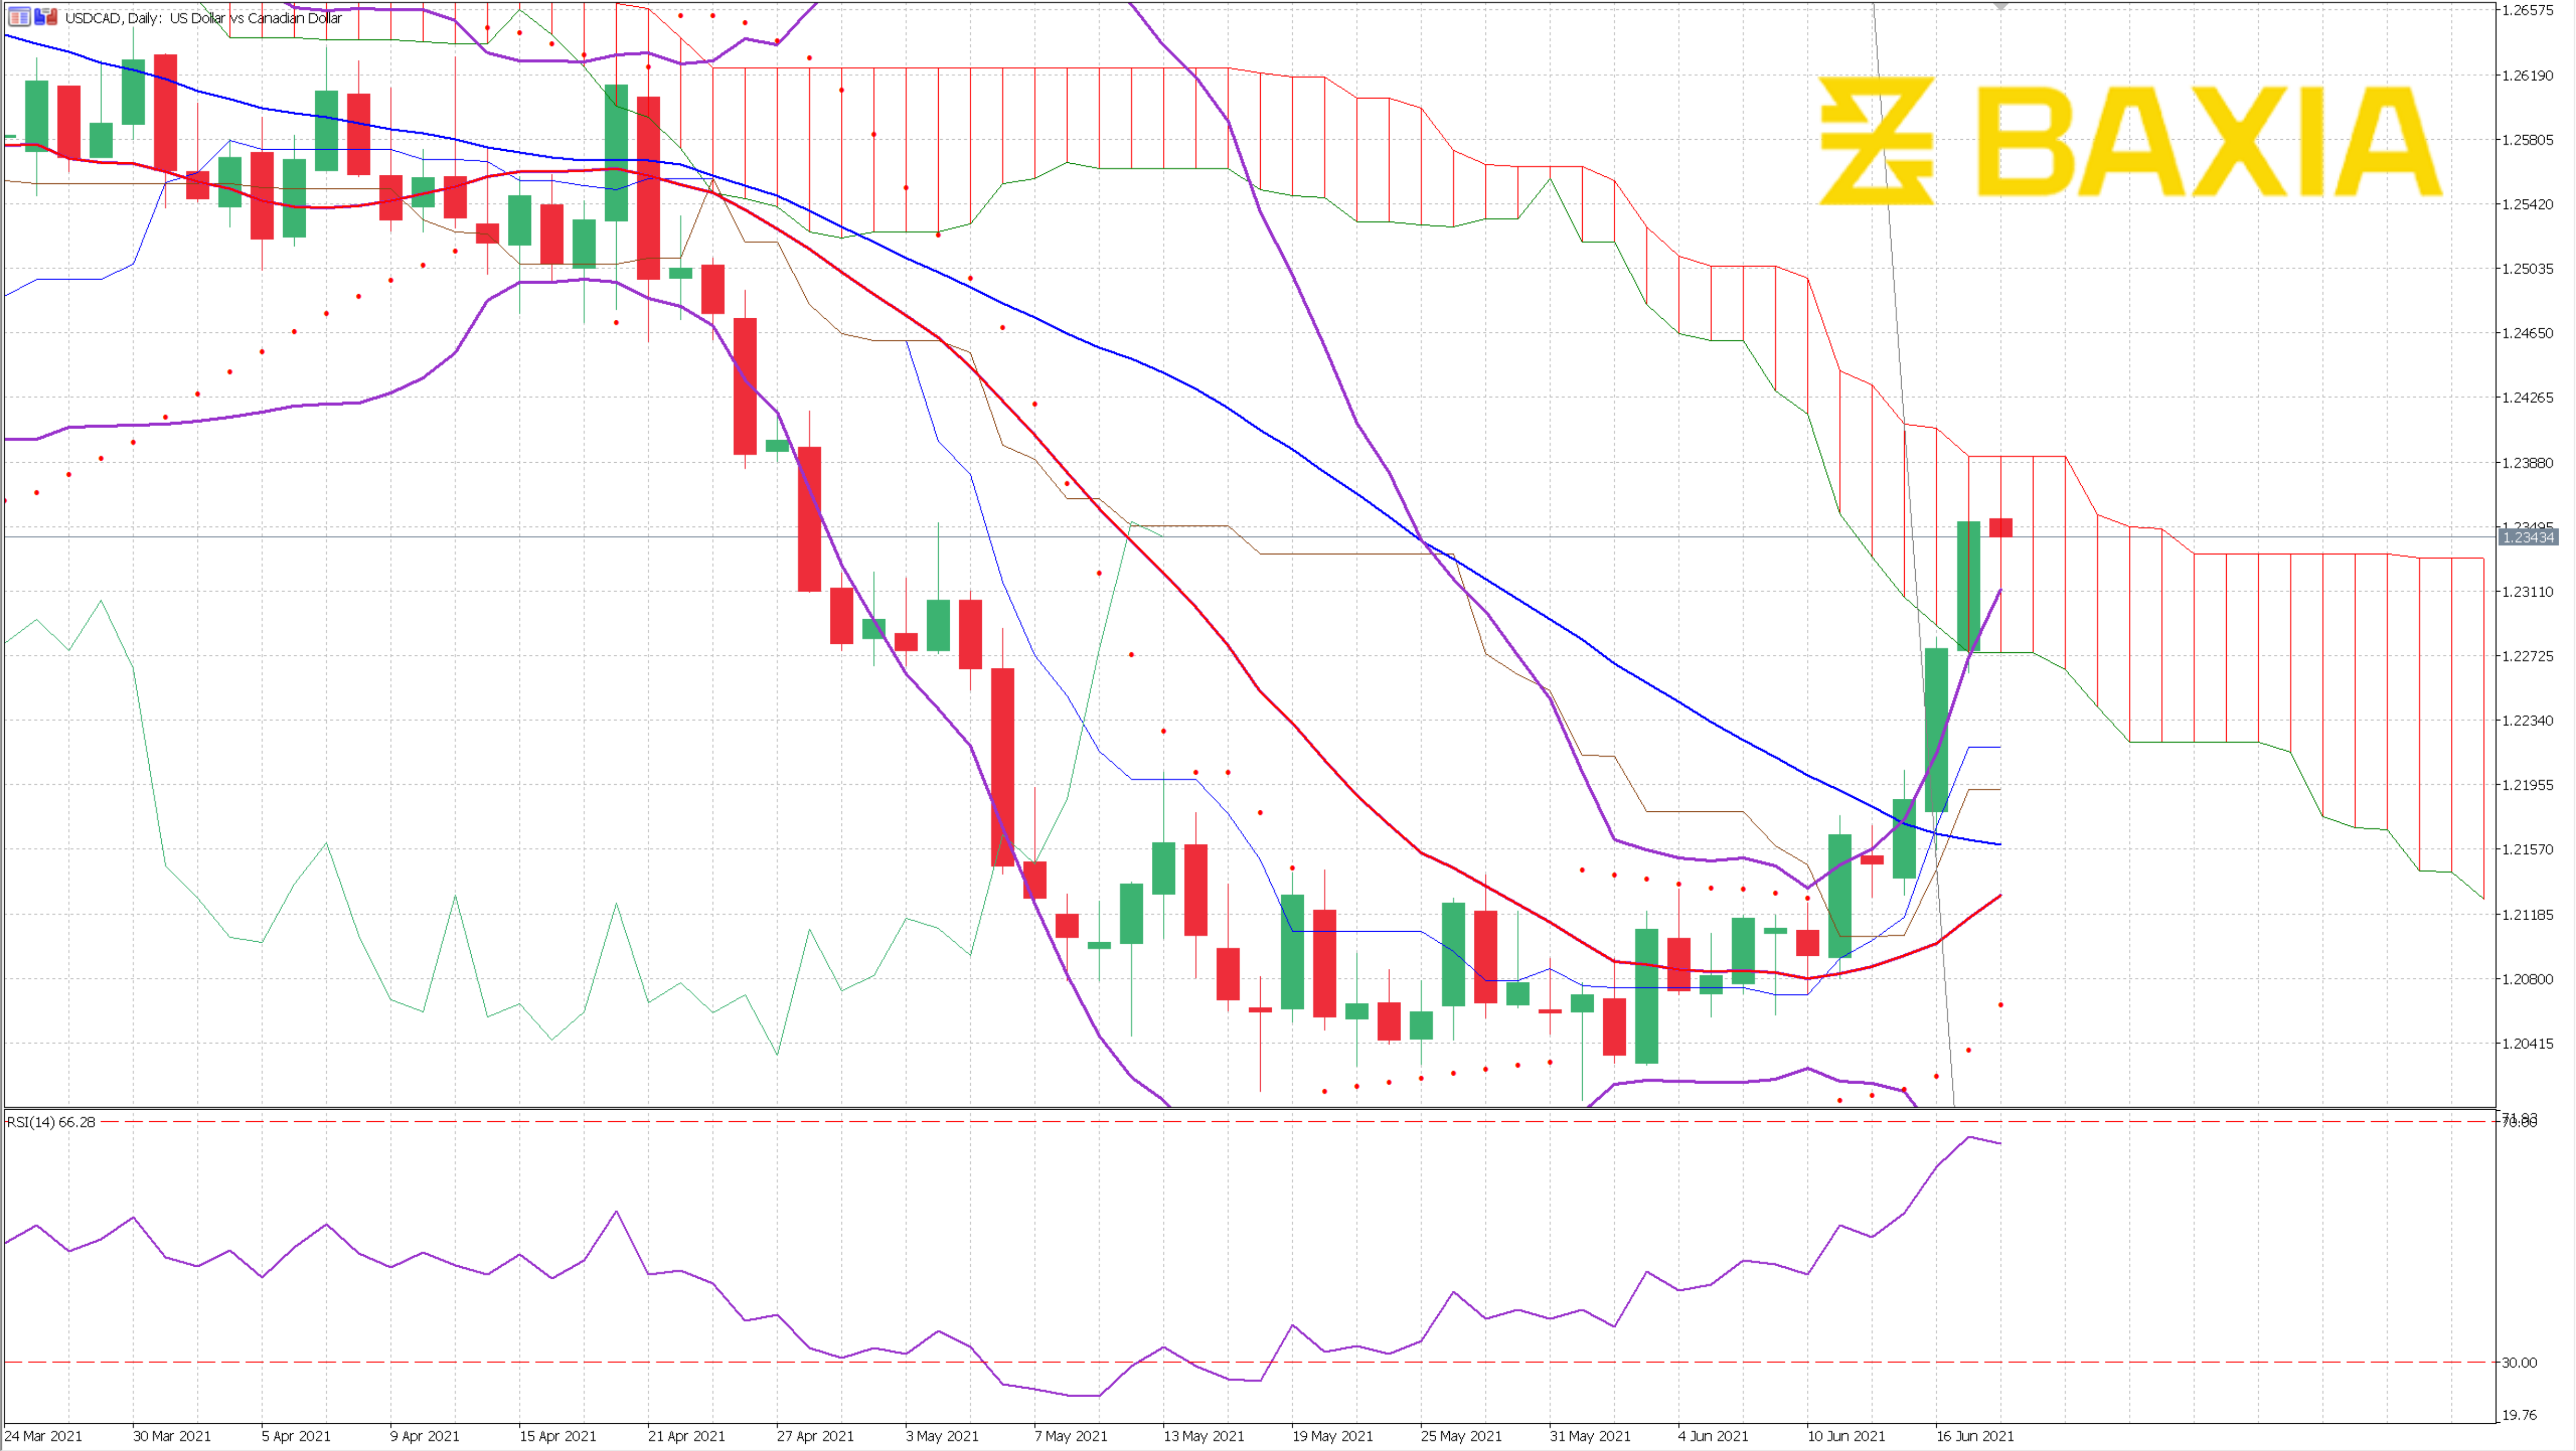

The price met support at the beginning of May; it had hovered around 1.206 for 22 days. The downward trend on USDCAD was stable and lasted for almost one year. Changing such a long-lasting trend is not an easy thing. However, the strong support tells us that the price is turning.
Bollinger Bands shows a steep angle on the upper band, along with the price line, although it cannot catch. The new trend on Parabolic SAR made a slight curve; this is a signal for a steeper trend coming up. The Moving Average 25 is moving up too; however, it cannot catch up with the price line. Finally, Ichimoku is getting thicker and moving down to the bottom of the price line, which is also a bullish signal.
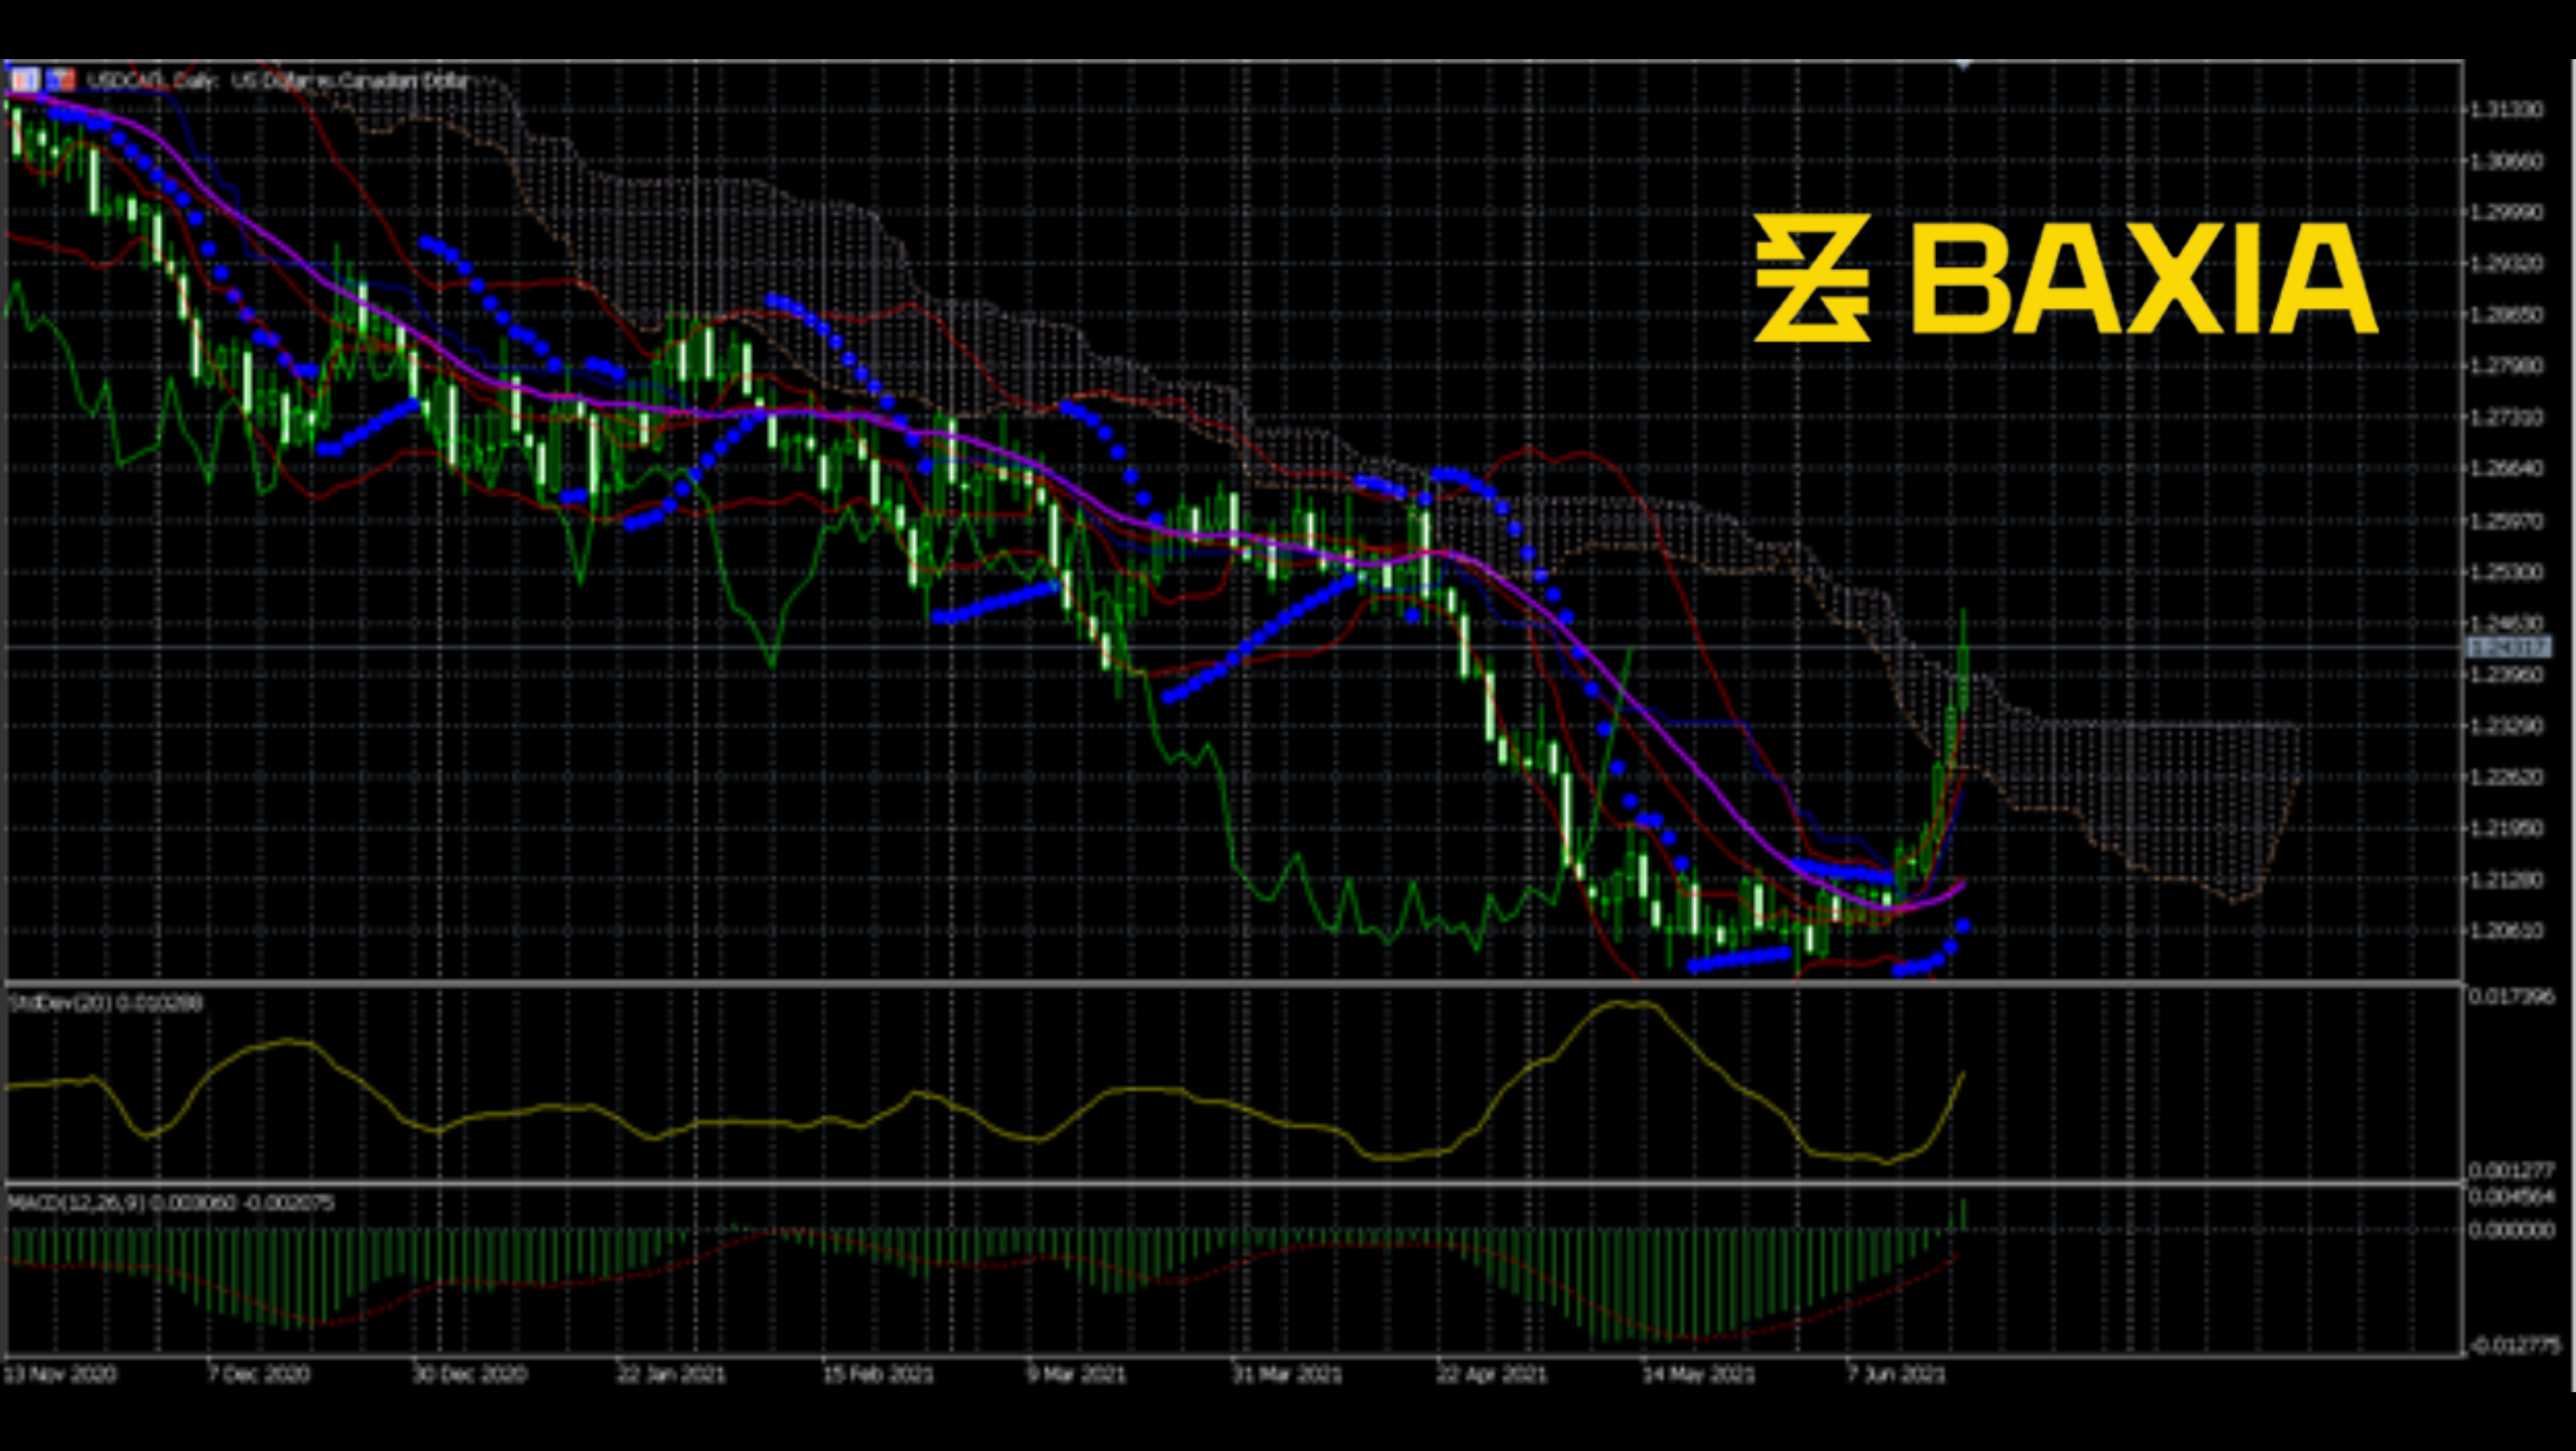
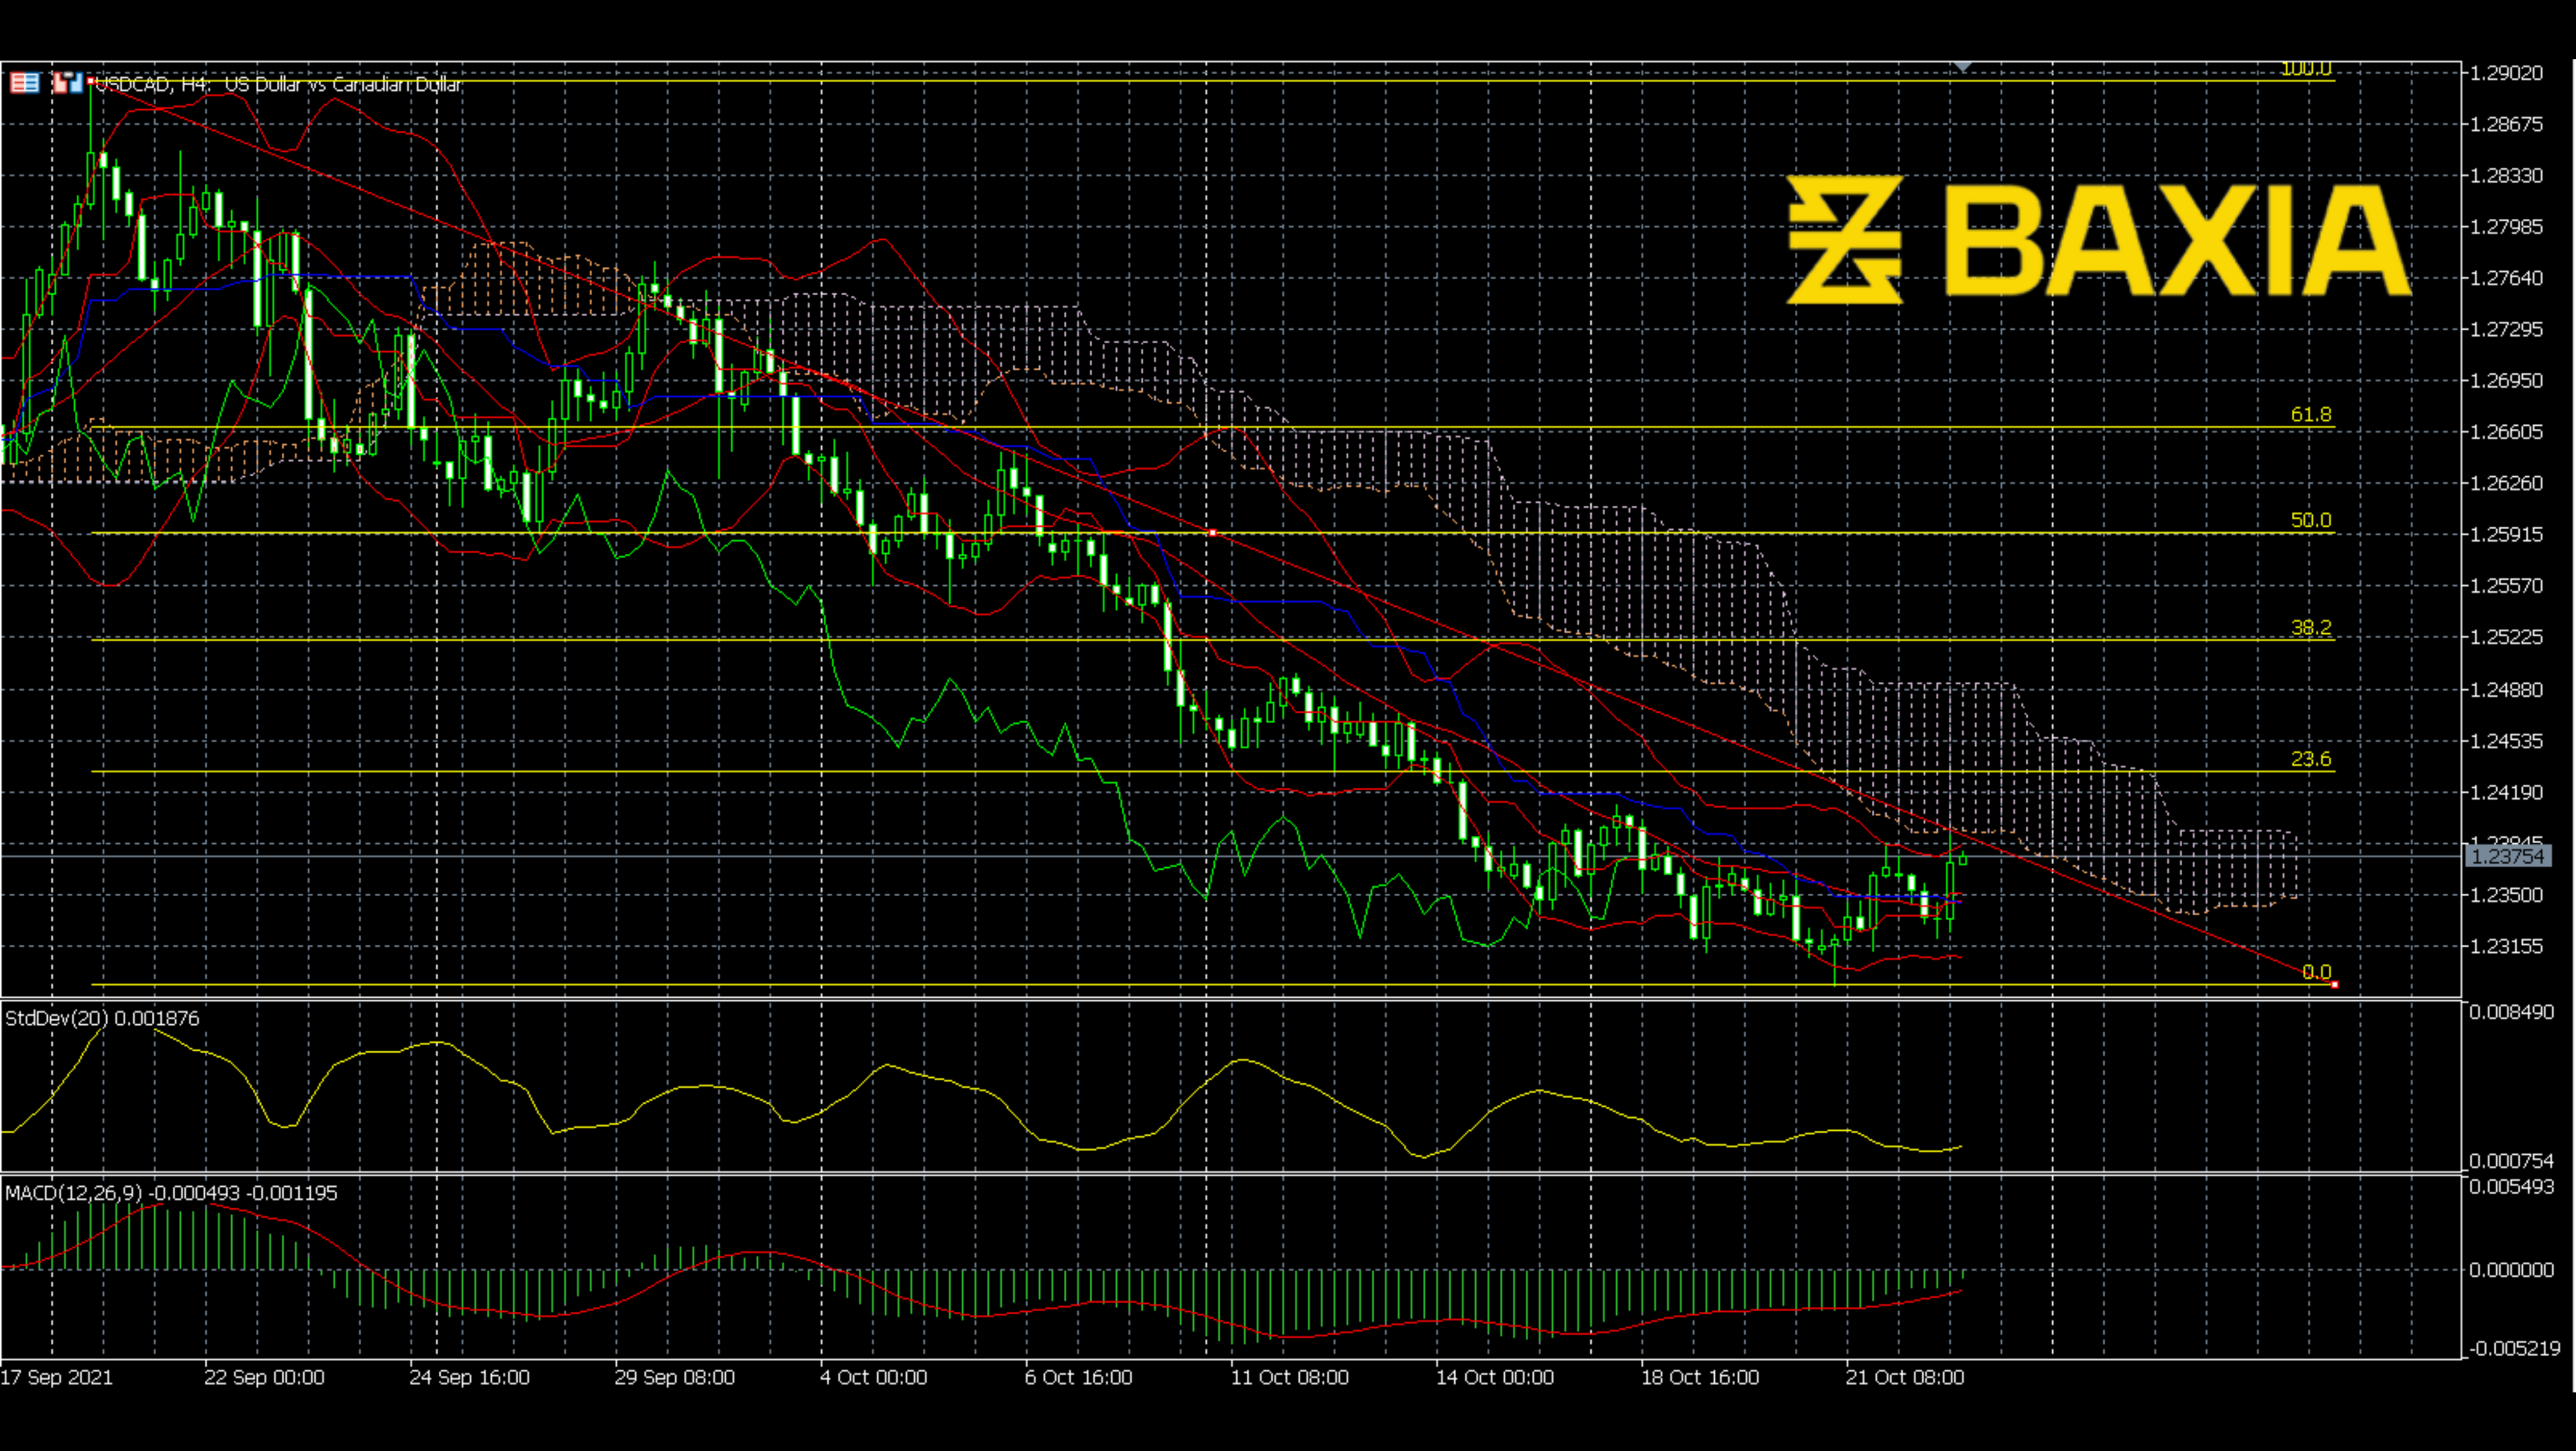
The standard deviation is going up as expected. Significant fluctuations always cause high standard deviation, which could be considered as a breakout signal. MACD already made a bullish cross, and it continues to go up.
Now, the bullish signal still dominates the price; the breakout has not chilled down yet. Thus, we should be prepared for a long upward trend.
We love to hear new ideas from traders and want to know what you think!
If you like this topic and want to suggest future topics that you find helpful, let us know by clicking the ‘submit your feedback’ button below.

Trading foreign exchange on margin carries a high level of risk, and may not be suitable for all investors. Before deciding to trade foreign exchange you should carefully consider your investment objectives, level of experience, and risk appetite.
Nothing contained in this website should be construed as investment advice. Any reference to an investment's past or potential performance is not, and should not be construed as, a recommendation or as a guarantee of any specific outcome or profit.