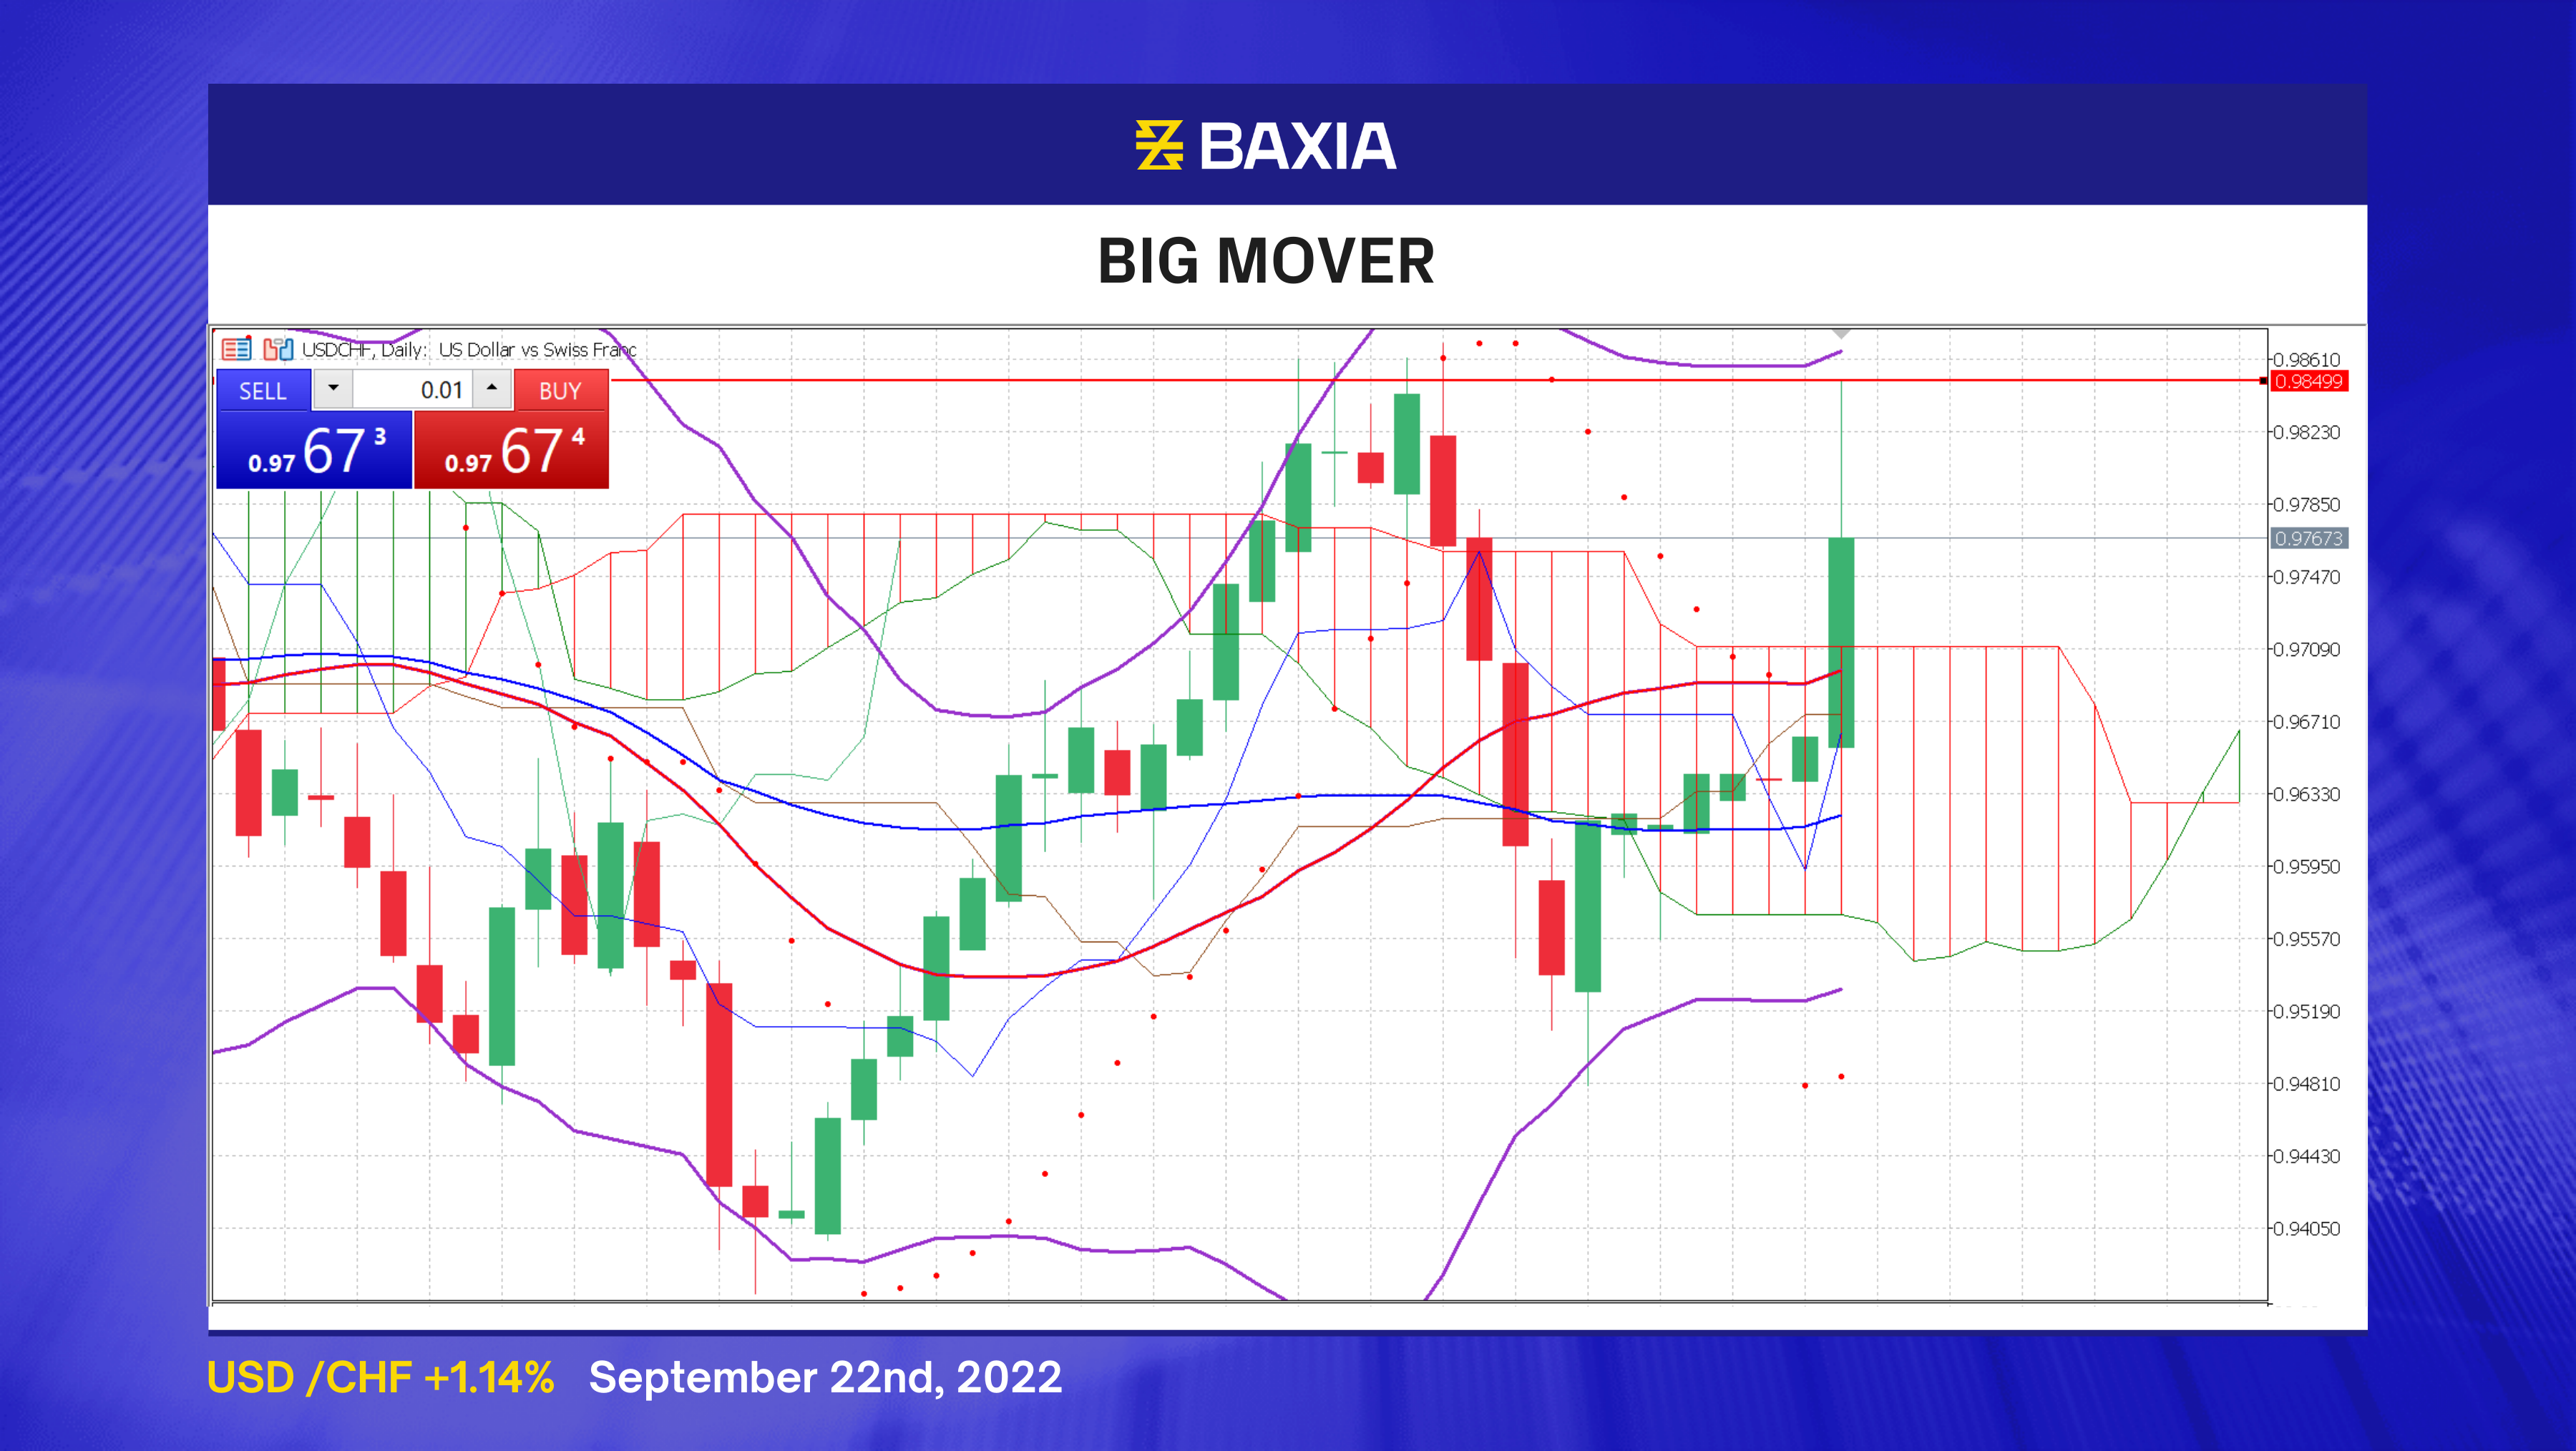

The downward movement was significant and solid. The fluctuations were mild during the downward trend. Mostly, the price moved below the middle line of the Bollinger Bands. Although this steady slope had lasted for twenty-five days since Sep 17, it stopped recently on Oct 21. Support power was sudden; we needed to be prepared for the next step.
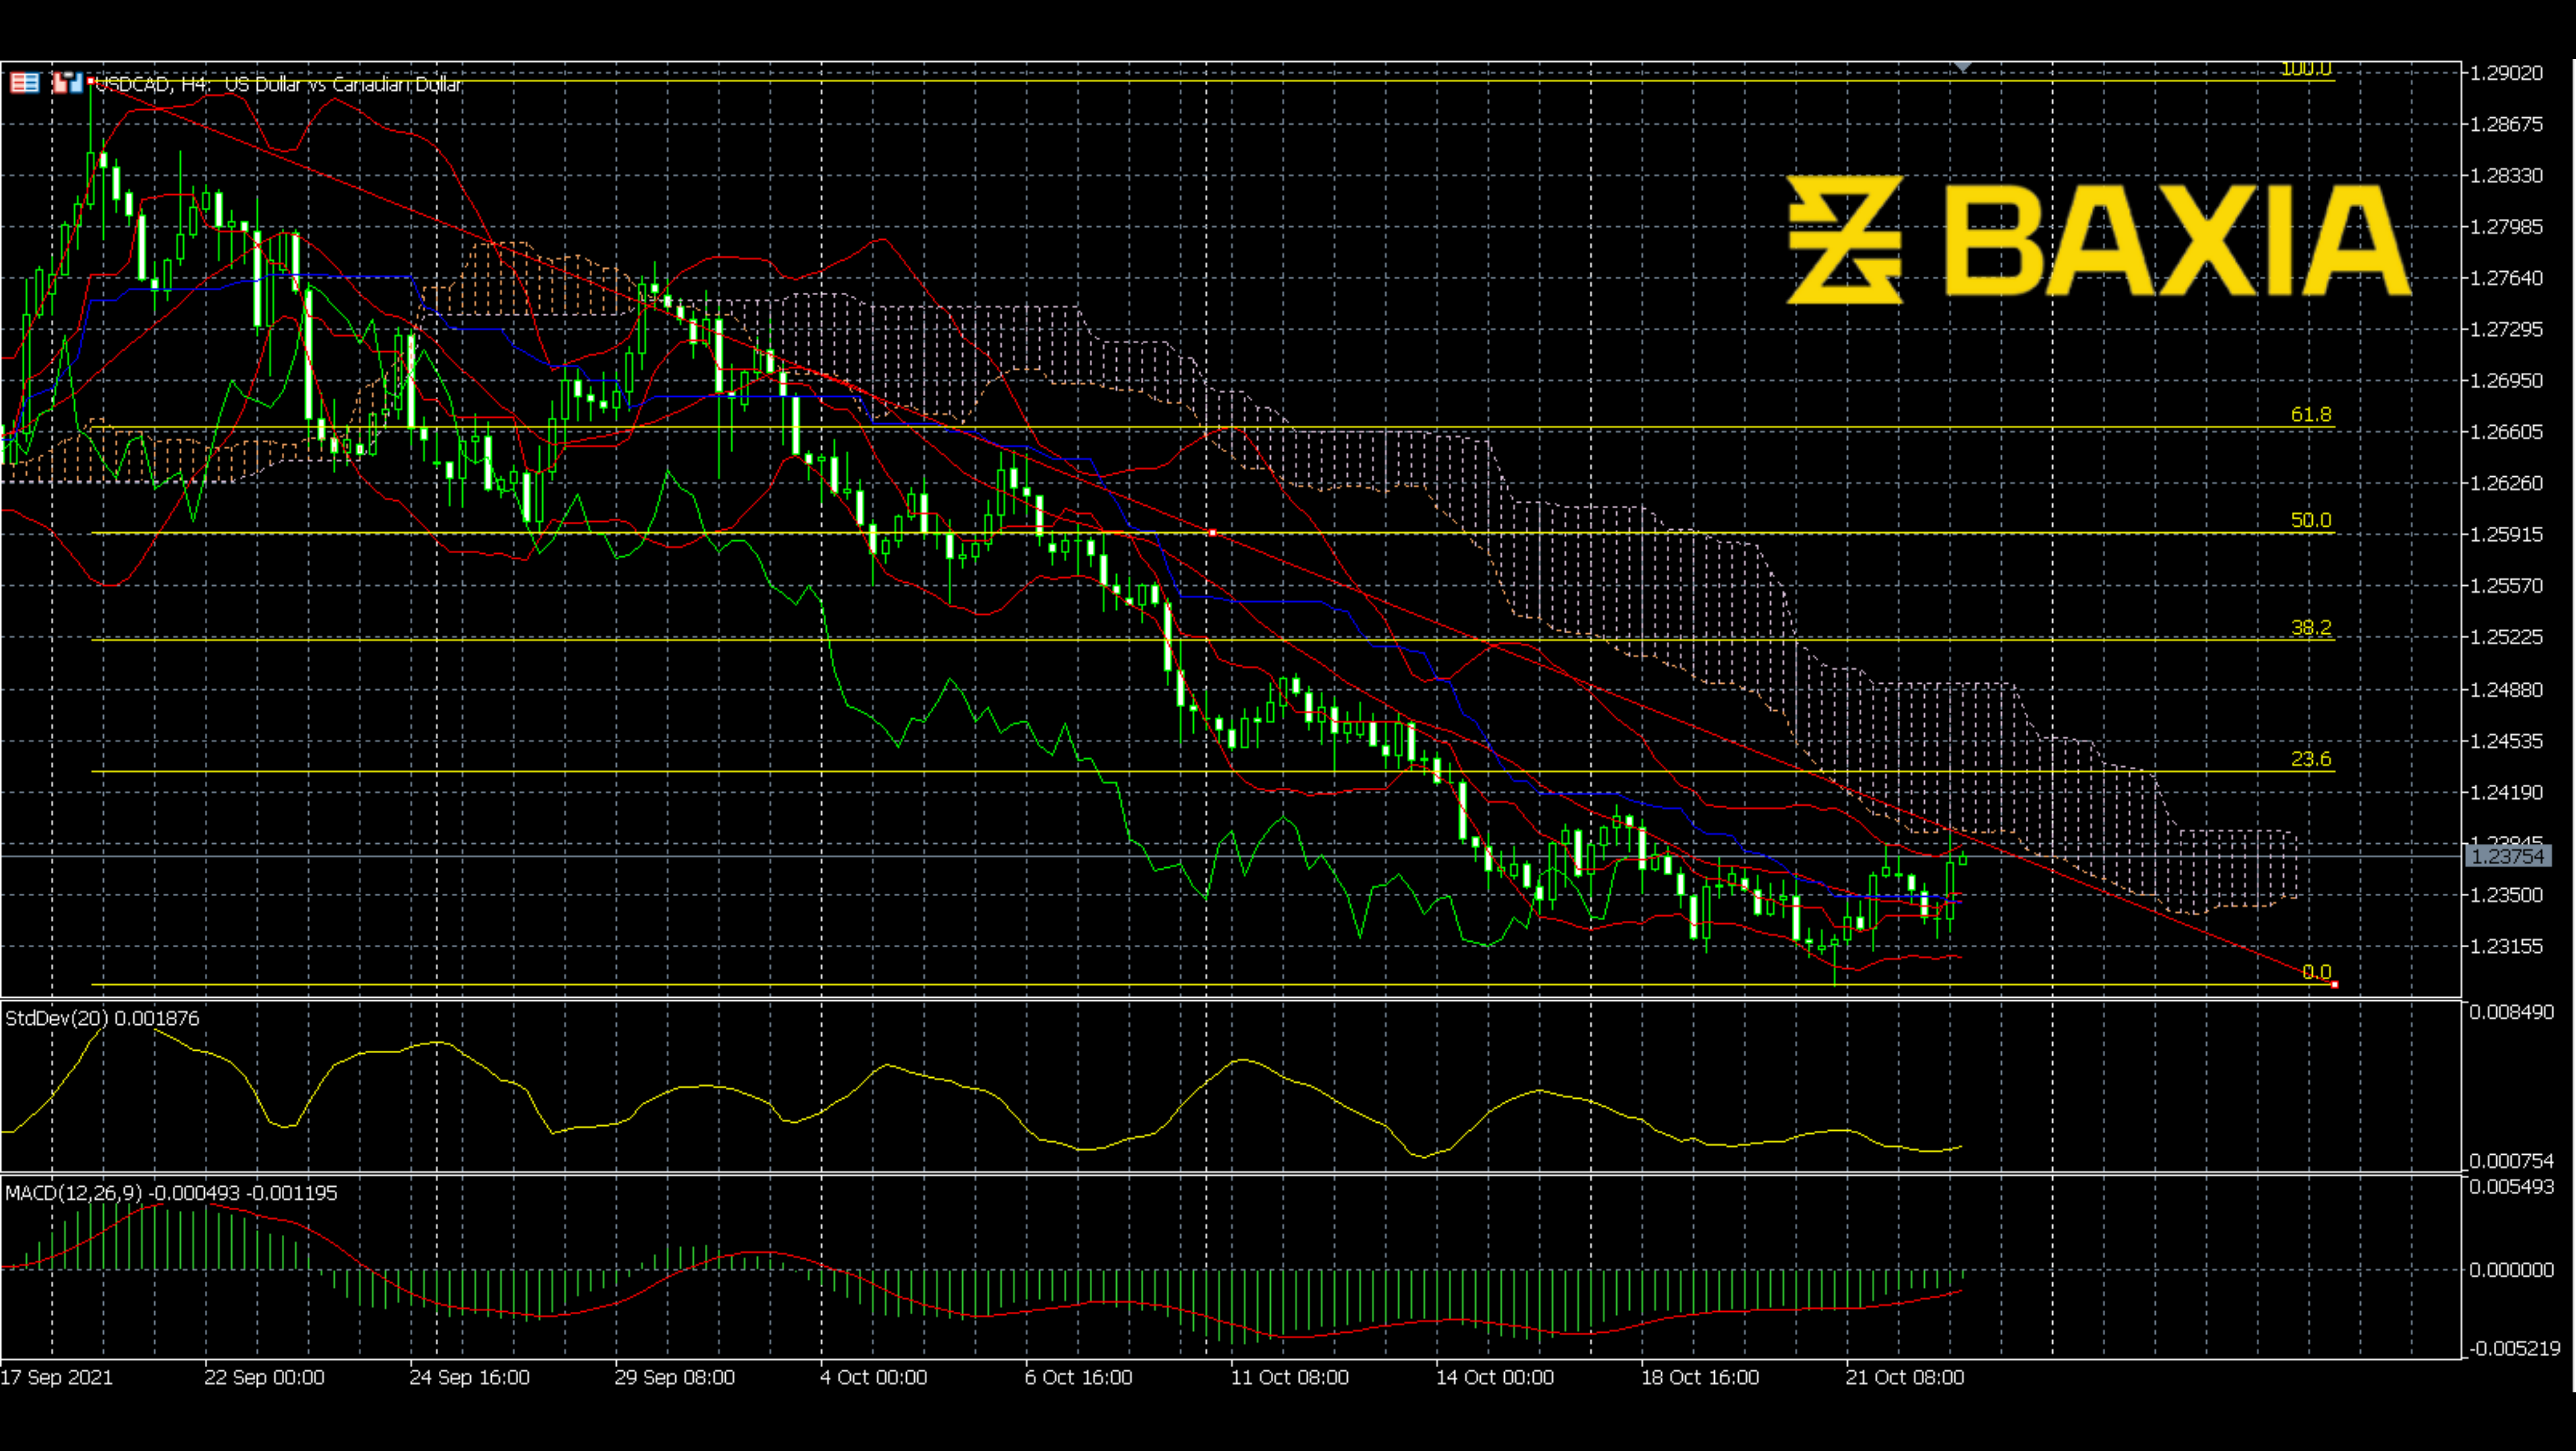
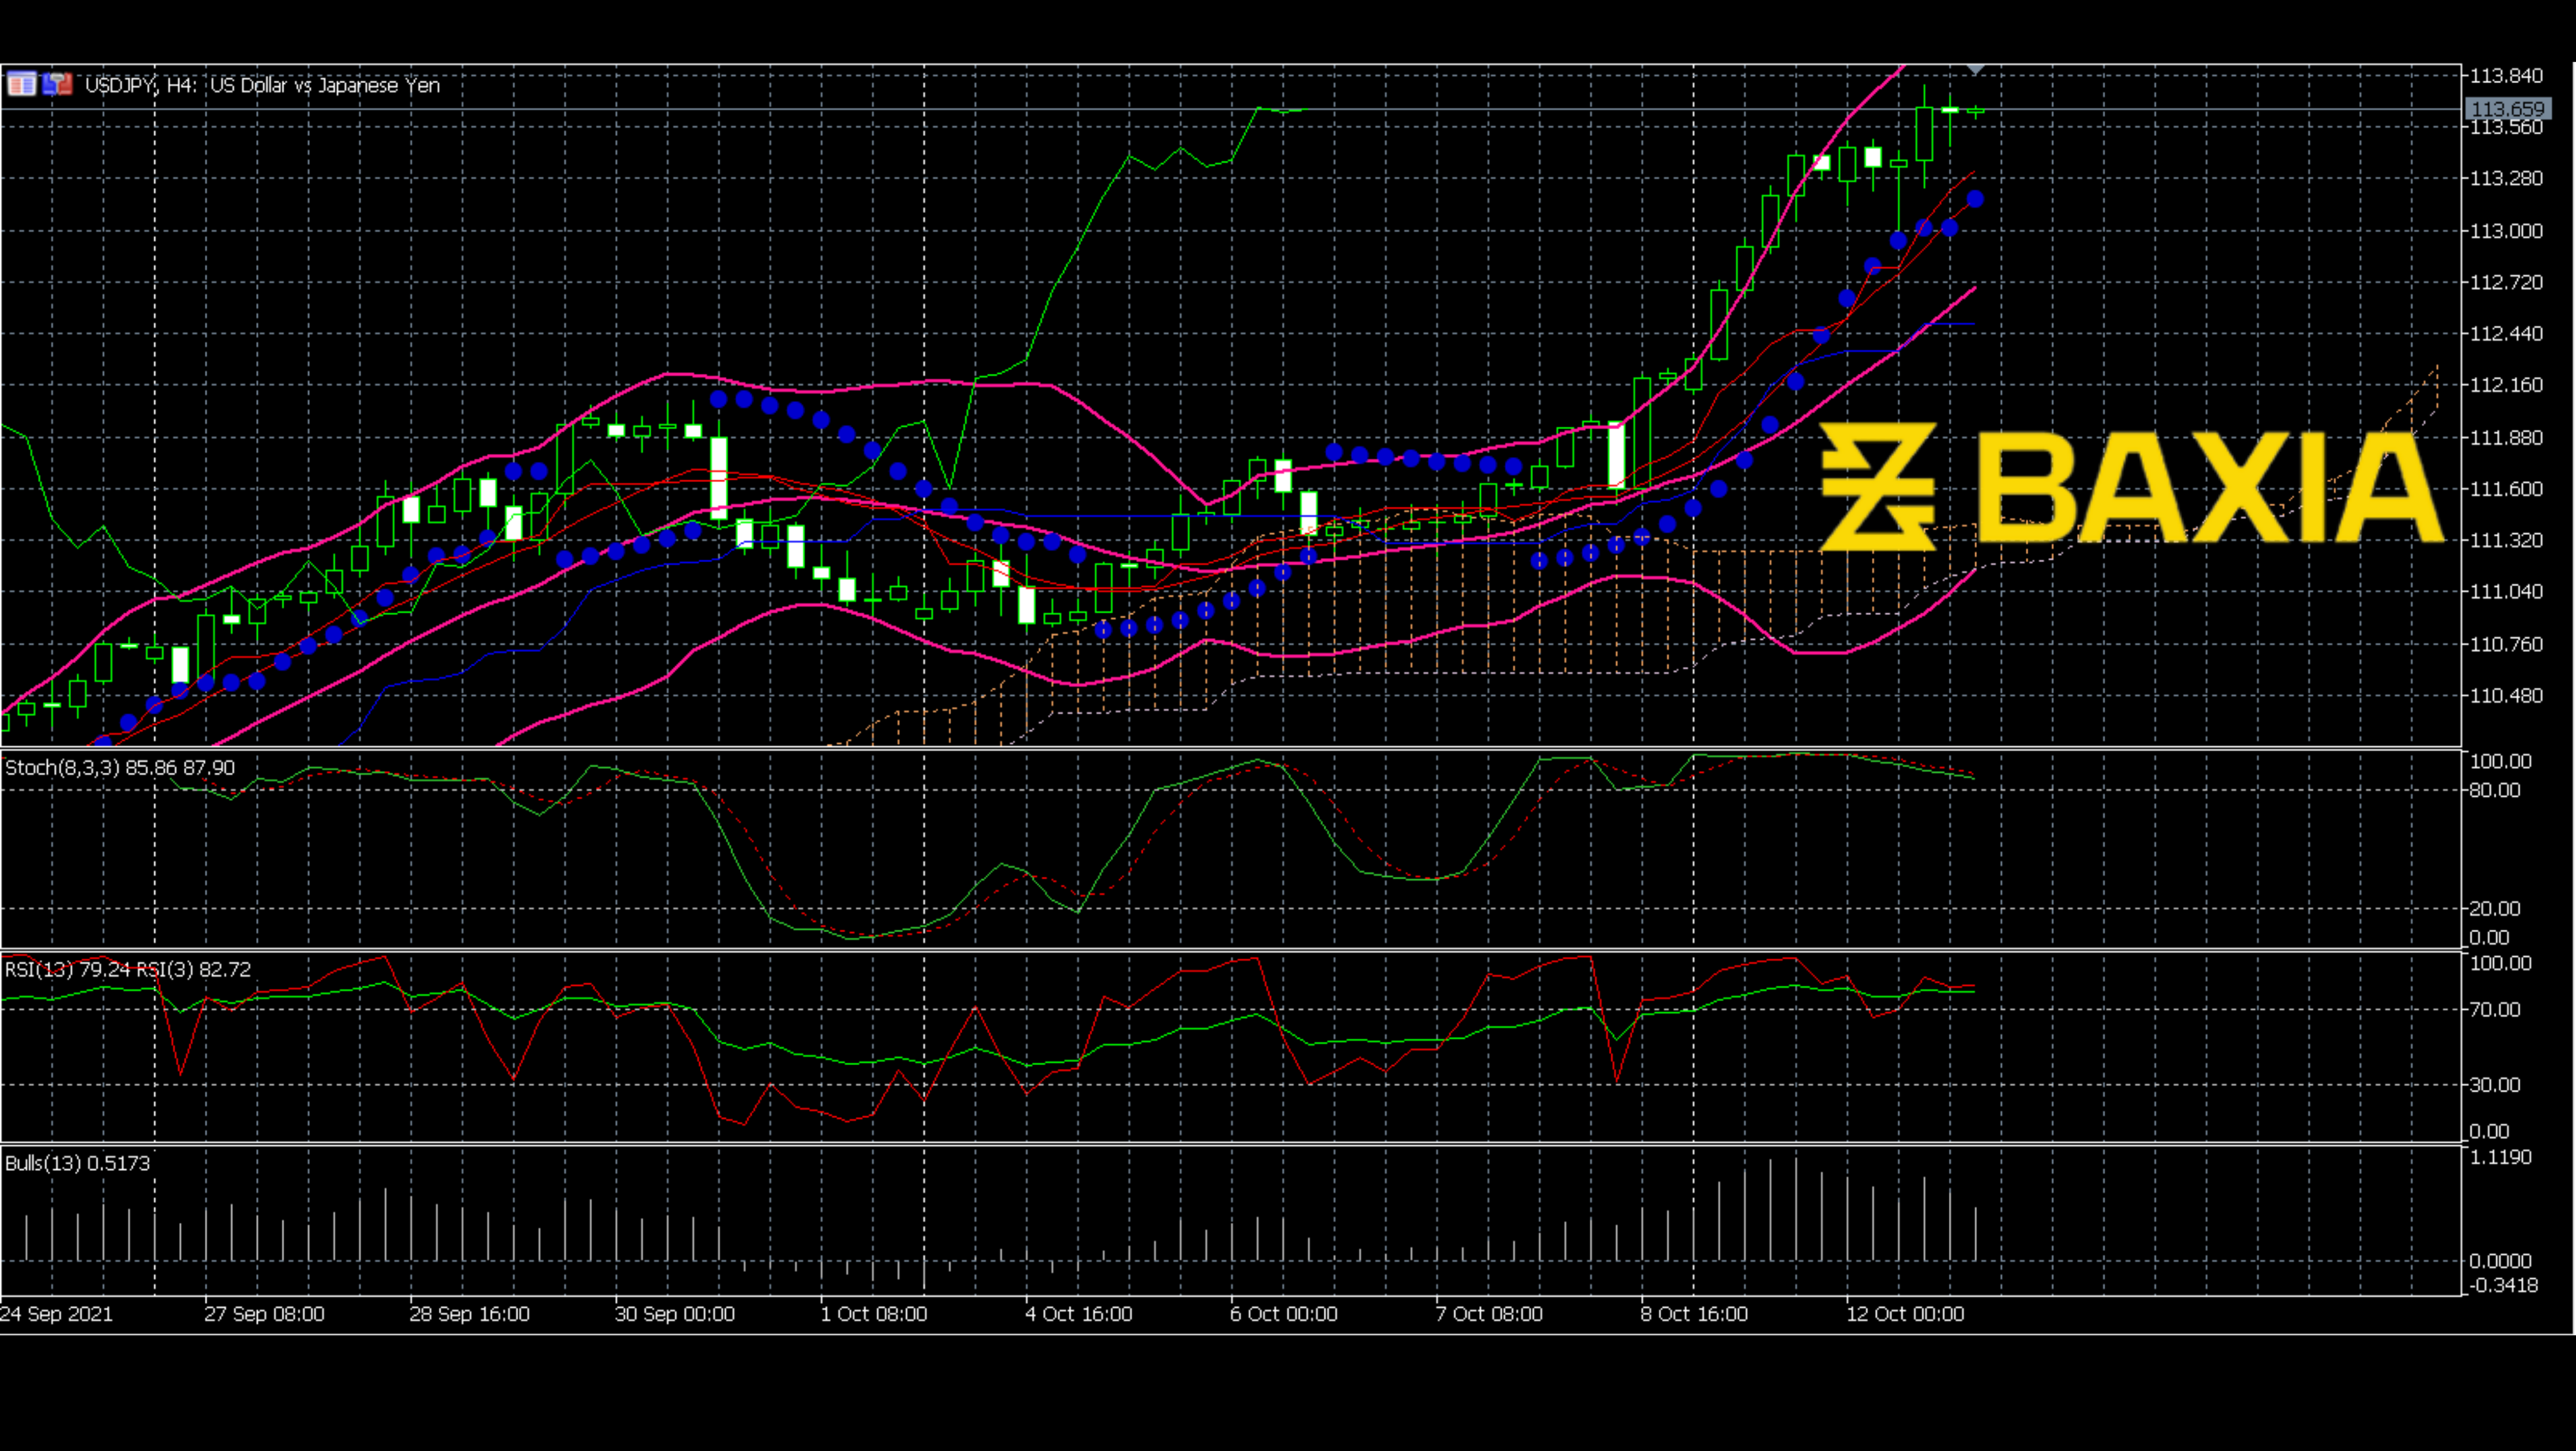
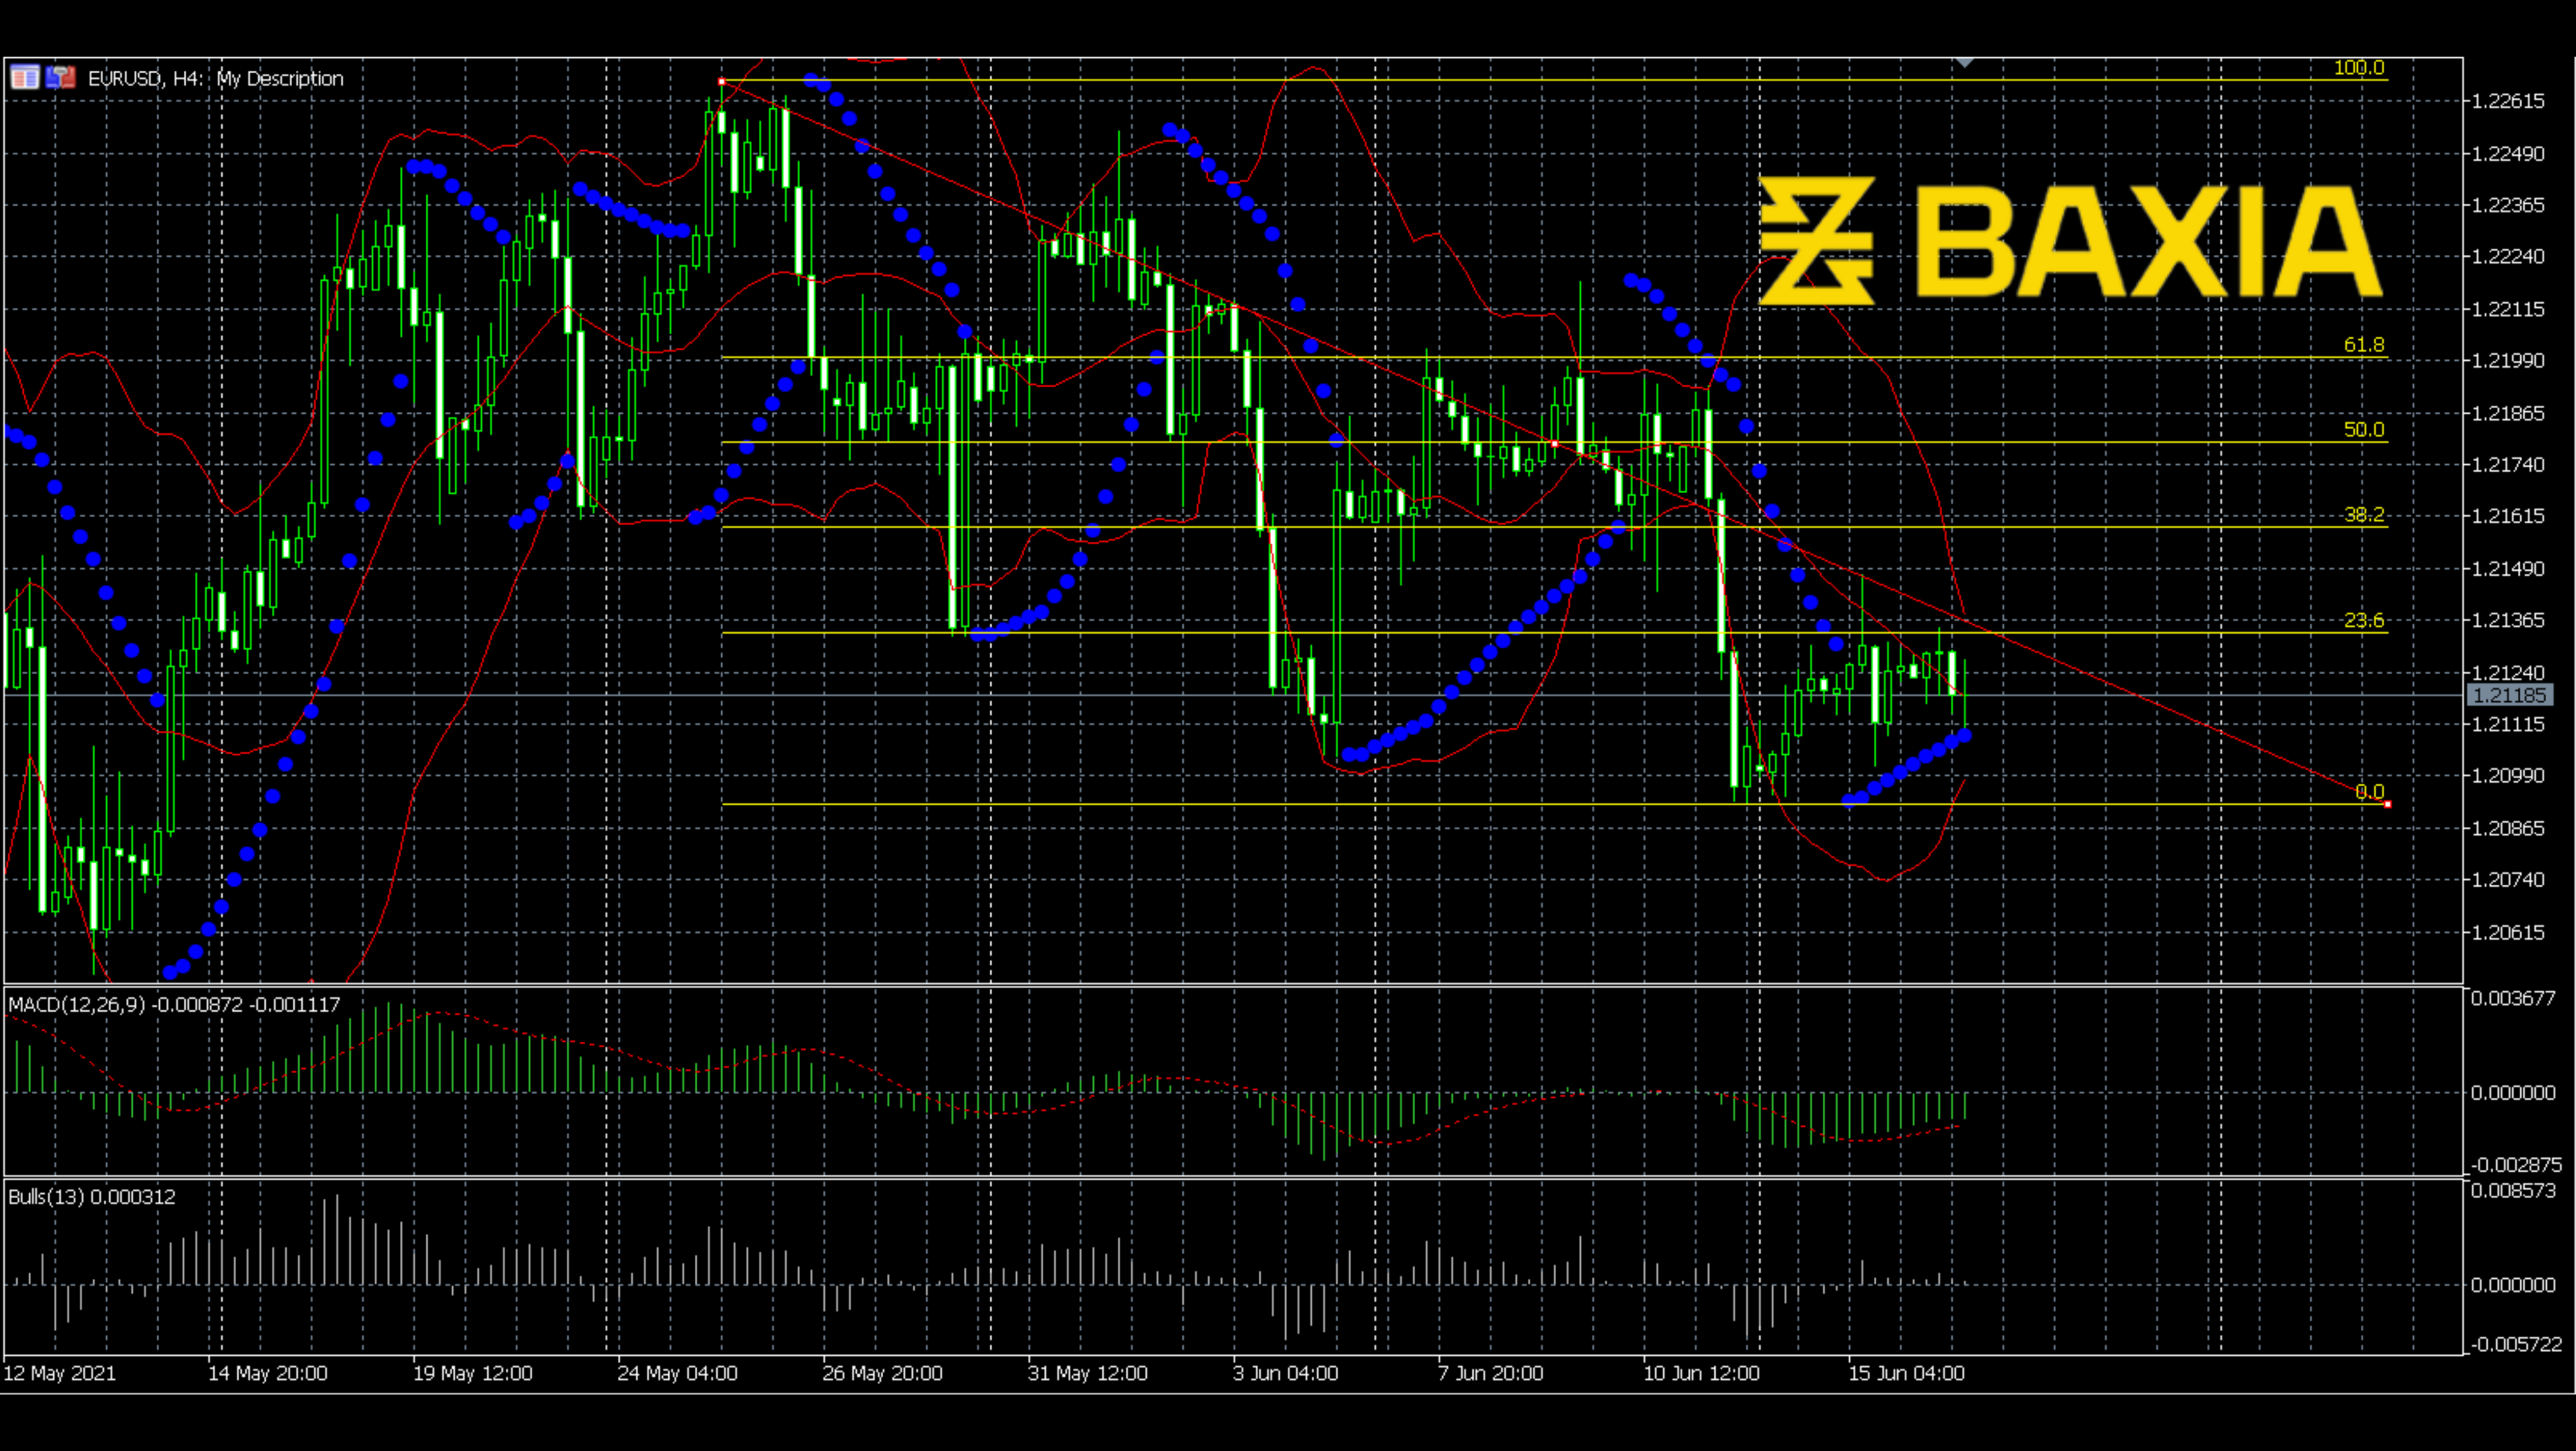
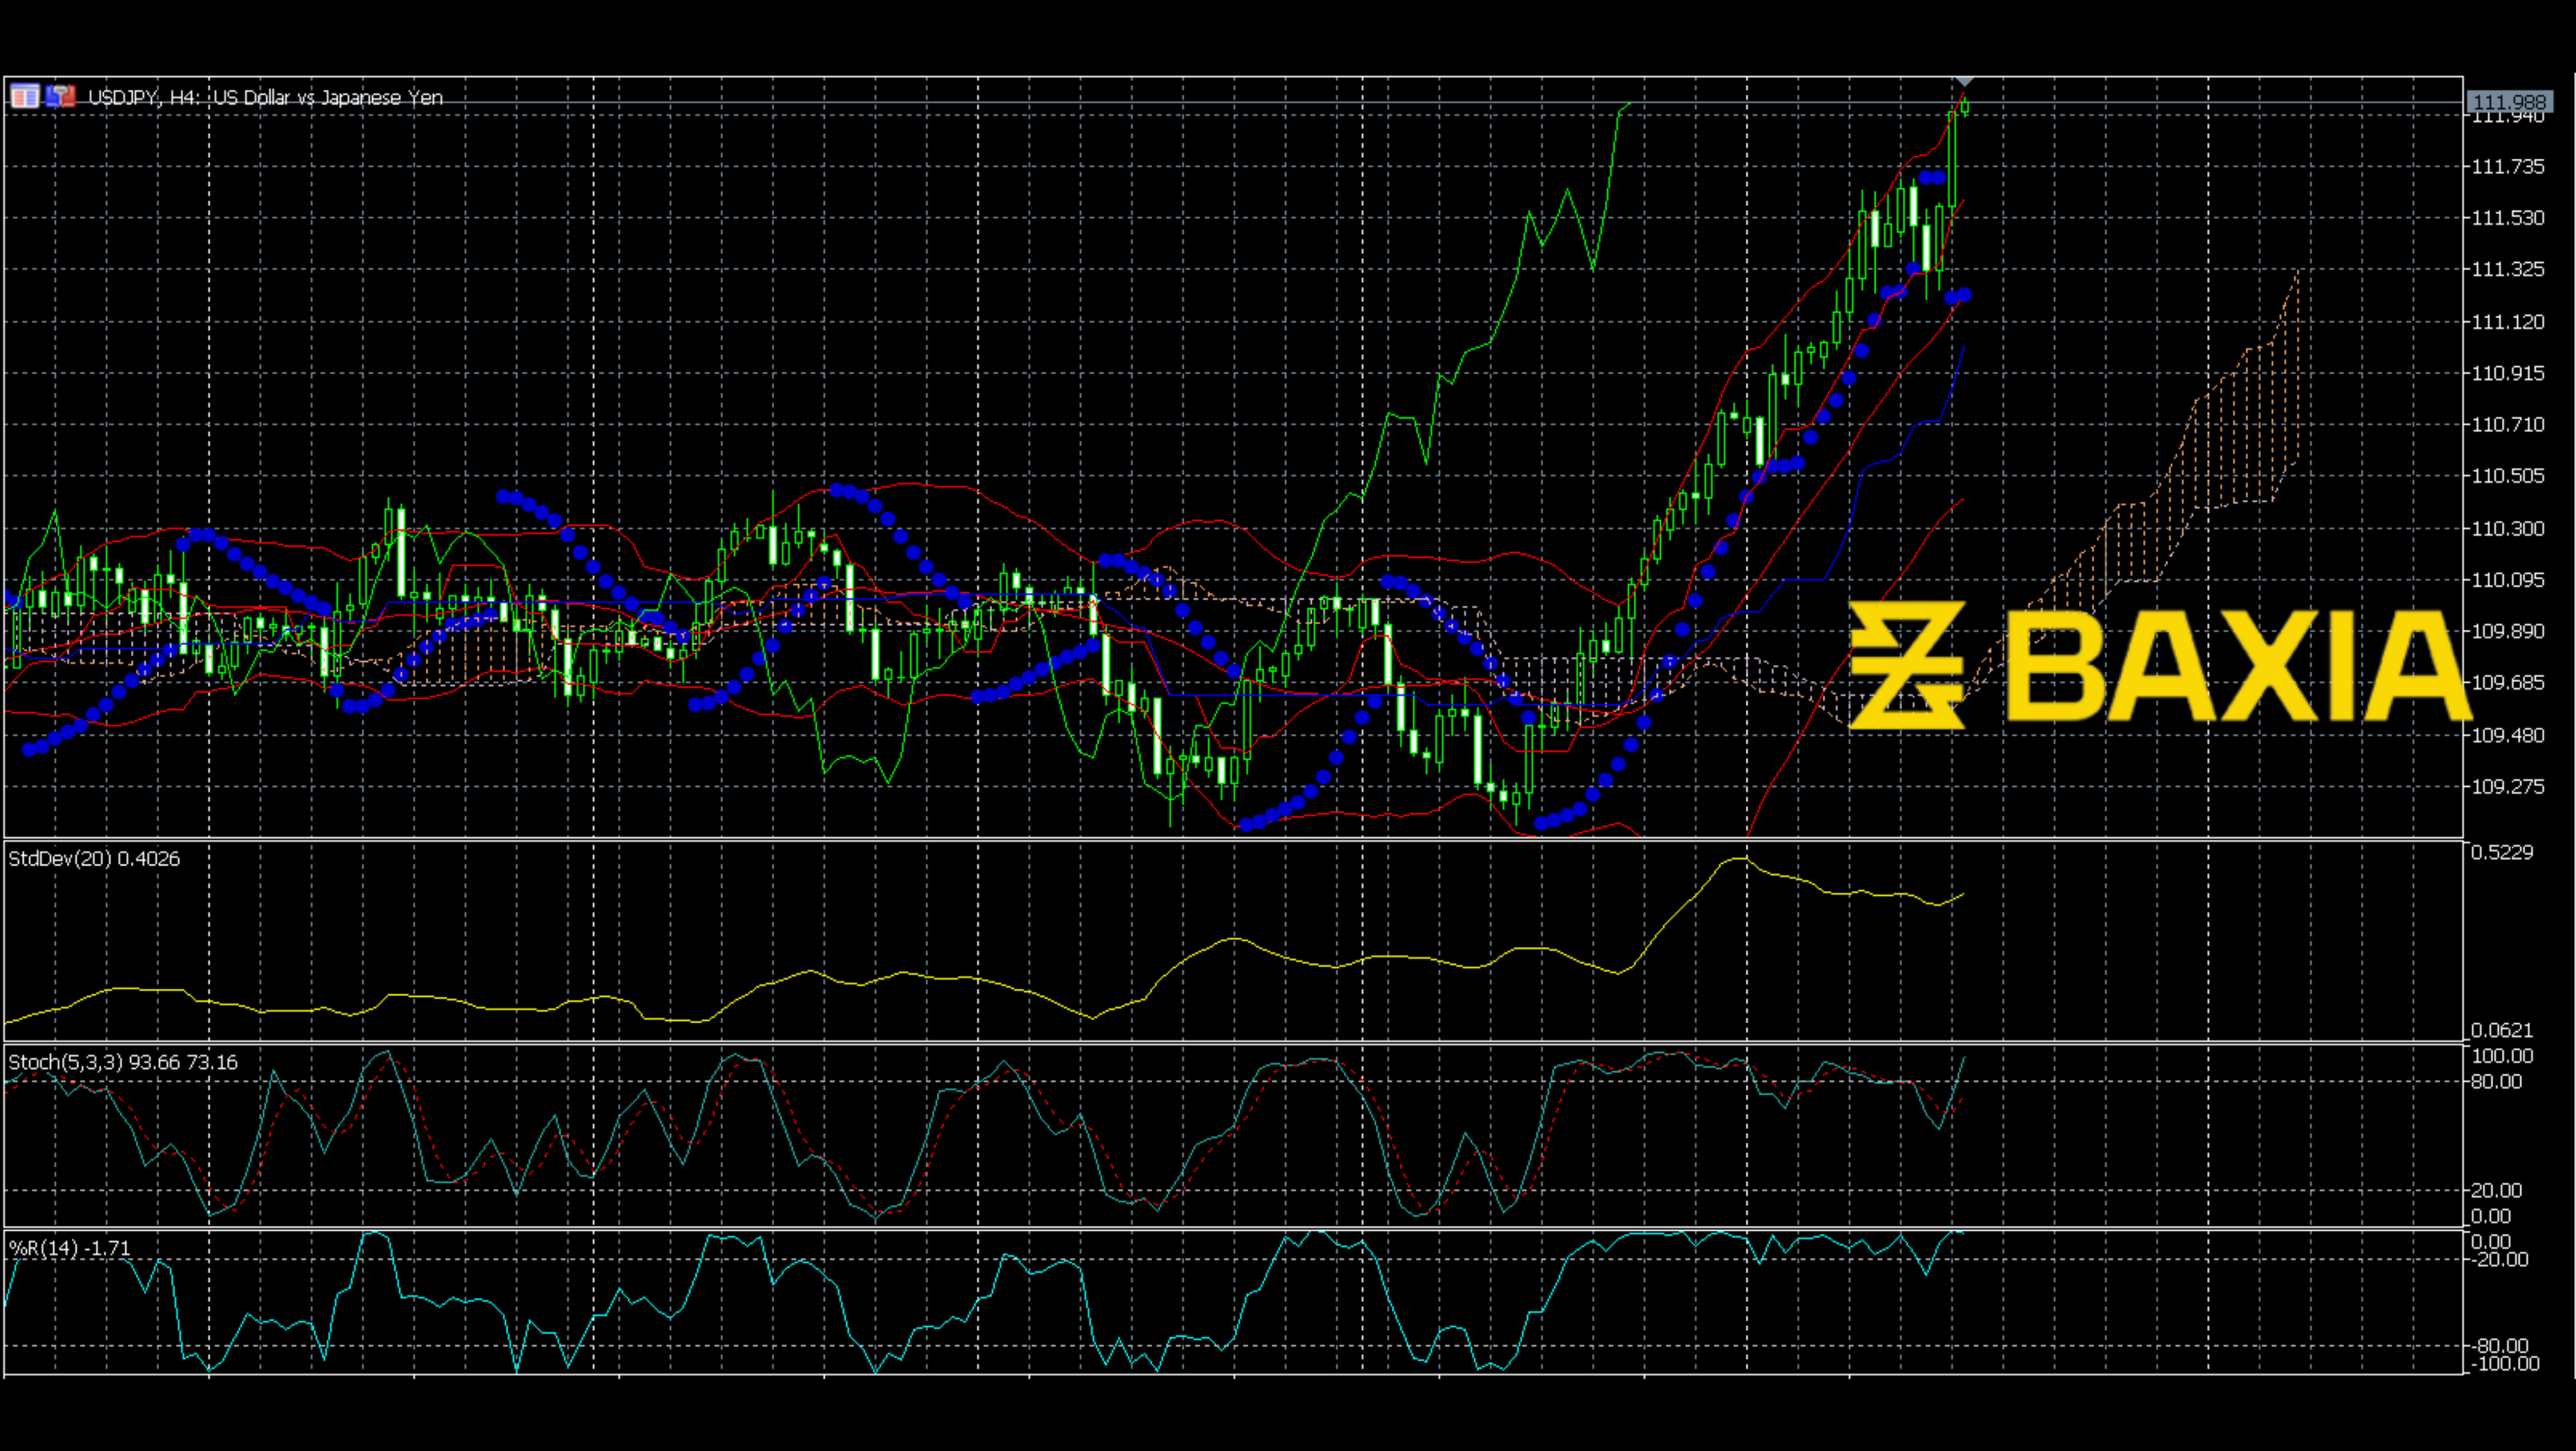
The Bollinger Bands shrunk, so the price got a chance to touch the upper Bollinger Band, which is a breakout signal. The Ichimoku cloud was not far from the price line when the price went down, so now, the price touched the Ichimoku. This could be considered the beginning of the upward trend. Recently, the Standard Deviation seems to have a new upward trend. Also, the MACD made a bullish signal on Oct 21, which means the upward trend began. Let’s see if the price line could touch the 23.6% Fibonacci level.
We love to hear new ideas from traders and want to know what you think!
If you like this topic and want to suggest future topics that you find helpful, let us know by clicking the ‘submit your feedback’ button below.

Trading foreign exchange on margin carries a high level of risk, and may not be suitable for all investors. Before deciding to trade foreign exchange you should carefully consider your investment objectives, level of experience, and risk appetite.
Nothing contained in this website should be construed as investment advice. Any reference to an investment's past or potential performance is not, and should not be construed as, a recommendation or as a guarantee of any specific outcome or profit.