
Last week, the US economic releases presented a mixed outcome, with notable strengths in metrics such as CPI, Core CPI, PPI, initial jobless claims, and the Philadelphia FED Manufacturing index. However, this positive news was counterbalanced by disappointing figures in housing starts, building permits, and retail sales. This mixed bag of economic data contributed to a weaker dollar against XAU/USD.
On a weekly timeframe, the candlestick from last week resembles a hammer candlestick pattern. This hammer formation is particularly significant as it appeared around the mid-band of the Bollinger Bands with a 20-period setting, indicating that market may have found support around the mid band or the hammer candlestick's range. Additionally, the Bollinger Bands on the weekly timeframe are contracting, signaling low volatility in the market.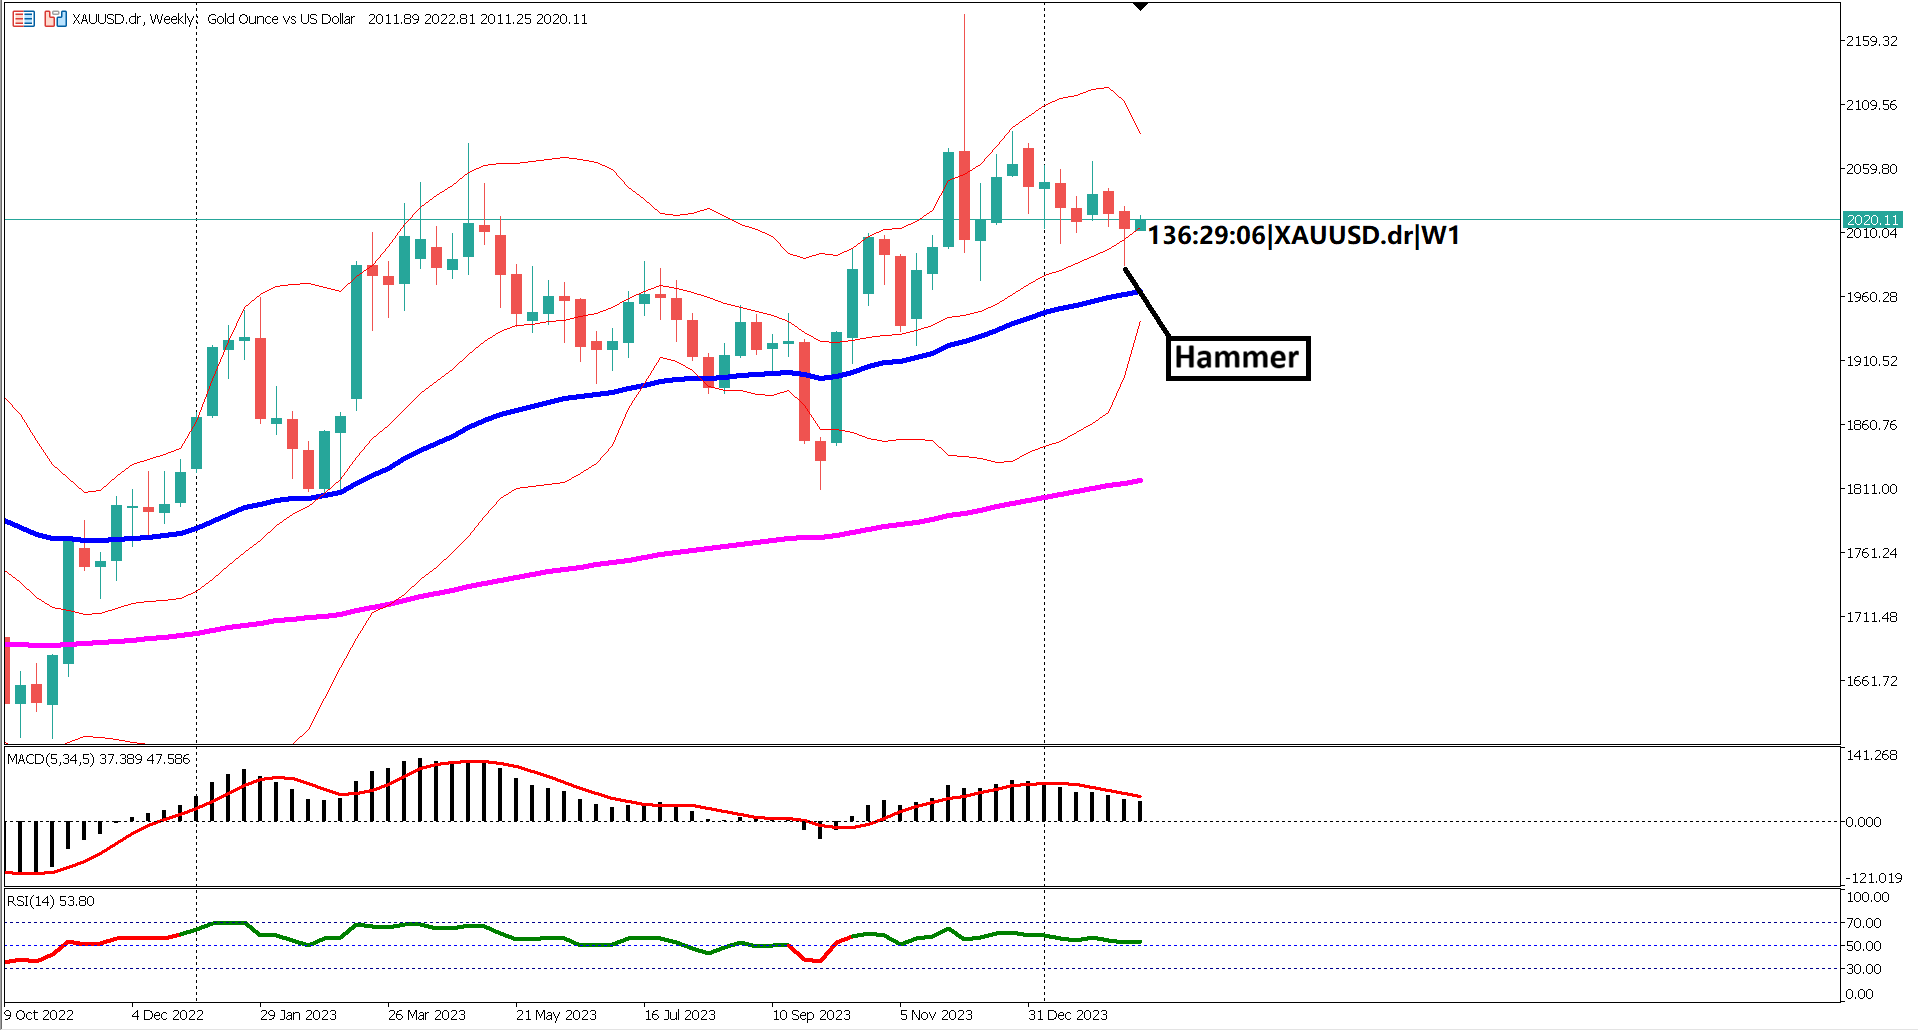
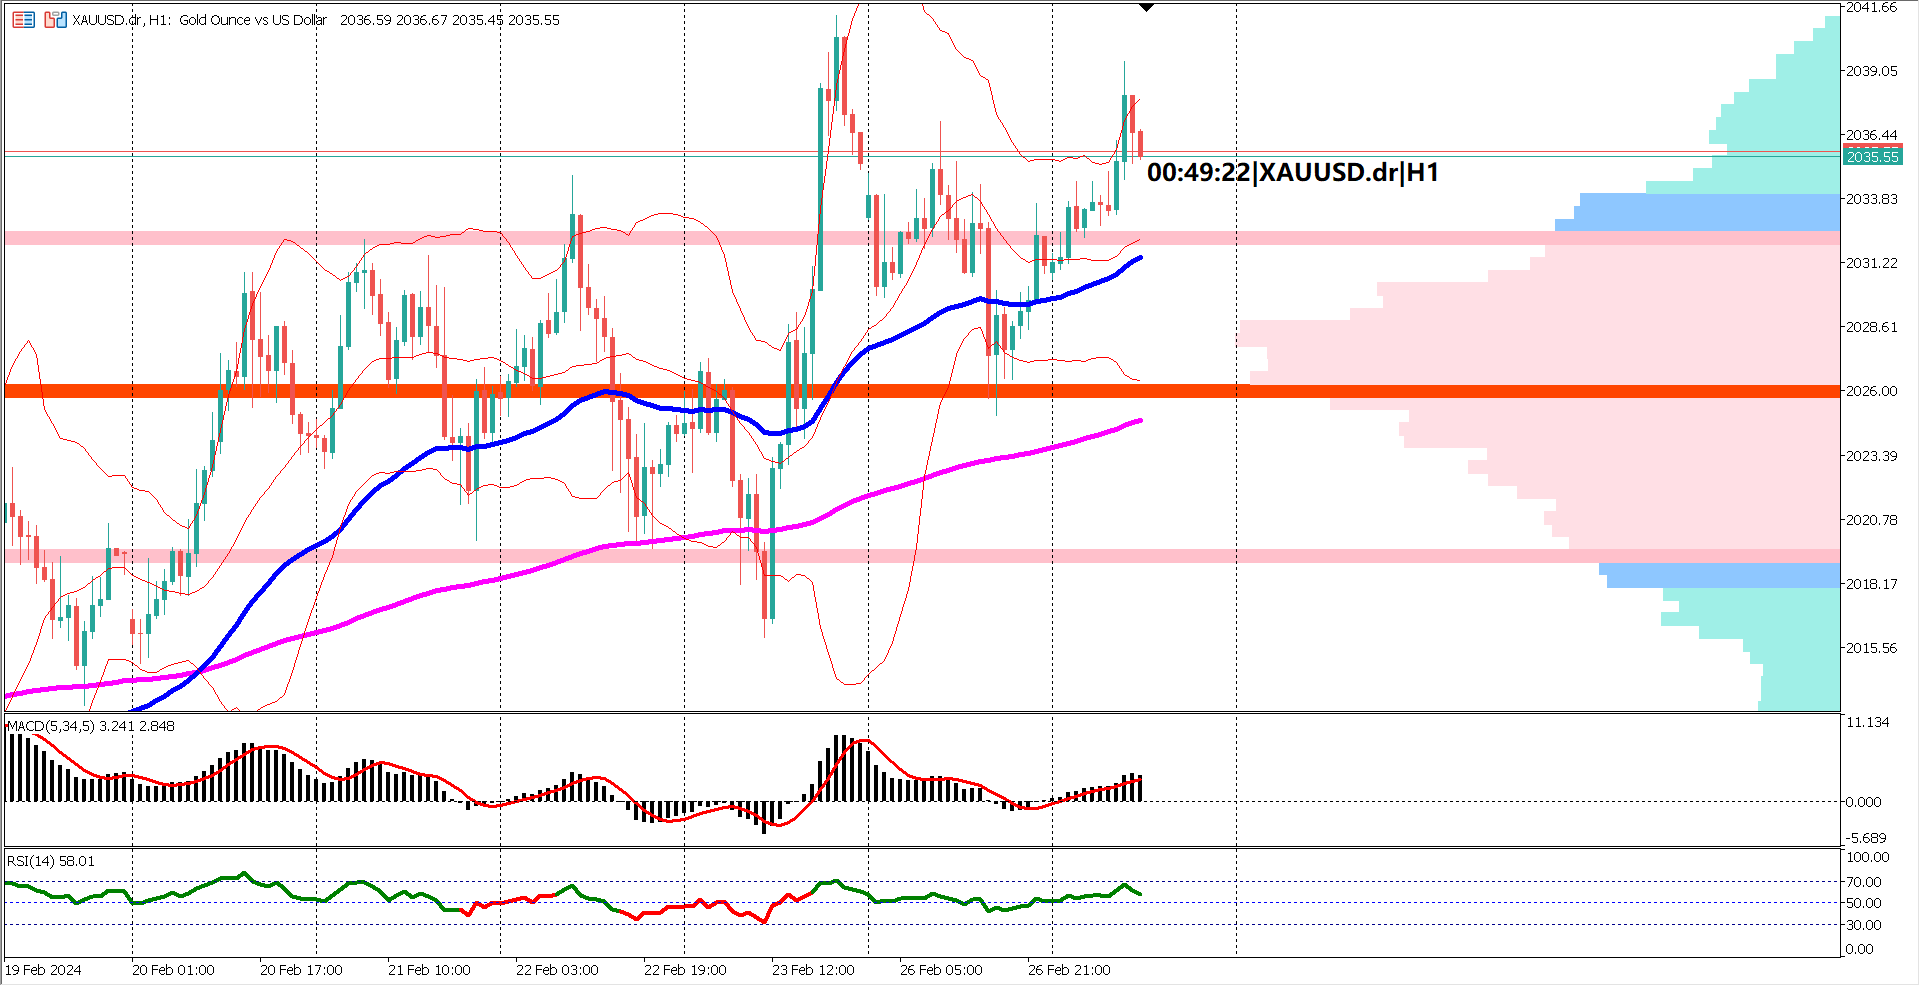
Zooming in on lower timeframes, the market has retraced around 50% of the previous bearish rally and has broken above a descending trendline. However, there is a potential resistance level at the 50% retracement, coinciding with a previous bearish engulfing candlestick pattern observed on February 13, 2024. It's likely that this recent bullish rally will retrace, possibly retesting the recent swing low around $1997-$2000. If this level holds, validated by a bullish engulfing pattern, it could indicate further upside potential.
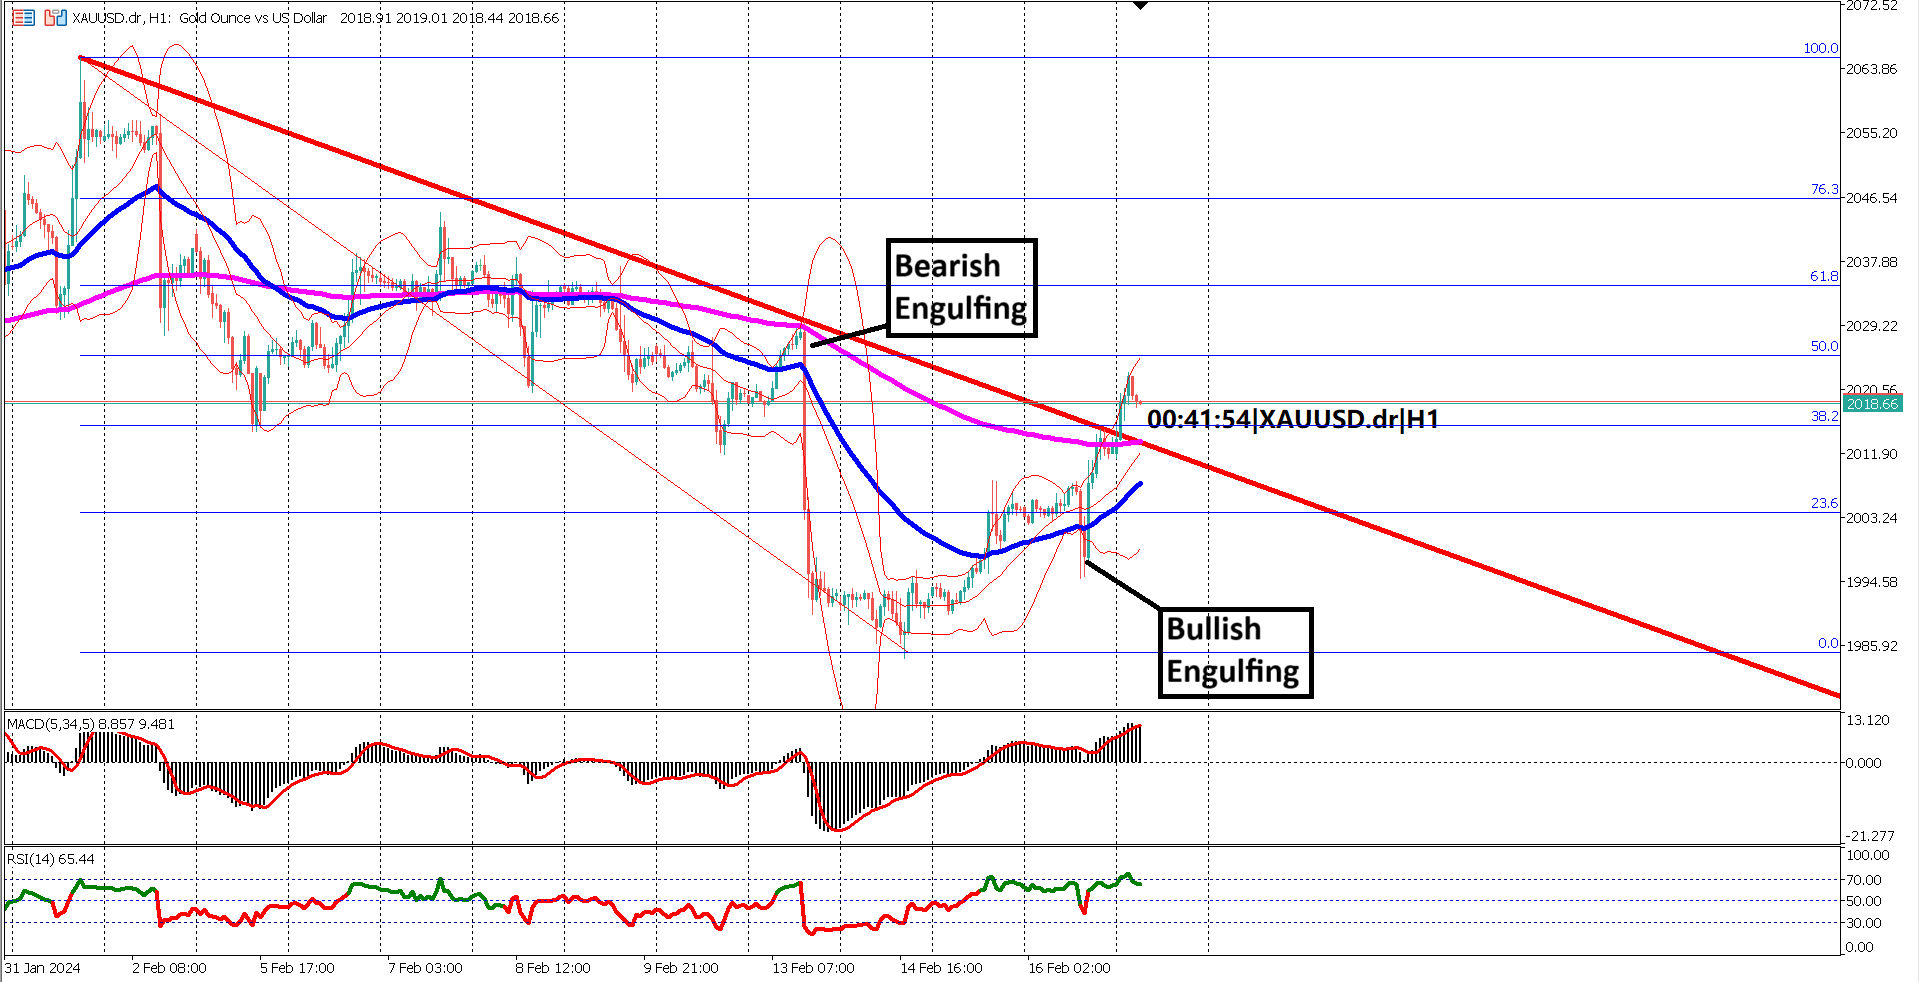
Furthermore, prices have broken above the EMA 200, with the EMA 50 converging towards it. These moving averages suggest that bullish momentum is building and attempting to reverse the market sentiment to bullish.
Analyzing the MACD and RSI indicators reinforces the bullish outlook. The MACD's signal line is above the zero line, indicating bullish momentum, while the RSI has entered the overbought territory, suggesting a potential ceiling near the 50% Fibonacci retracement level.
In conclusion, a short-term bearish trend is expected as the market has reached the 50% retracement of the previous bearish move. Key support levels to monitor are around $1997; a break below this level could lead to further downside. However, if this support holds, we may witness XAU/USD continuing its upward trajectory, potentially trading above $2000.
1. Mixed US economic data drove the dollar lower against XAU/USD.
2. Weekly candlestick resembles a hammer pattern, signaling potential bullish reversal.
3. Market retraced 50% of the bearish rally and broke above a descending trendline.
4. Resistance expected at the 50% retracement level, with potential support around $1997-$2000.
5. Bullish momentum building as prices break above EMA 200 and EMA 50 converges.
6. MACD and RSI indicators support bullish sentiment, though caution is advised near the 50% Fibonacci retracement level.
7. Short-term bearish trend expected, with key support at $1997 and potential for further upside above $2000 if support holds.
Forecast 0.7% vs Previous -4.9%

Trading foreign exchange on margin carries a high level of risk, and may not be suitable for all investors. Before deciding to trade foreign exchange you should carefully consider your investment objectives, level of experience, and risk appetite.
Nothing contained in this website should be construed as investment advice. Any reference to an investment's past or potential performance is not, and should not be construed as, a recommendation or as a guarantee of any specific outcome or profit.