
In the ever-evolving landscape of Forex trading, TRXUSD, the trading pair representing TRON against the US dollar, is currently navigating a complex market scenario. As we analyze the key aspects, it becomes evident that the market is poised for potential shifts, presenting both challenges and opportunities.
On the 4-hour chart, TRXUSD is intricately coiling within the confines of a symmetrical triangle. This pattern, which has been unfolding over the past month, is indicative of market indecision and a lack of clear bullish momentum.
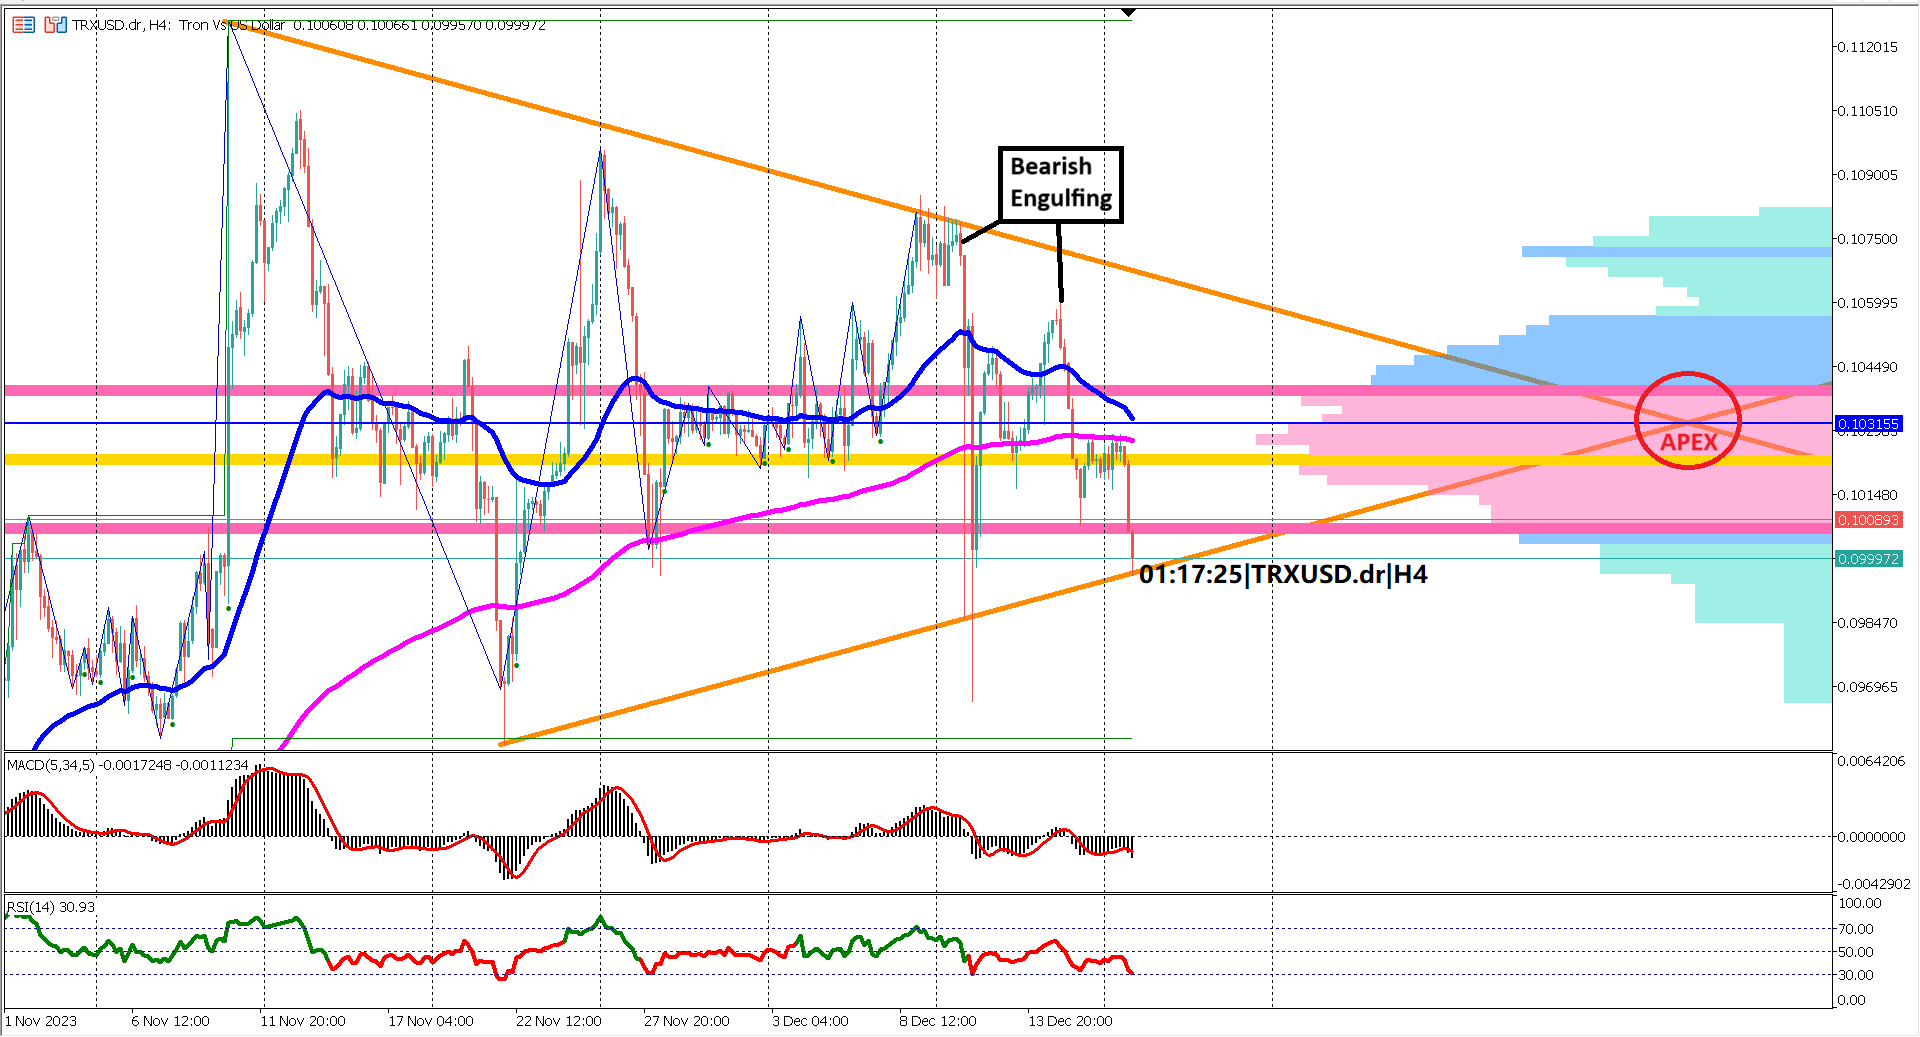
A noteworthy observation is the convergence of the EMA 50 and EMA 200, signaling a diminishing bullish momentum. The coiling of these exponential moving averages often precedes a significant market move, making it a crucial aspect to monitor.
Adding bearish pressure to the TRXUSD pair, bearish engulfing candlestick patterns have emerged near the upper side of the symmetrical triangle. The key resistance level is identified at the apex of the triangle, marked by a red circle, residing at 0.10315.
Critical support levels are identified at the ascending trendline (orange) and 0.10056, representing the lower line of the value area determined by the volume profile indicator (pink horizontal line). A breach below these supports, particularly accompanied by a death cross of the EMA 50 and EMA 200, could confirm a bearish reversal.
Examining the oscillator indicators reveals bearish signals. The MACD histogram and signal line are positioned below the 0 line, indicative of a bearish trend. The RSI, having broken below the 40% level, is hovering below 60%, further reinforcing the bearish sentiment.
TRXUSD is currently exhibiting signs of waning bullish momentum as it forms a symmetrical triangle pattern. The emergence of bearish signals from both bearish engulfing patterns and oscillator indicators suggests a cautious market sentiment. A strong confirmation for a bearish reversal would entail a break of key support levels, the symmetrical triangle pattern, and the occurrence of a death cross in the EMA 50 & EMA 200. Traders are advised to monitor these crucial levels and await confirmatory signals before making informed trading decisions in this dynamic market environment.
Forecast 85.8 vs Previous 85.2
Forecast 89.5 vs Previous 89.4
Forecast 87.8 vs Previous 87.3

Trading foreign exchange on margin carries a high level of risk, and may not be suitable for all investors. Before deciding to trade foreign exchange you should carefully consider your investment objectives, level of experience, and risk appetite.
Nothing contained in this website should be construed as investment advice. Any reference to an investment's past or potential performance is not, and should not be construed as, a recommendation or as a guarantee of any specific outcome or profit.