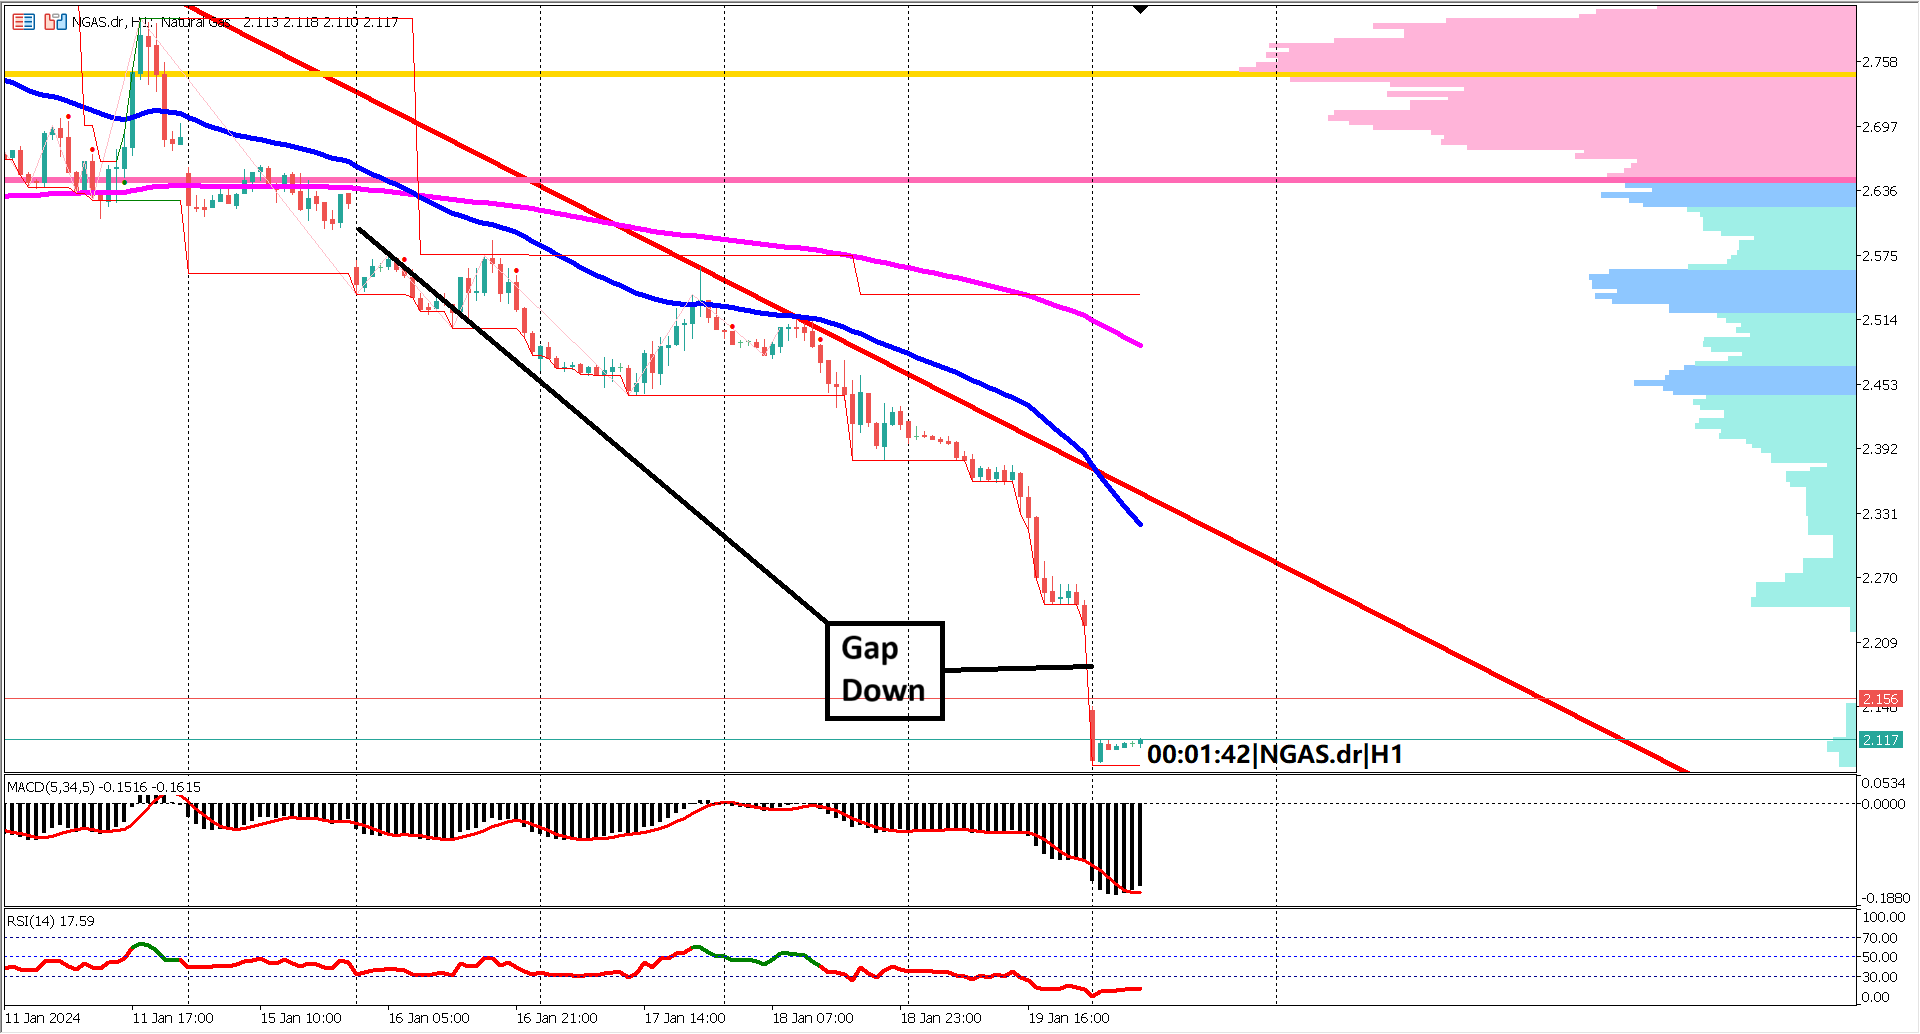

Natural Gas (NGAS) has recently embarked on a recovery journey, signaling a potential shift in sentiment after enduring over a month of consistent decline. The market saw NGAS prices plummet from $3.69 to a low of $2.186, marking a significant 40% downturn. However, recent developments suggest a newfound resilience in NGAS as it navigates key technical levels and breaks free from the shackles of a prolonged bearish trend.
A pivotal moment in NGAS's recovery was the establishment of a floor at $2.186, a level confirmed by the emergence of a bullish engulfing candlestick pattern. This bullish reversal signal, coupled with the break of a bearish trendline on an hourly timeframe chart, provided a clear indication that NGAS was poised for an upward move.
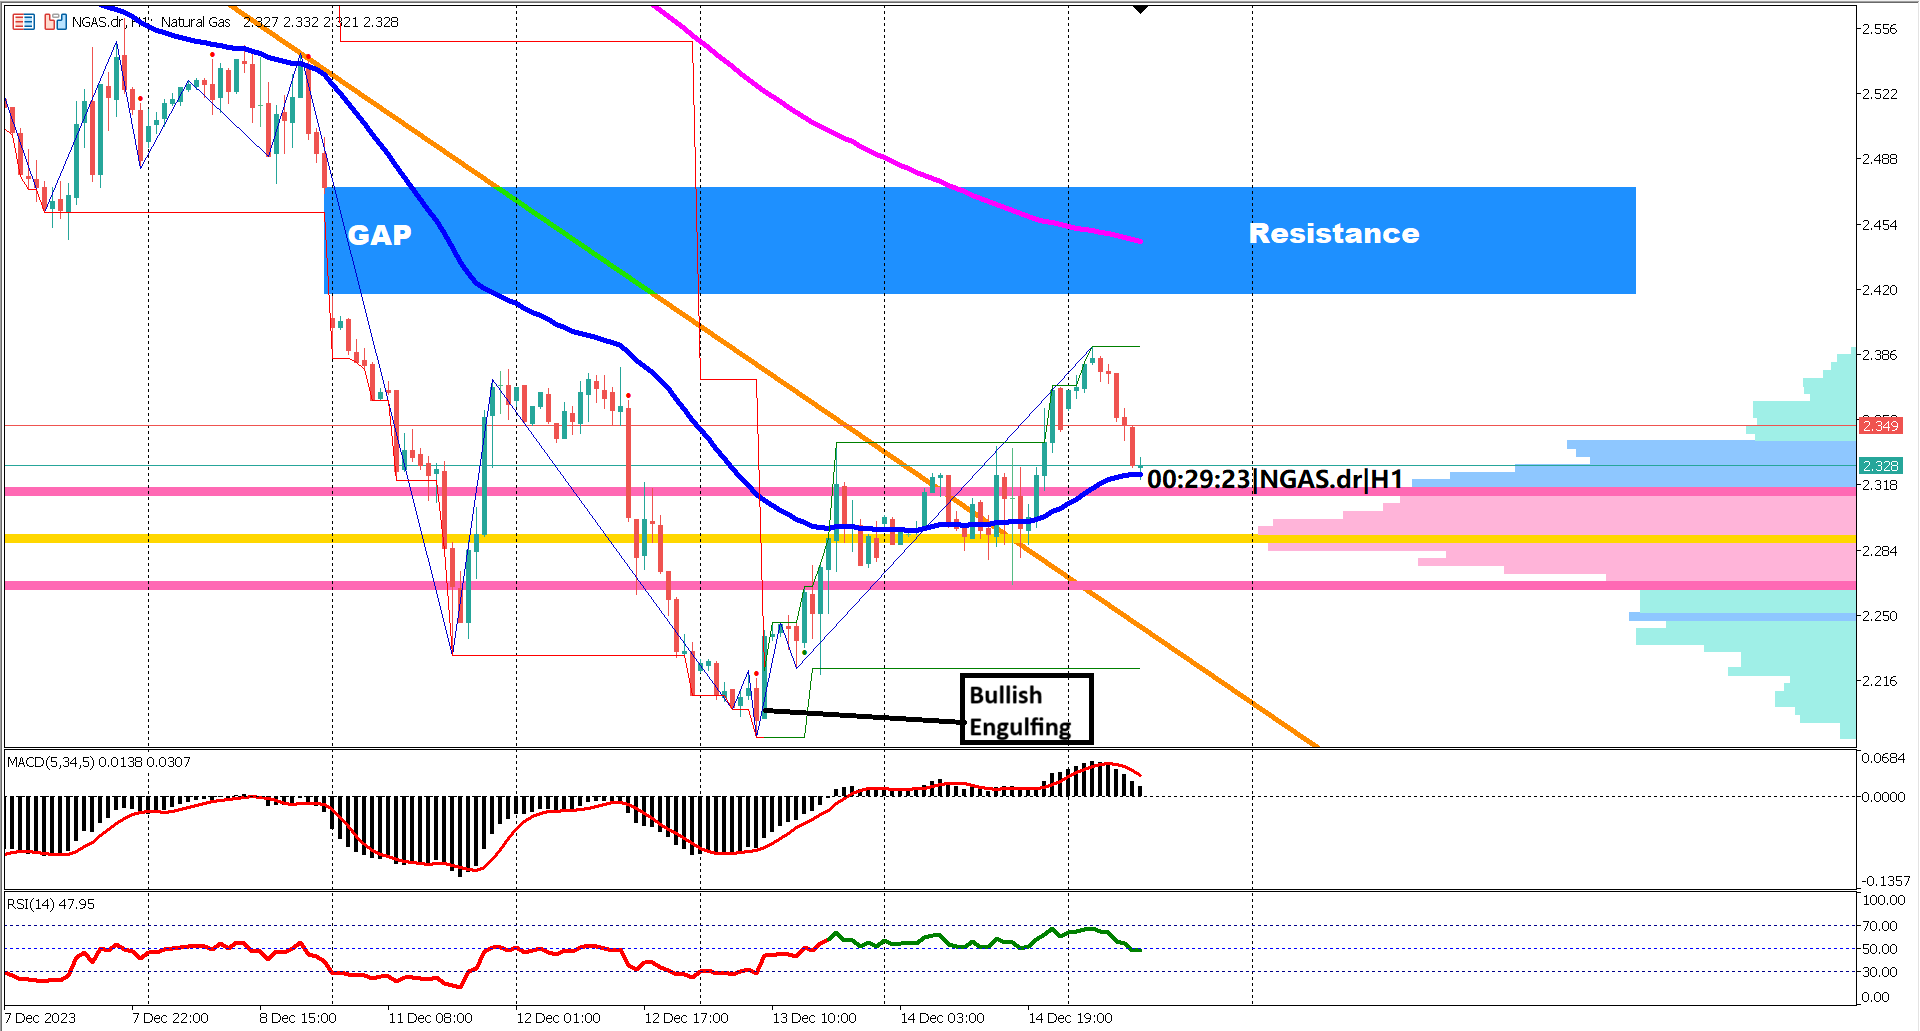
A noteworthy technical development is the breach of a bearish trendline that originated from the high of December 5, 2013 ($2.751) and extended to the high of December 8, 2013 ($2.543). This breakthrough marked a crucial milestone in NGAS's recovery journey, opening the door to further potential gains.
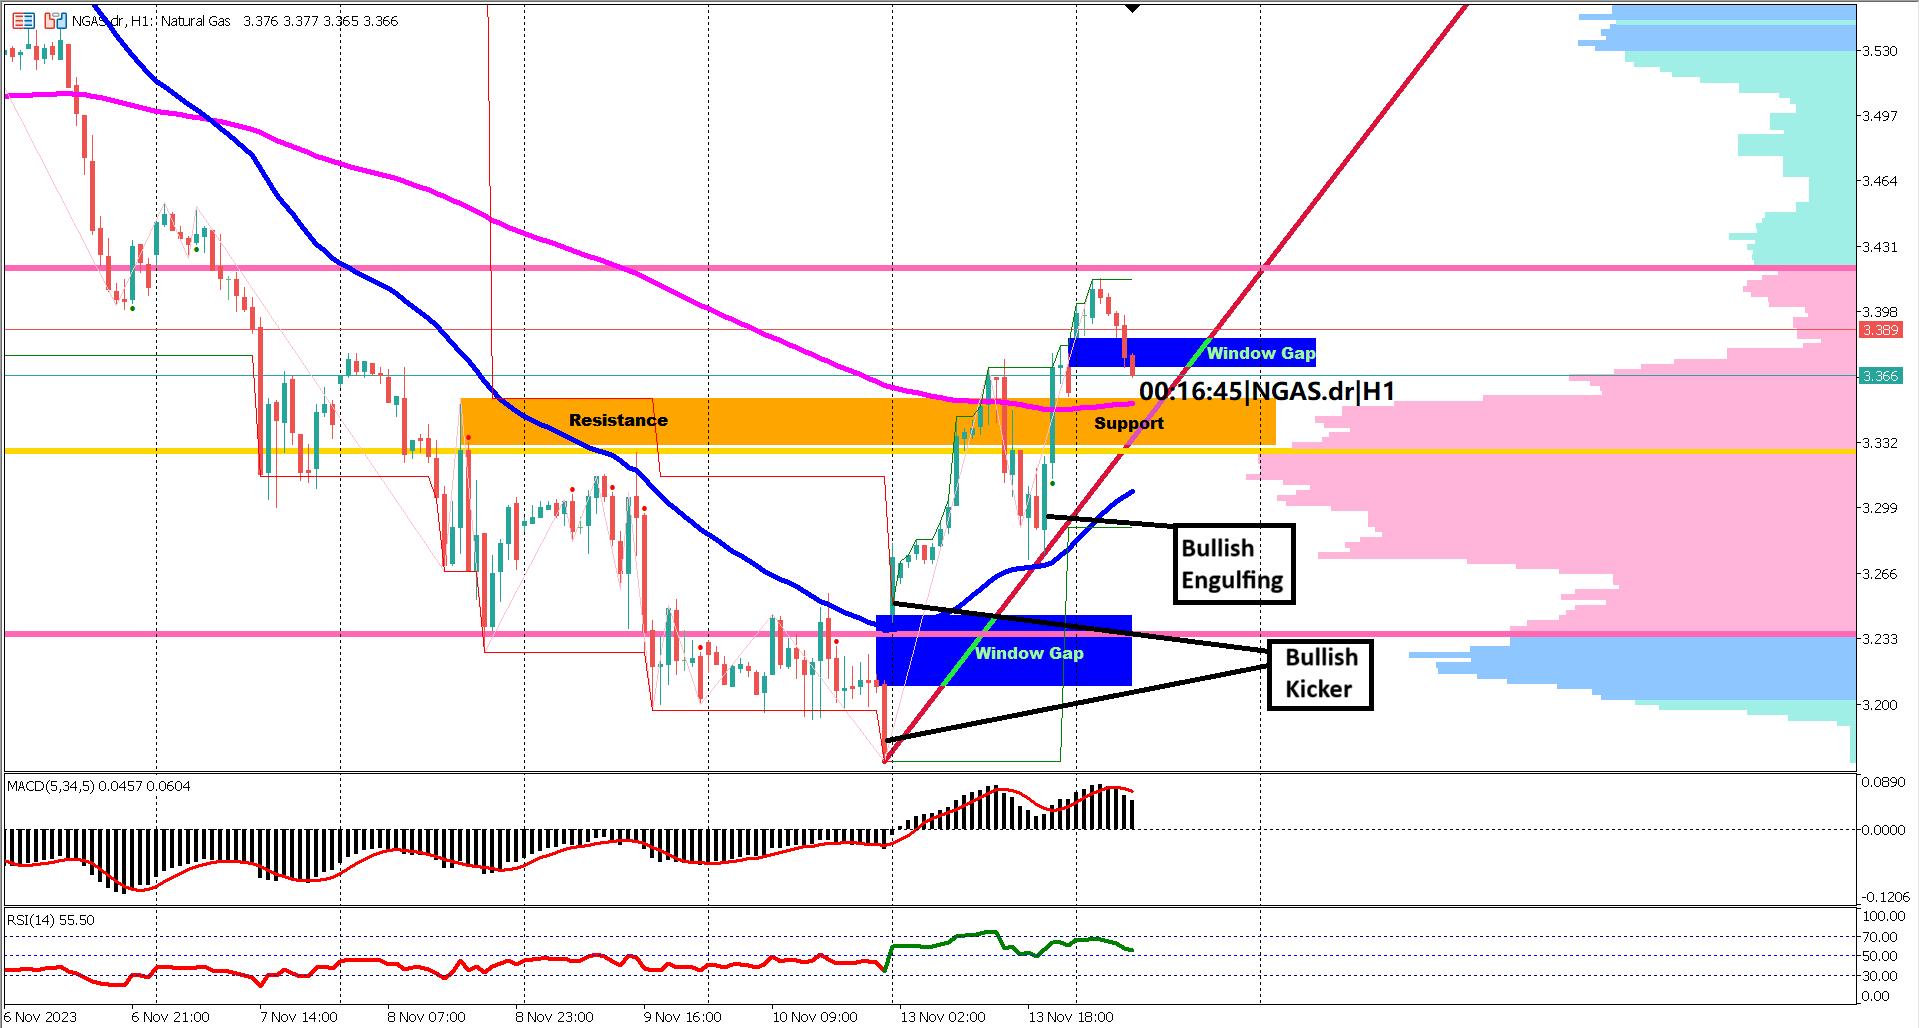
As NGAS cautiously approaches the downside gap candlestick pattern (enclosed in a blue rectangle) between the price levels of 2.474 and 2.417, traders are vigilant for potential resistance within this zone. The behavior of NGAS within this area will likely dictate the near-term trajectory of the commodity.
Examining the EMA 50 & 200, the prevailing trend remains bearish; however, signs of a potential shift are emerging. Convergence between the two EMAs suggests a weakening bearish momentum, and a crucial juncture awaits as NGAS approaches the EMA 200. A successful breach of this level may culminate in a golden cross, traditionally considered a bullish signal.
Oscillator indicators further support the notion of a bullish undertone. Both the MACD histogram and signal line comfortably reside above the 0 level, reflecting positive momentum. The Relative Strength Index (RSI) has ventured beyond the 60% level, reinforcing the bullish sentiment. Traders keenly watch RSI movements, anticipating a continued bullish trend as long as it remains above the 40% level.
In summary, NGAS is navigating a complex landscape, characterized by a bearish backdrop with hints of a budding recovery. Traders should remain vigilant,
monitoring key resistance levels, EMAs, and oscillator indicators for potential shifts in momentum. The road to a full reversal may still be ahead, contingent on NGAS overcoming critical hurdles and establishing a robust bullish trend.
Forecast 49.3 vs Previous 49.4
Forecast 220k vs Previous 220k
Forecast 50.6 vs Previous 50.8

Trading foreign exchange on margin carries a high level of risk, and may not be suitable for all investors. Before deciding to trade foreign exchange you should carefully consider your investment objectives, level of experience, and risk appetite.
Nothing contained in this website should be construed as investment advice. Any reference to an investment's past or potential performance is not, and should not be construed as, a recommendation or as a guarantee of any specific outcome or profit.