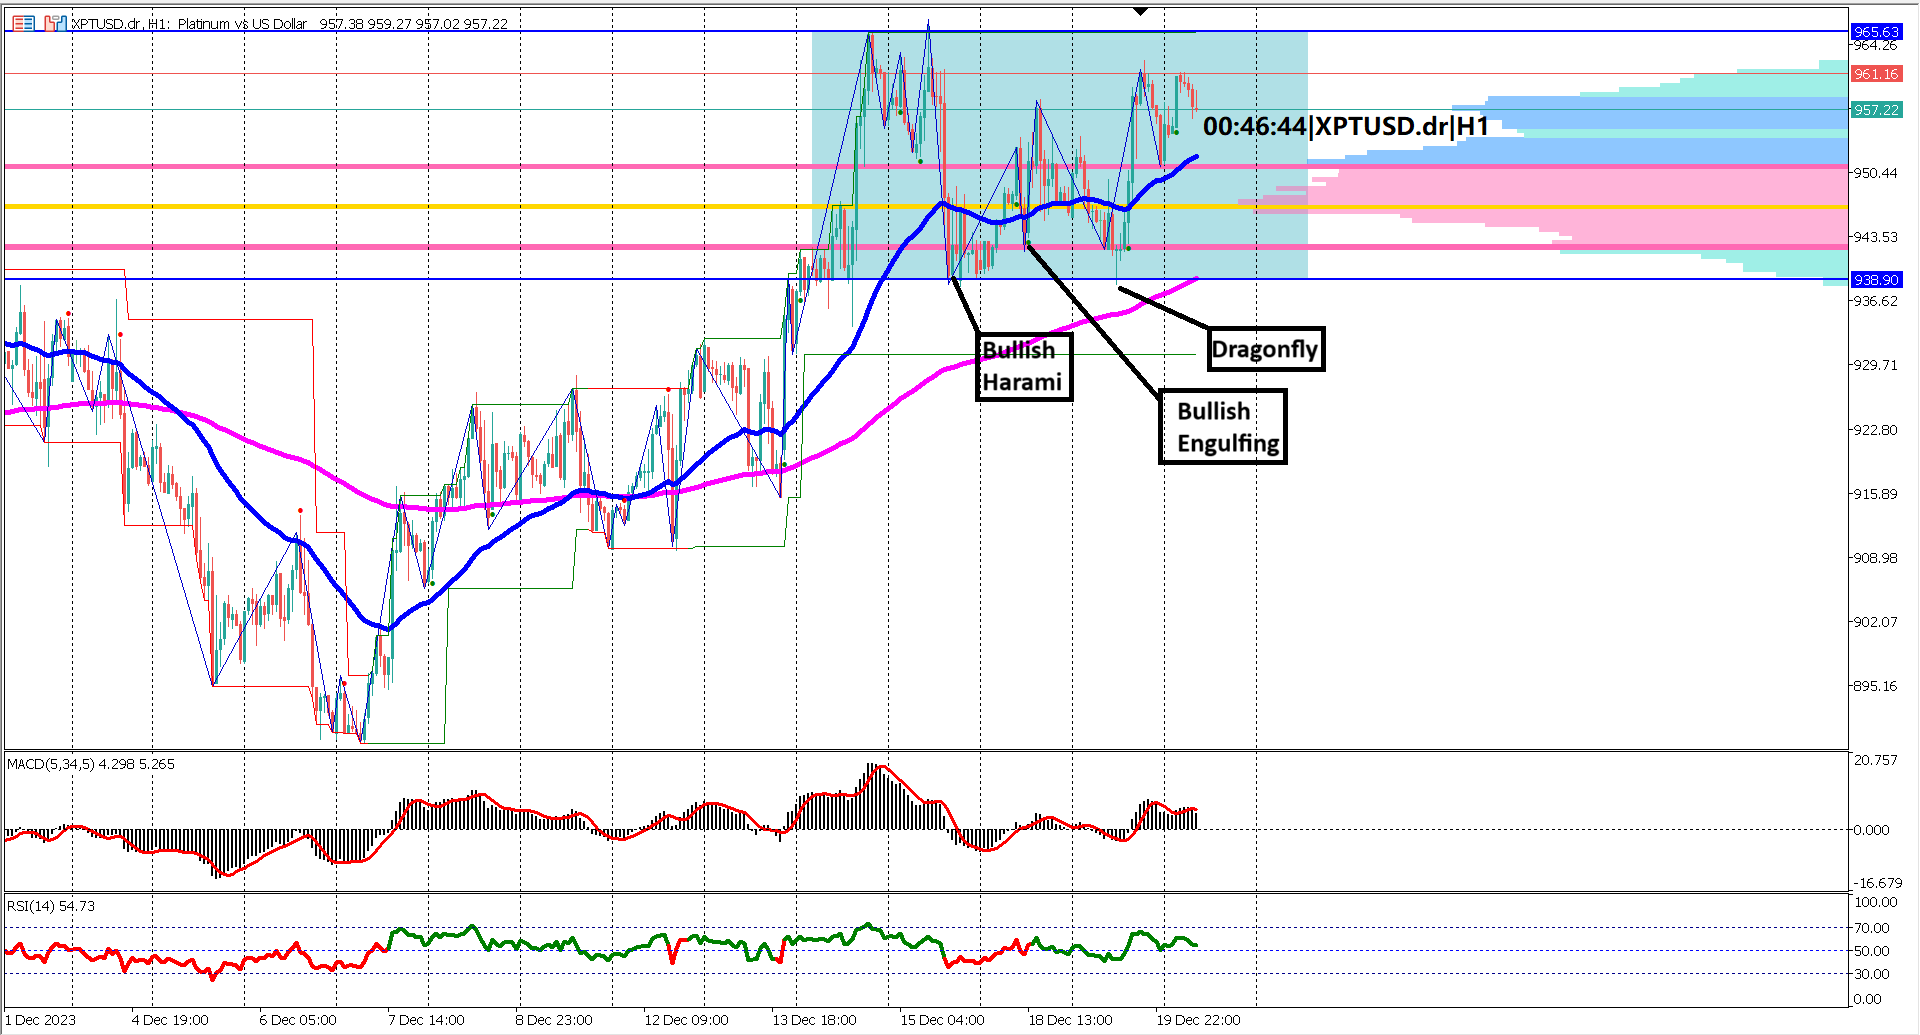
Platinum (XPTUSD) has embarked on a captivating journey, characterized by a distinctive rectangle chart pattern that emerged after a notable bullish rally from December 6 to December 13, spanning a week. Delving into the intricacies of this chart pattern and considering various technical indicators, here's an in-depth analysis of Platinum's current landscape:
The market landscape reveals that Platinum is currently encapsulated within a rectangle chart pattern, demarcated by a blue rectangle. This pattern, emerging after a bullish rally, typically signifies either a re-accumulation phase or a potential continuation of the prevailing bullish trend.

The size of the rectangle spans approximately 260 pips, with the upper boundary (ceiling) positioned at 965.63 and the lower boundary (floor) at 938.90. The confines of this pattern hold vital clues about potential market dynamics, offering traders a framework for decision-making.
For traders eyeing potential opportunities, the breakout scenarios from the rectangle pattern are crucial considerations. A breakout above the ceiling of the rectangle suggests a continuation of the bullish trend, while a break below the floor may indicate a potential bearish reversal.
While the floor of the rectangle pattern is susceptible to a bearish breakout, several bullish candlestick patterns, including Bullish Harami, Bullish Engulfing, and Dragonfly, lend support. These patterns signal a robust support level, potentially acting as a resilient floor against downward pressure.
A fundamental aspect of Platinum's current momentum lies in the relationship between the EMA 50 and EMA 200. The bullish stance is evident as the EMA 50 surpasses the EMA 200, and both lines are diverging. This expansion signals strong momentum, a crucial factor for traders gauging the strength of the prevailing trend.
Analyzing the value area of the volume profile, highlighted with pink horizontal lines, reinforces the bullish sentiment. A bullish trend is validated when prices hover above the upper side of the value area. The lower side of the value area becomes a key support level. A breach below this level may indicate a potential reversal to a bearish trend.
Turning attention to oscillator indicators, both MACD and RSI corroborate the bullish narrative. The MACD histogram and signal line above the 0 line signify a bullish trend. Meanwhile, the RSI, positioned above 60%, underscores the bullish momentum. As long as RSI maintains its bullish stance above 40%, it supports the overall bullish outlook.
From a technical standpoint, Platinum (XPTUSD) is in a bullish phase, currently navigating a re-accumulation period. The rectangle chart pattern, coupled with supportive candlestick patterns and strong EMA dynamics, points to a resilient bullish trend. Traders should remain vigilant for potential signs of weakness, particularly if the EMA 50 & 200 converge, and the RSI dips below the 40% level. In this dynamic environment, strategic awareness and adaptability will be pivotal for traders aiming to capitalize on Platinum's bullish trajectory.
Trading foreign exchange on margin carries a high level of risk, and may not be suitable for all investors. Before deciding to trade foreign exchange you should carefully consider your investment objectives, level of experience, and risk appetite.
Nothing contained in this website should be construed as investment advice. Any reference to an investment's past or potential performance is not, and should not be construed as, a recommendation or as a guarantee of any specific outcome or profit.
