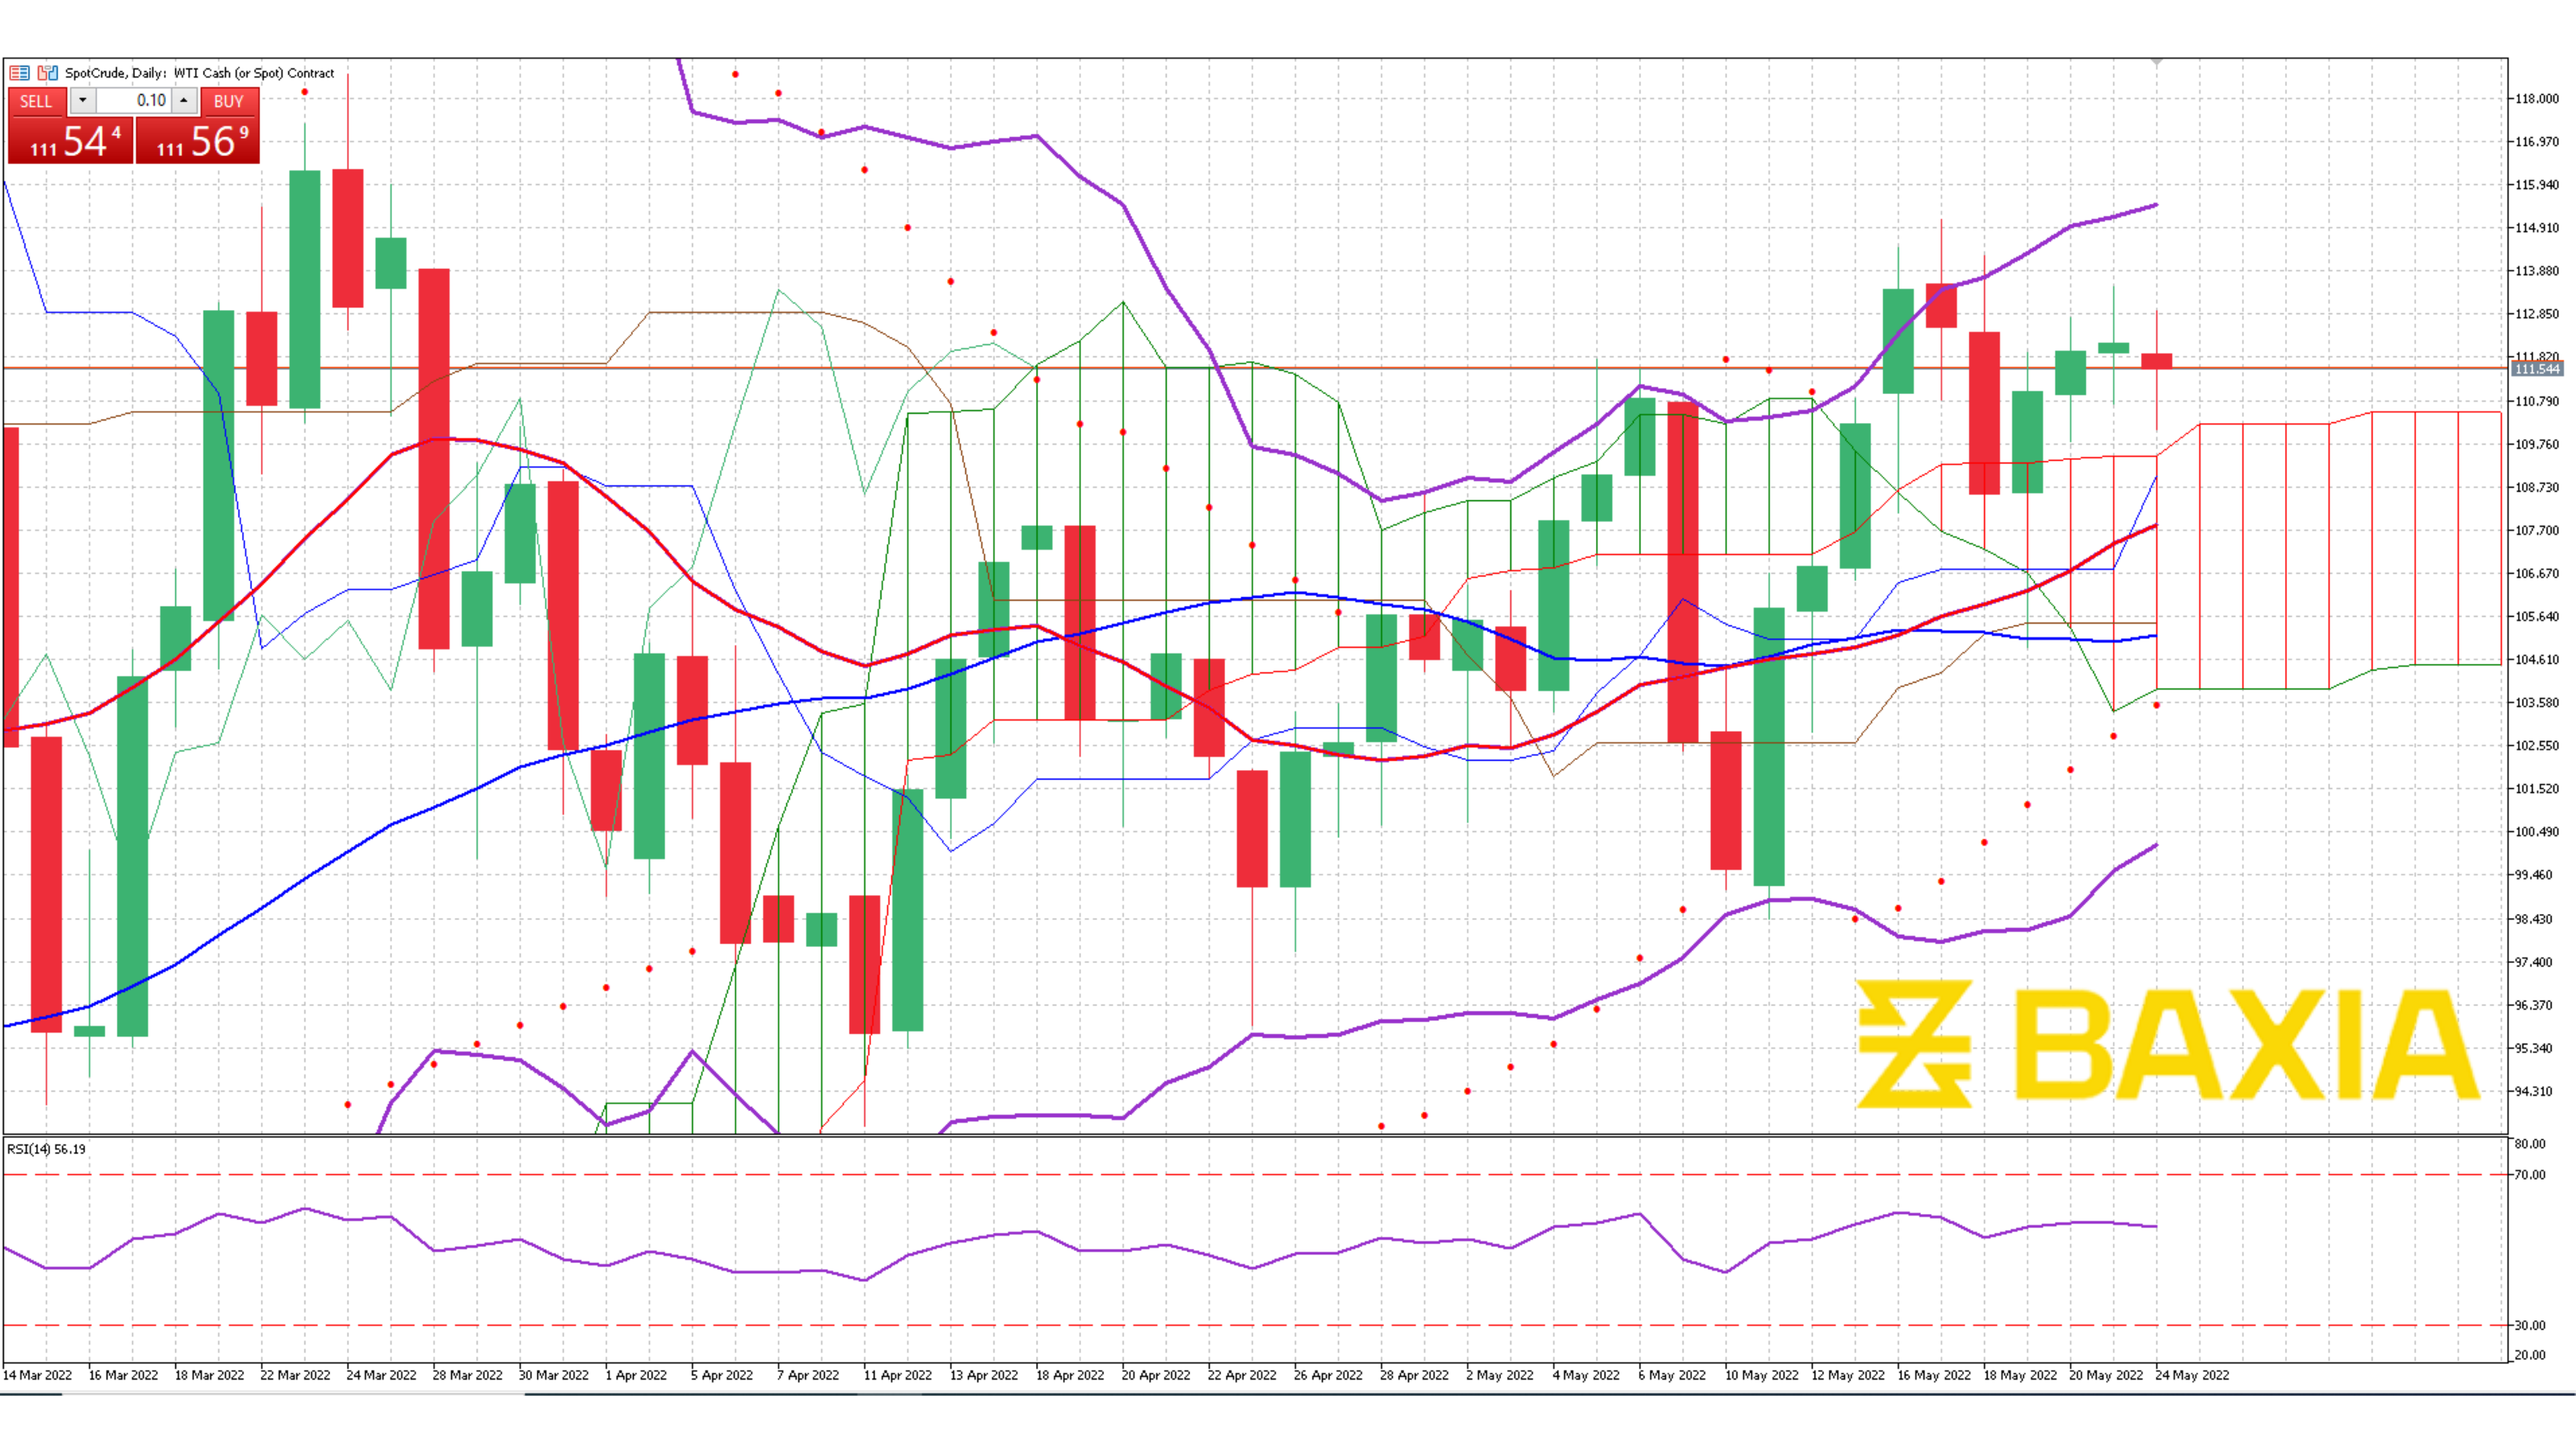

The energy commodity has not been able to pass the $110 mark in more than 25 trading days, the pair started a downtrend on the first third of March and showed some momentum shortly after. The support level at $93.308 proved to be strong so far and has been tested twice since early March.
The price is trading between the short and long-term moving averages, which indicates that the pair is likely to continue moving downwards in the upcoming sessions; however, the gap between the moving averages is narrow and a small rally could cause the lines to cross, which will indicate an uptrend.
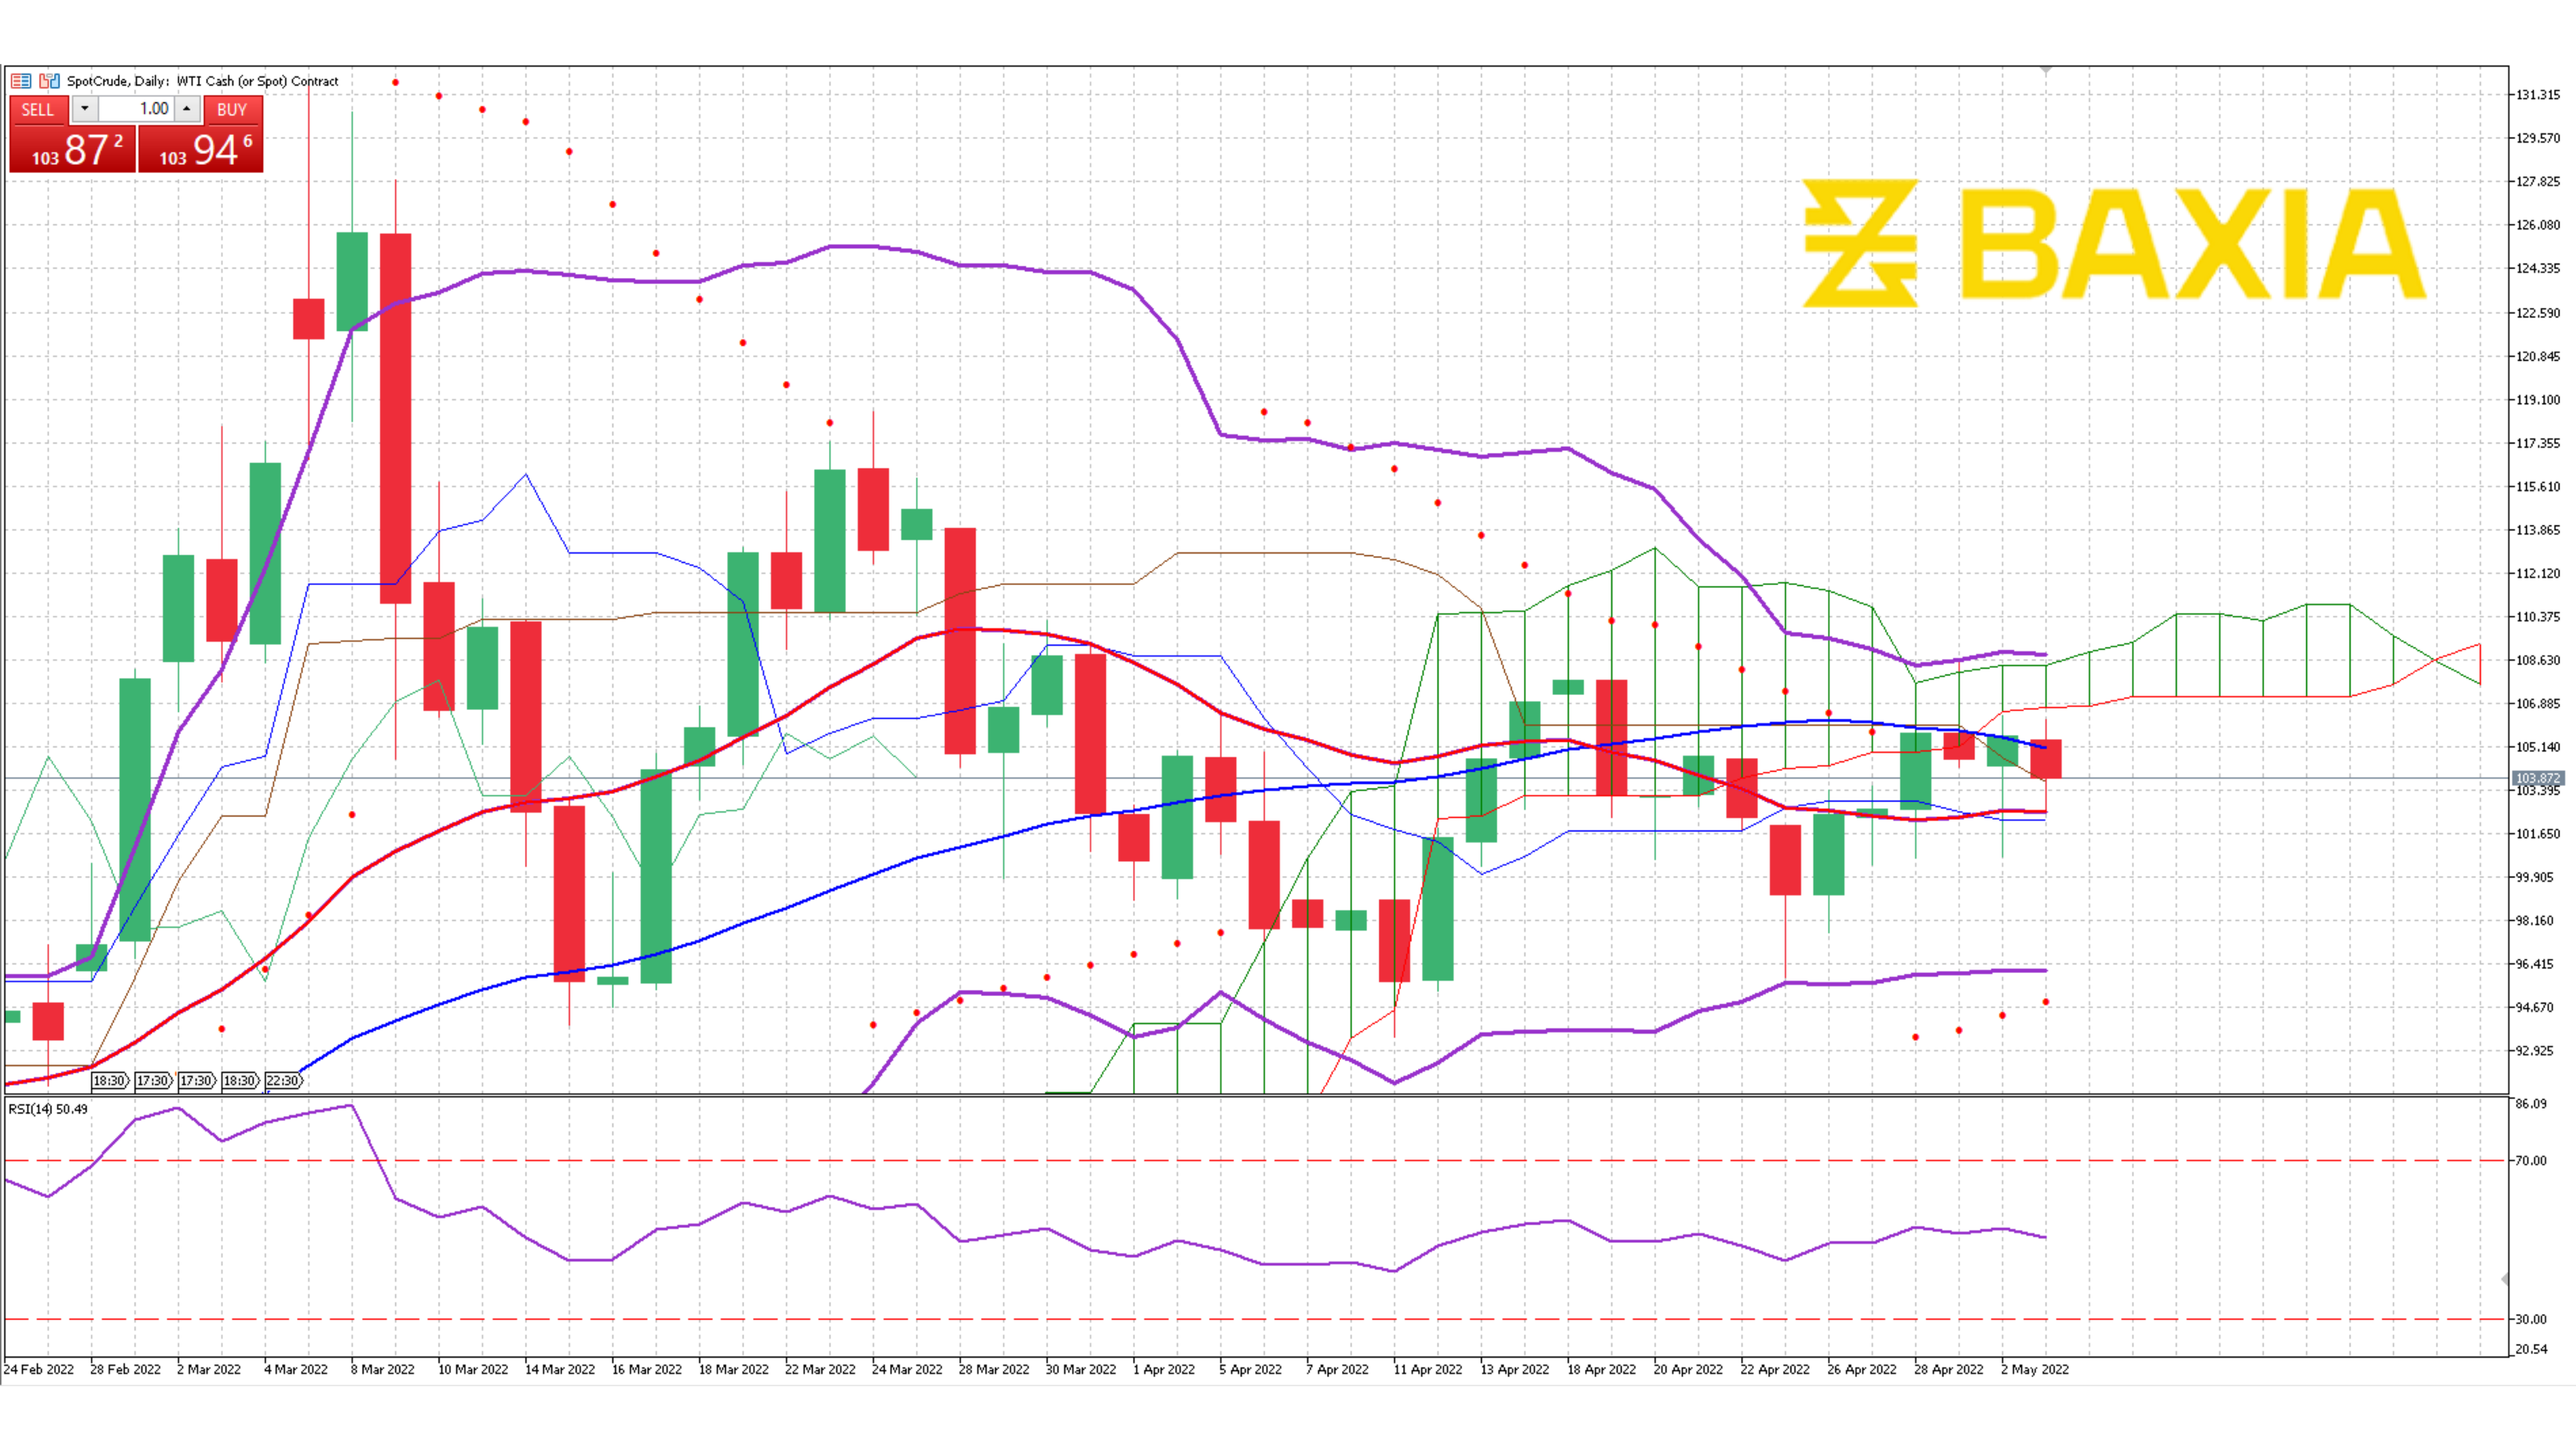
The Bollinger bands are narrow and volatility levels should be mild in the short term, the pair trades between the bands, suggesting that the price is at a fair price level. Our relative strength indicator is at 50% which will allow the pair to move in either direction, the trend continues to be downwards but our Parabolic SAR indicator suggests that the price will move upwards in the upcoming sessions.
We love to hear new ideas from traders and want to know what you think!
If you like this topic and want to suggest future topics that you find helpful, let us know by clicking the ‘submit your feedback’ button below.

Trading foreign exchange on margin carries a high level of risk, and may not be suitable for all investors. Before deciding to trade foreign exchange you should carefully consider your investment objectives, level of experience, and risk appetite.
Nothing contained in this website should be construed as investment advice. Any reference to an investment's past or potential performance is not, and should not be construed as, a recommendation or as a guarantee of any specific outcome or profit.