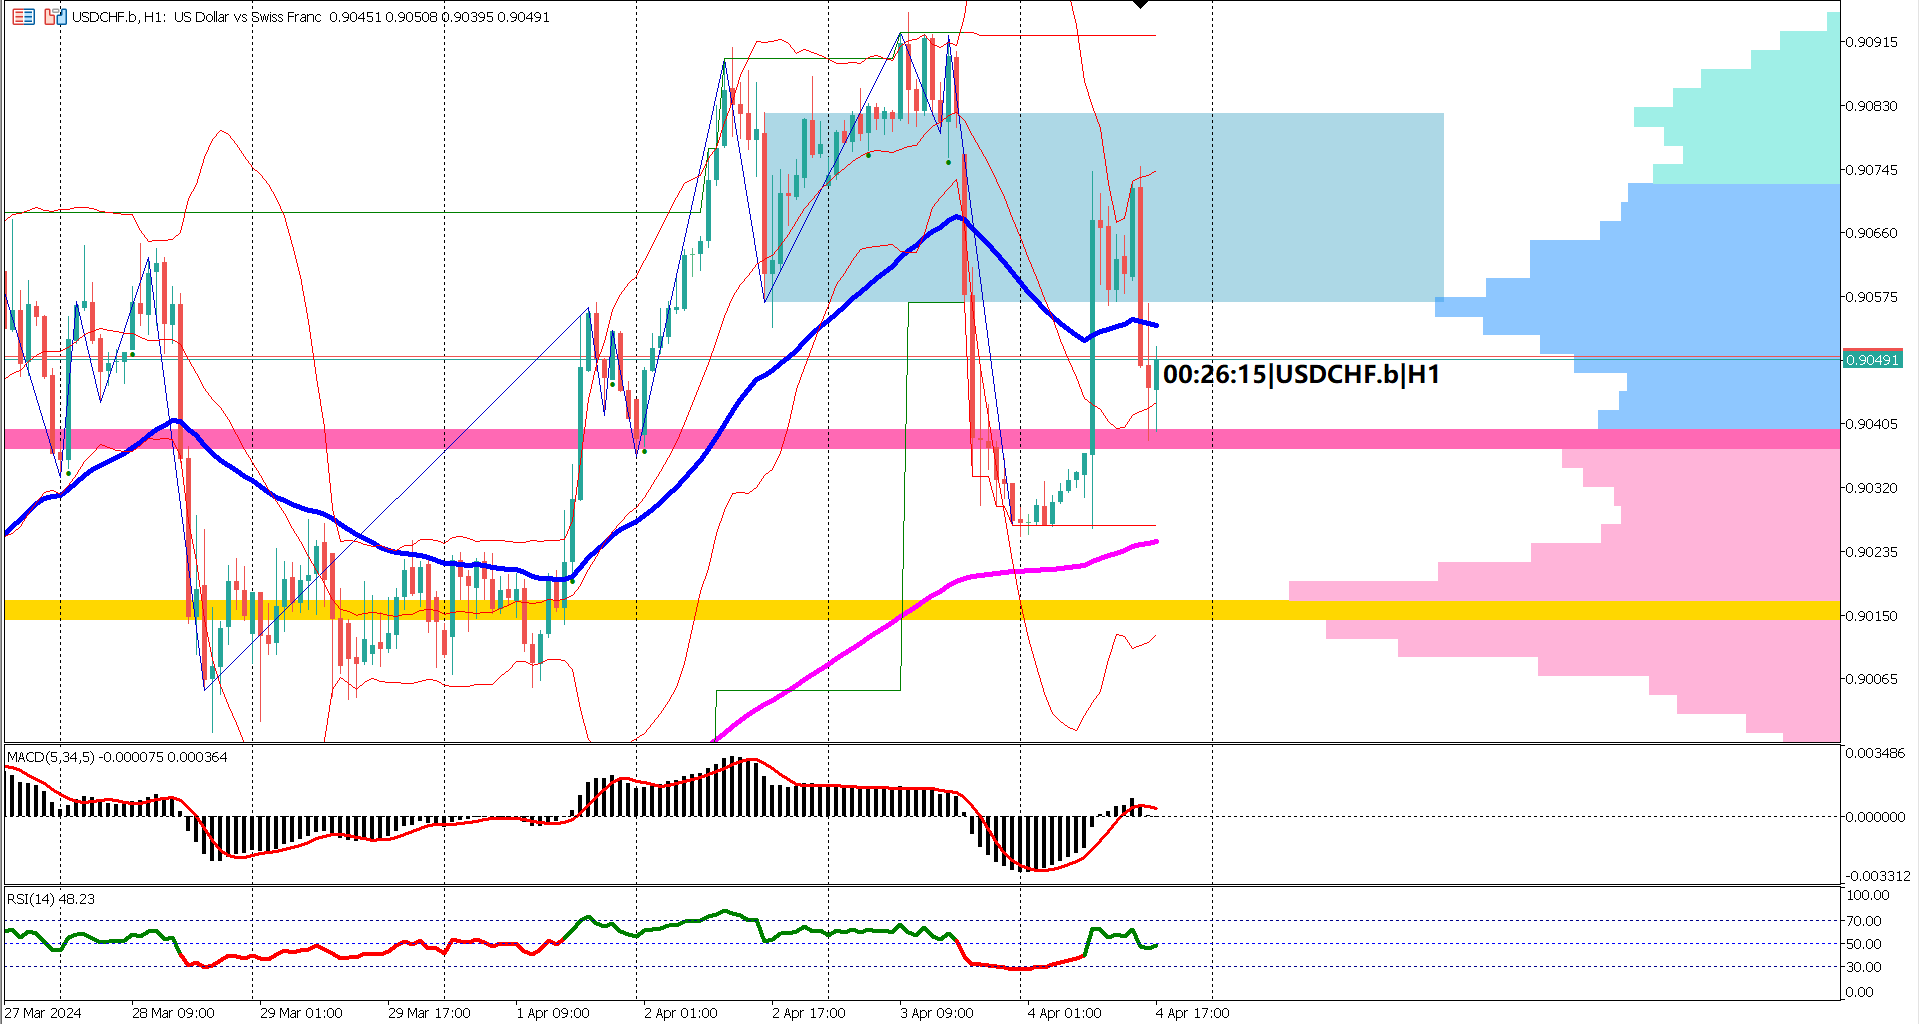

USDCHF finds itself navigating a deep correction, weaving through the intricacies of a descending triangle chart pattern. This corrective phase, gobbling up nearly half of the recent bullish rally initiated between January 5th and January 22nd, 2024, paints a complex landscape for traders to decipher.
As the day unfolds over the US trading session, the focus shifts to key economic releases from the US, centering around Consumer Confidence and JOLTs job openings. Economists project a conflicting forecast, anticipating higher consumer confidence at 115.0 versus the forecasted 110.7, alongside a dip in job openings to 8.750M from the previous 8.790M. The amalgamation of these mixed forecasts injects an element of uncertainty into USDCHF's recent bullish momentum.
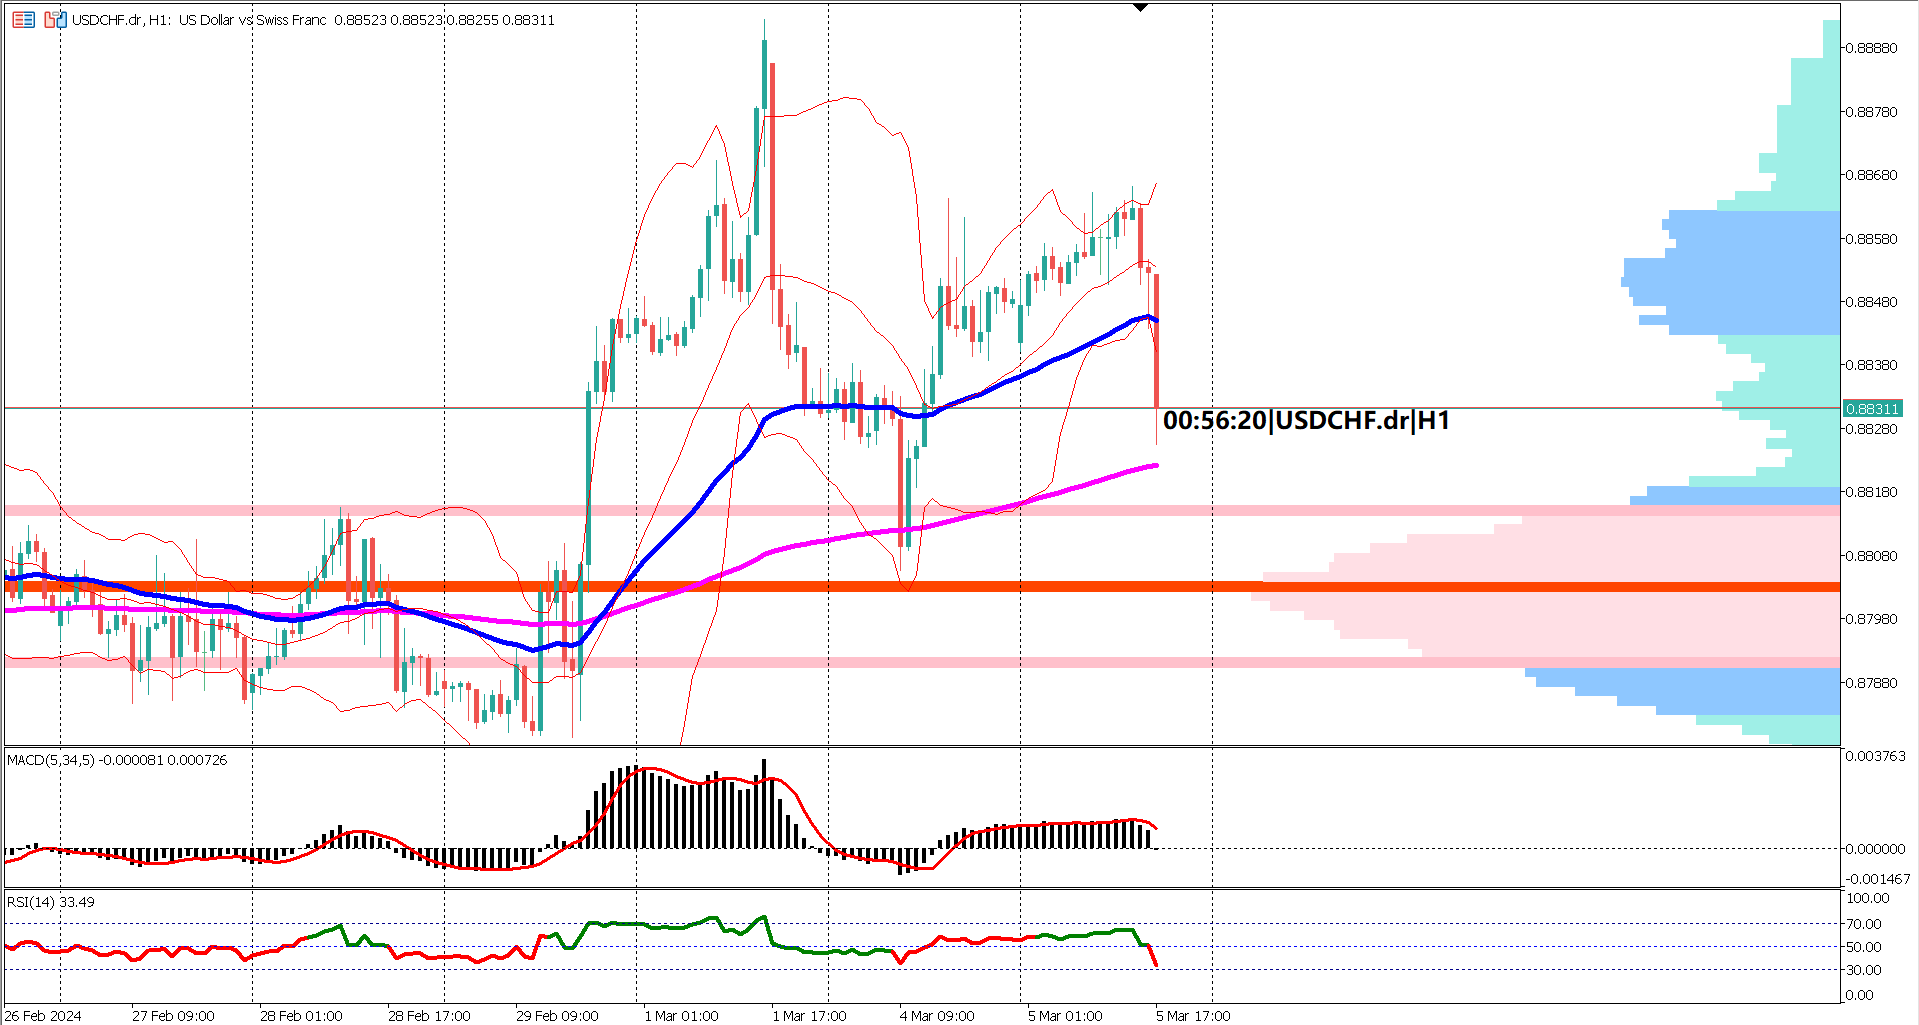
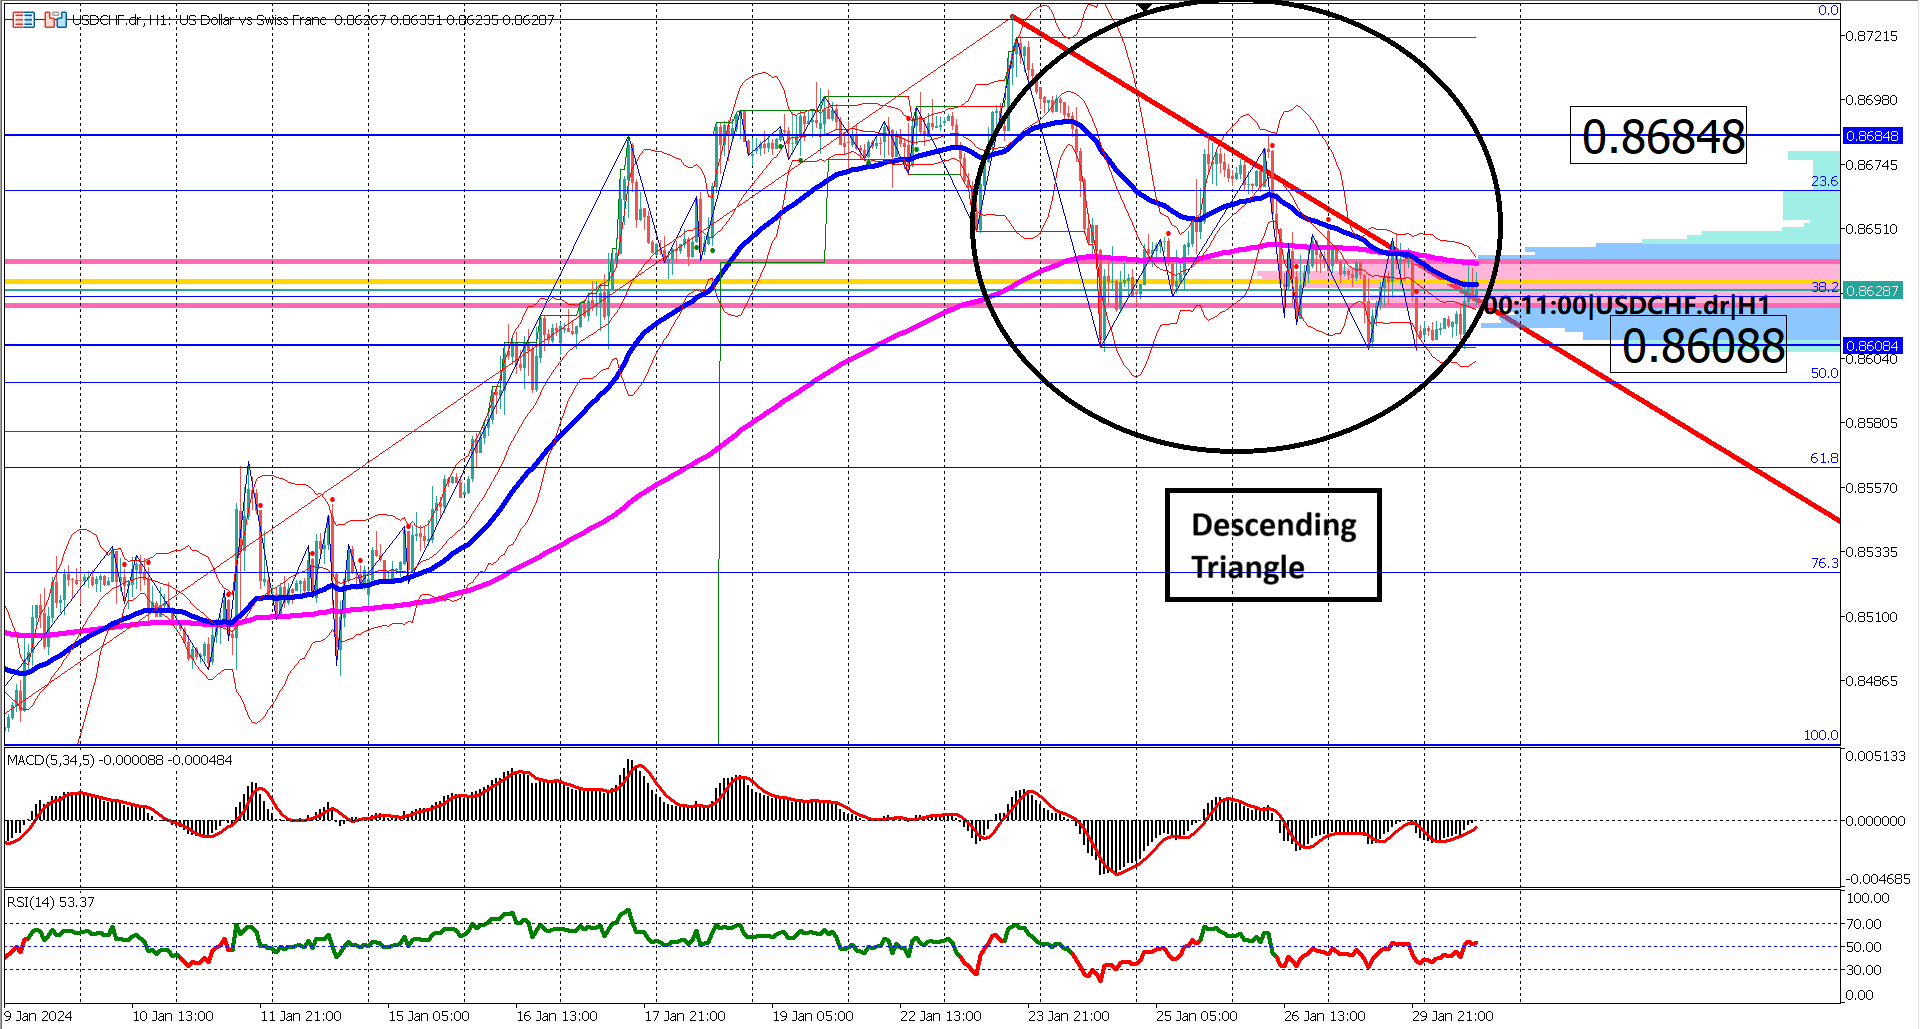 Critical support and resistance levels act as sentinel points for traders. The descending triangle's foundation, resting at 0.8608 and the Fibonacci 50% level, serves as a pivotal support zone. Conversely, the recent swing high at 0.8684, testing the previous higher low of the bullish rally, stands tall as a key resistance level.
A bearish signal emerges from the EMA 50 and 200, showcasing a death cross. The implications are clear – a breach of the descending triangle's base may unleash further weakness for the USDCHF pair.
The Bollinger Bands offer a visual cue to the prevailing bearish momentum. Over the last three trading days, prices have stubbornly resisted breaking above the upper band, while exhibiting multiple breaches below the lower band. This underlines the dominance of the bears in the current market sentiment.
Anticipation looms for a potential shift in the USDCHF narrative. A positive surprise in today's key economic releases could catalyze a resurgence, propelling prices beyond the key resistance and the descending triangle's confinements.
However, oscillators paint a less optimistic picture. Both the RSI and MACD tilt toward a bearish bias. The MACD's signal line and histogram persist below the 0 level, while the RSI, having breached the 40% level in the last three trading sessions, continues to linger below 60%.
In summation, USDCHF meanders in a sideways trend, with the fate of the descending triangle poised to sway based on the outcome of today's US economic news releases. Traders must remain vigilant, as these releases hold the potential to chart the course for USDCHF in the near term.
Forecast 0.0% vs Previous 0.0%
Forecast -0.1% vs Previous -0.1%
Forecast 115.0 vs Previous 110.7
Forecast 8.750M vs Previous -0.1%

Trading foreign exchange on margin carries a high level of risk, and may not be suitable for all investors. Before deciding to trade foreign exchange you should carefully consider your investment objectives, level of experience, and risk appetite.
Nothing contained in this website should be construed as investment advice. Any reference to an investment's past or potential performance is not, and should not be construed as, a recommendation or as a guarantee of any specific outcome or profit.