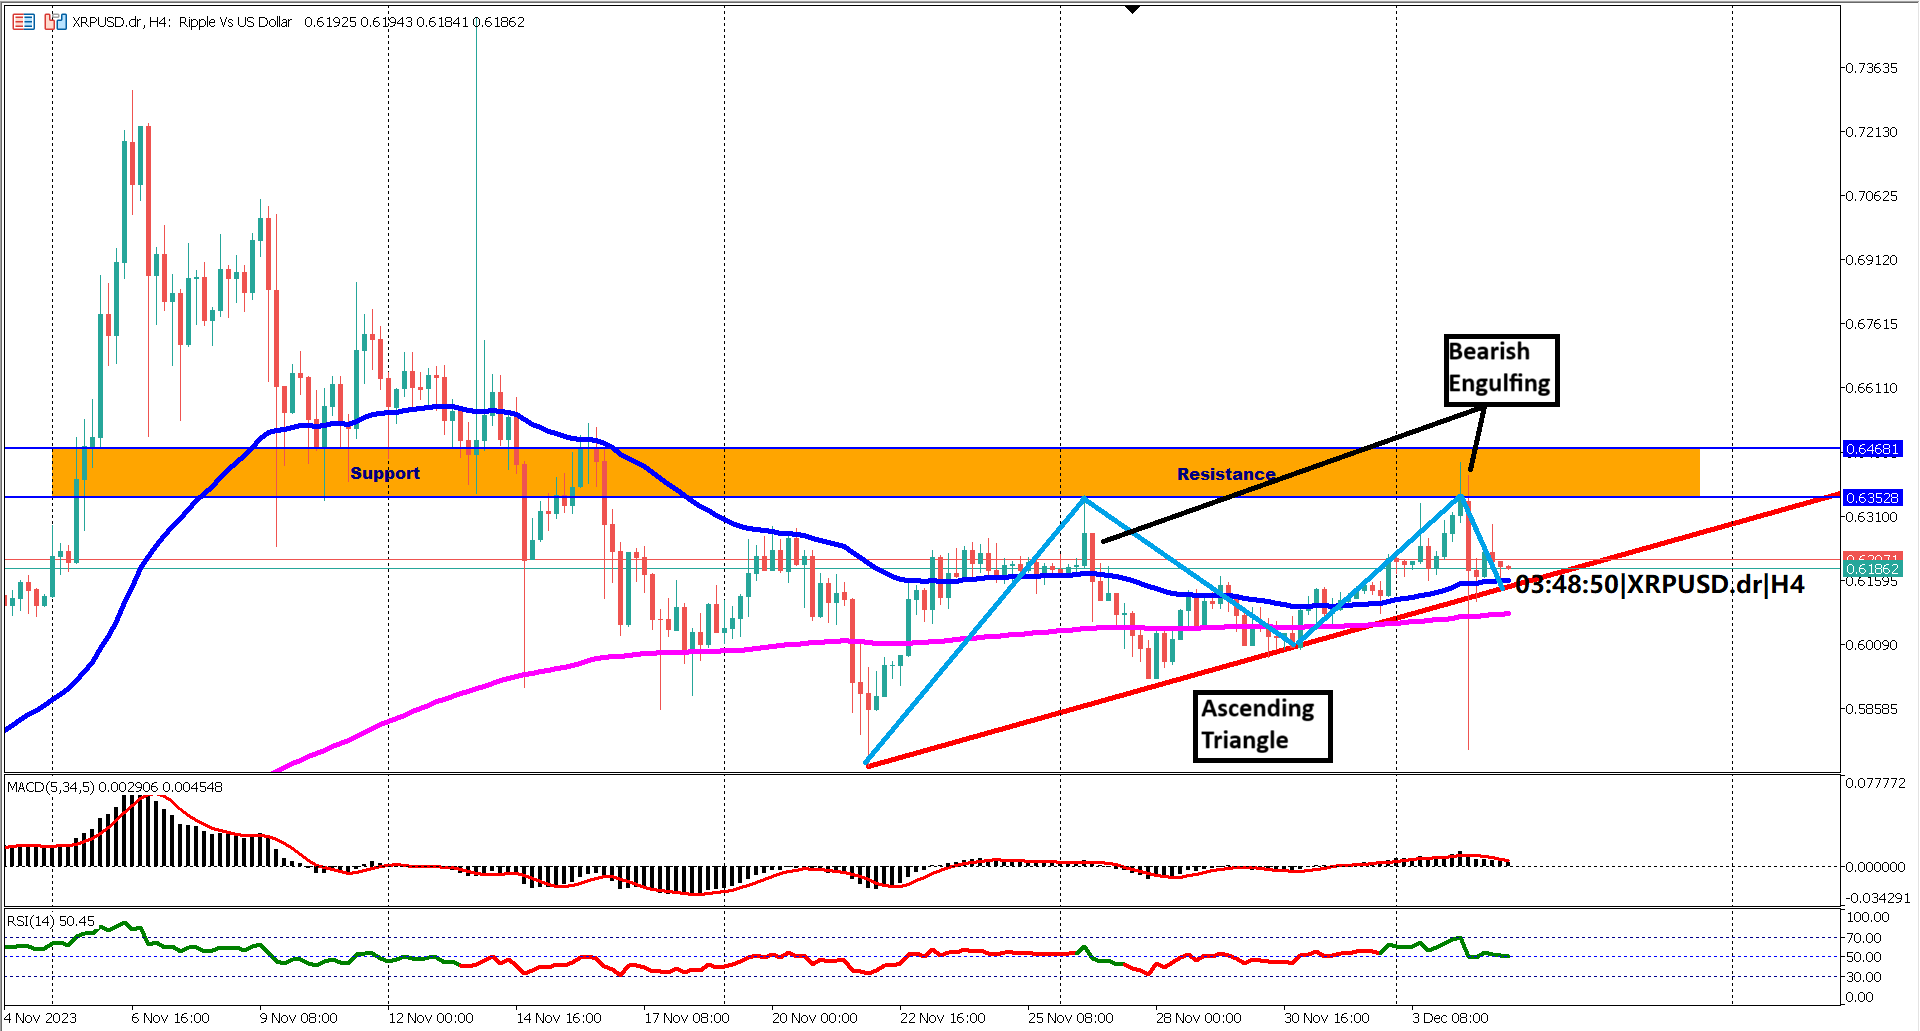

XRPUSD, the digital asset on many traders' radars, has recently undergone a short-term decline after an impressive 9-week bullish rally. This retracement brought the price back near the 50% level of the preceding bull run, introducing a moment of pause in the ongoing crypto narrative.
During this retracement, a distinct downward slope emerged, guiding the price action. Notably, the upper side of the channel, delineated by blue trendlines, was tested four times before the fifth attempt successfully broke the downward slope. Following this breakout, XRPUSD entered a sideways movement, oscillating between identified support and resistance zones denoted by yellow and turquoise rectangles.
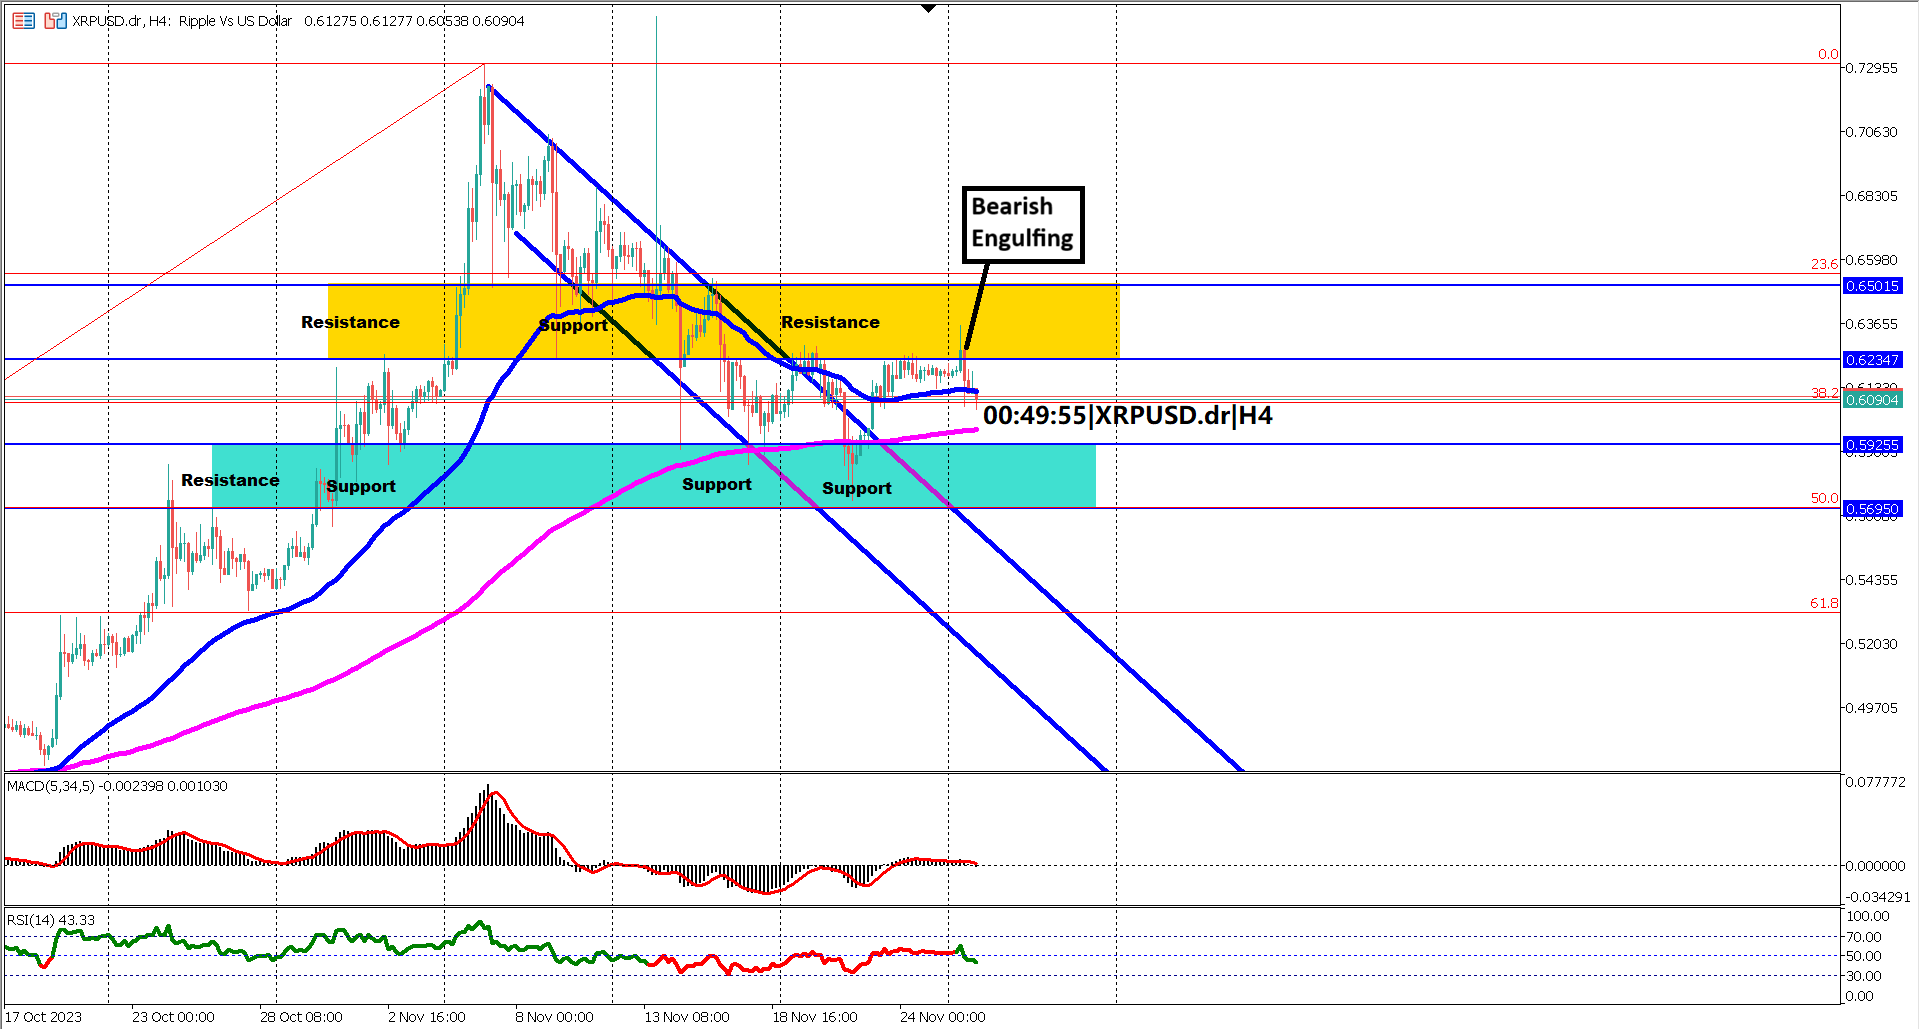
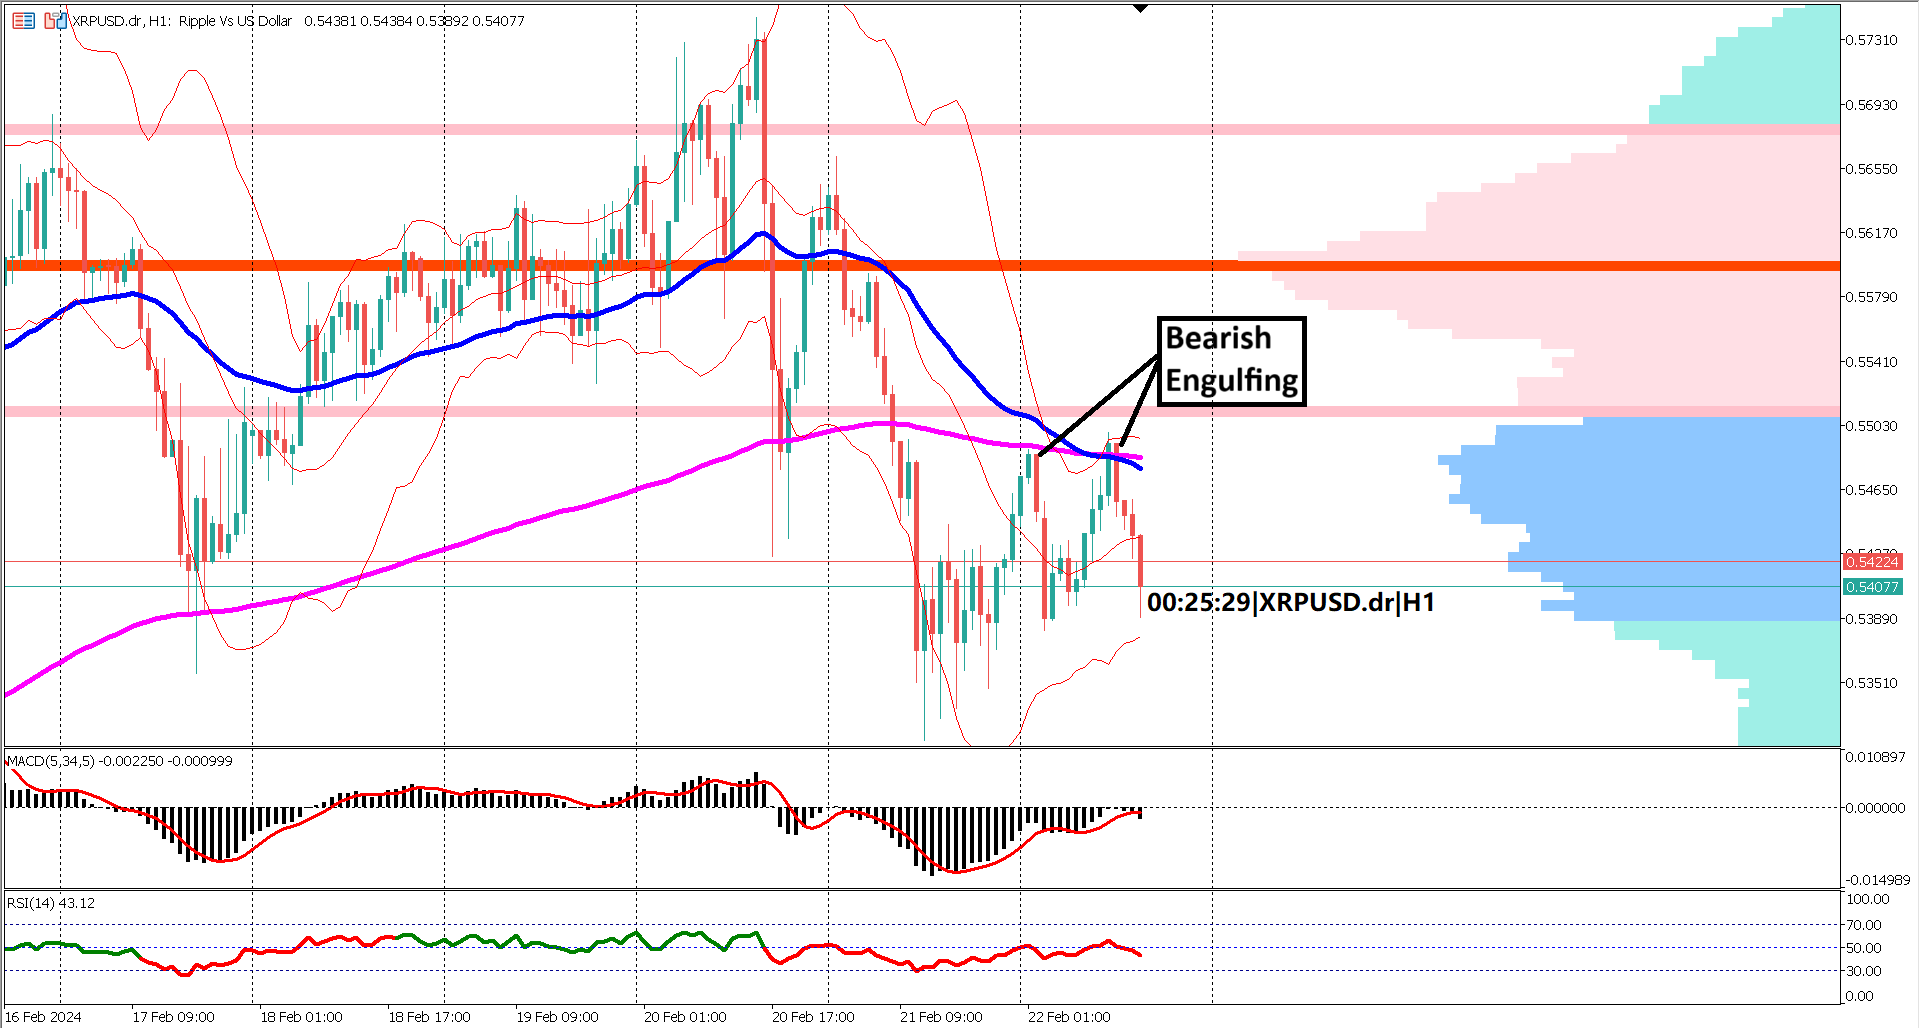
A significant event occurred on the resistance zone, marked by a bearish engulfing candlestick pattern. This formation added confirmation to the existence of resistance at this level. Traders and investors are closely watching whether the price can muster the strength to break above this resistance, potentially triggering a more robust bullish impulse move.
Analyzing key indicators, the RSI breached the 60 level, signaling bullishness. The sustainability of this bullish sentiment hinges on the RSI maintaining a position above the 40% mark. A breach below 40 could lead to heightened bearish sentiment, potentially triggering a cascade of long bearish candlesticks.
The MACD histogram's recent cross below the 0 level and the signal line hovering just above the 0 level raise questions about the crypto's short-term trajectory. Both the EMA 50 and EMA 200 maintain a bullish orientation, with the EMA 50 positioned above the EMA 200. However, their convergence suggests a potential loss of momentum in the prevailing bullish trend.
Looking ahead, the fate of XRPUSD is delicately poised. If the price breaks below the support, potential outcomes include RSI dipping below 40%, a death cross on the EMA, and the MACD histogram and signal line crossing below the 0 level.
In summary. In recent weeks, XRPUSD has undergone a short-term decline following a prolonged bullish rally, retracing near the 50% level of its previous surge. The price action formed a downward slope, breaking out after the fifth attempt at the upper side of the channel. Amidst a sideways movement between crucial support and resistance zones, a bearish engulfing pattern emerged on the resistance, signaling a potential reversal. While the RSI breached 60% mark, indicating bullishness, sustaining this sentiment depends on staying above the 40% mark. The MACD histogram crossing below 0 raises concerns, and the convergence of EMA 50 and EMA 200 suggests waning bullish momentum. Traders are closely monitoring key levels for potential bullish resurgence or further bearish trends in the XRPUSD market.
Forecast 721K vs Previous 759K
Forecast 1.487M vs Previous 1.471M

Trading foreign exchange on margin carries a high level of risk, and may not be suitable for all investors. Before deciding to trade foreign exchange you should carefully consider your investment objectives, level of experience, and risk appetite.
Nothing contained in this website should be construed as investment advice. Any reference to an investment's past or potential performance is not, and should not be construed as, a recommendation or as a guarantee of any specific outcome or profit.