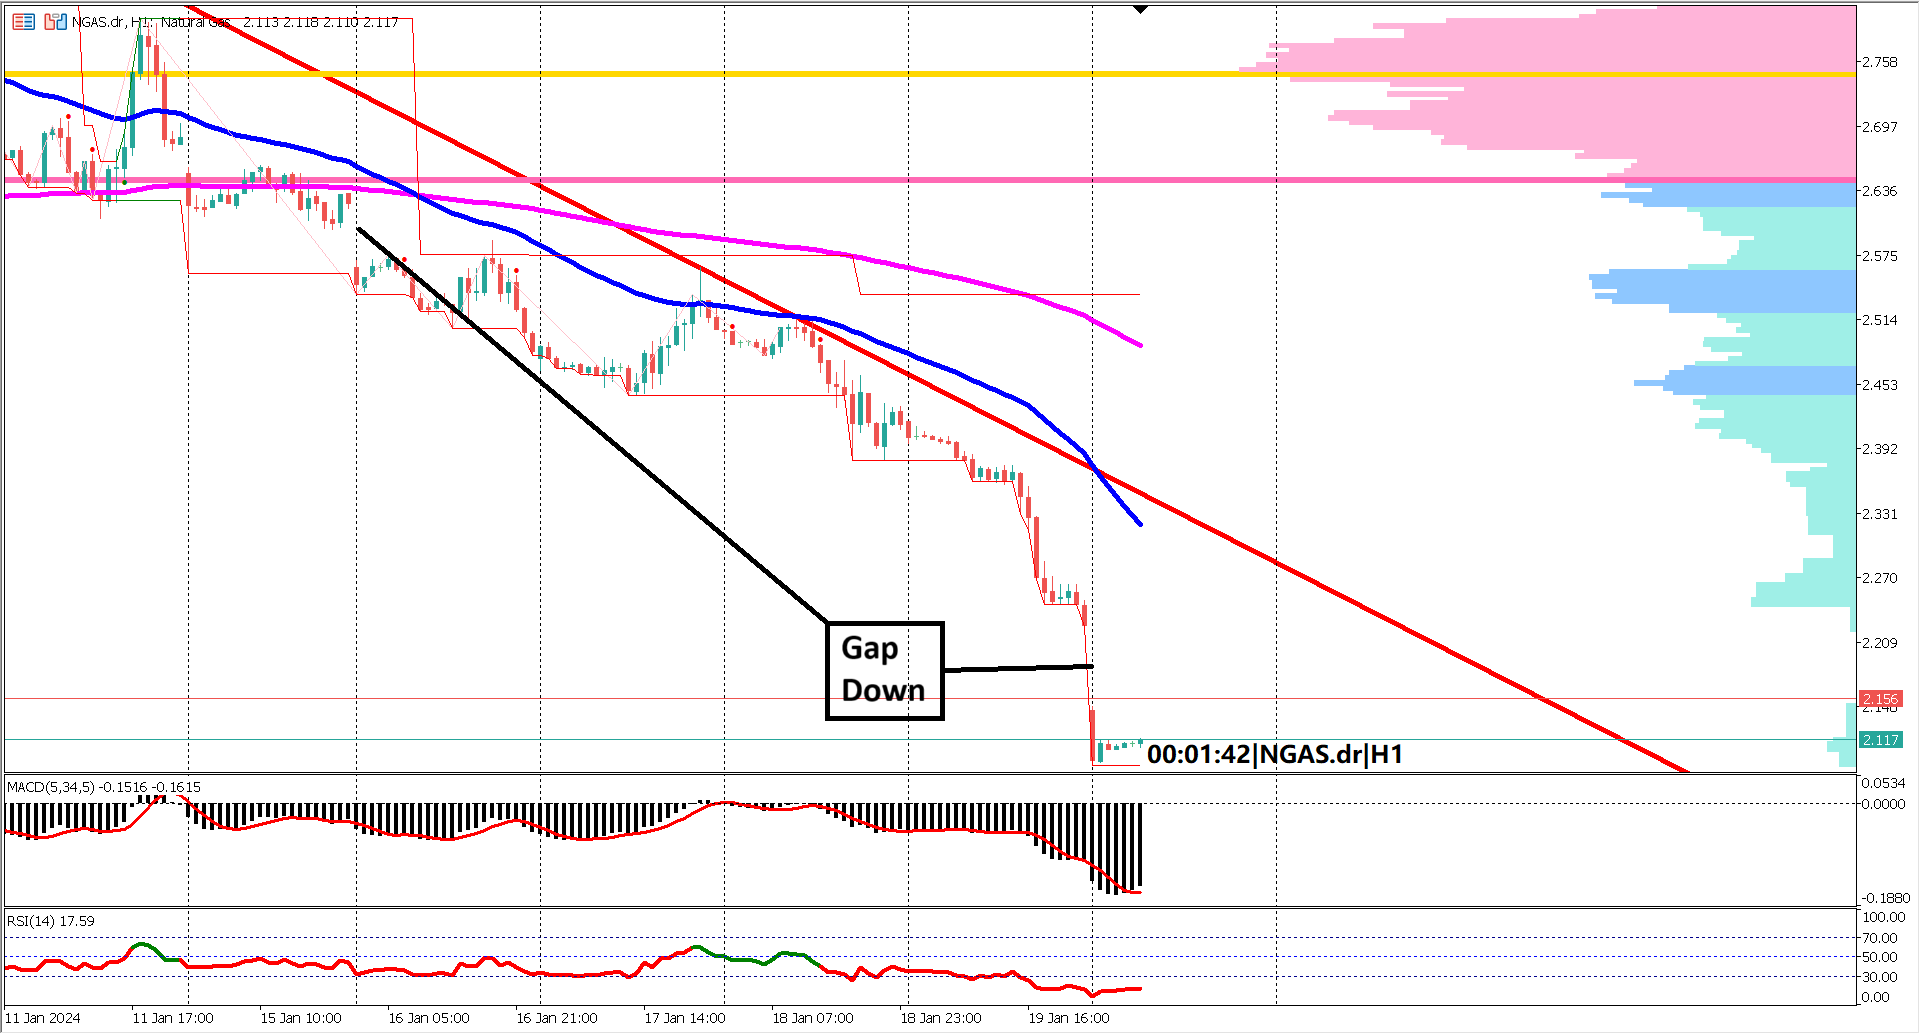
In a volatile start to the trading week, Natural Gas (NGAS) opened Monday's Asian session with a notable gap down, setting a tone of bearish sentiment in the energy markets. Traders are closely monitoring key technical indicators to decipher the potential trajectory of NGAS prices in the coming sessions.
The descending red-colored trendline continues to cast a shadow over NGAS, with prices struggling to break free from its bearish grip. The market dynamics suggest a prevailing downward pressure, as reflected by the relentless influence of this descending trendline.

Adding to the bearish narrative, both the Exponential Moving Average (EMA) 50 and EMA 200 are expanding, underscoring the strengthening bearish momentum. This widening gap between the EMAs signals a growing conviction among sellers, creating headwinds for potential bullish reversals.
The Relative Strength Index (RSI) provides an interesting twist to the story. Before the recent gap down, the RSI had reached oversold levels, indicating potential exhaustion in the selling pressure. However, the appearance of the latest gap down introduces the concept of an exhaustive gap chart pattern. This pattern suggests that the selling momentum might be reaching its limits, opening the door for a potential price reversal if NGAS manages to break above the level of the exhaustive gap.
Meanwhile, the Moving Average Convergence Divergence (MACD) histogram has crossed above the signal line. Although both remain below the 0 level, this bearish signal suggests a potential bearish correction on the horizon. Traders are now keenly observing whether this MACD signal evolves into a more sustained reversal or remains a transient blip on the chart.
A critical juncture for NGAS lies between the EMA 50 and EMA 200, coupled with the pivotal moment of breaking the descending trendline. A successful breach of these levels could signal a shift in sentiment, providing bulls with an opportunity to regain control.
As NGAS navigates through these crucial levels, market participants brace for heightened volatility, closely tracking technical indicators and key resistance zones. The upcoming sessions will likely unfold with potential opportunities for both bullish and bearish traders, making NGAS a focal point in the energy market landscape.
Monday's Gap Down: Natural Gas (NGAS) initiates the trading week with a notable gap down during the Asian session, setting a bearish tone in the energy markets.
Descending Trendline Pressure: NGAS continues to grapple with downward pressures, as prices remain constrained under the influence of a persistent descending red-colored trendline.
Expanding EMAs: Both the EMA 50 and EMA 200 are expanding, indicating a strengthening bearish momentum and creating challenges for potential bullish reversals.
RSI and Exhaustive Gap Pattern: Despite reaching oversold levels before the recent gap down, the RSI introduces the concept of an exhaustive gap pattern, suggesting potential exhaustion in selling pressure and the possibility of a reversal.
MACD Bearish Signal: The MACD histogram crossing above the signal line signals a potential bearish correction on the horizon, adding complexity to NGAS's current market dynamics.
Critical Juncture: NGAS faces a critical juncture between the EMA 50 and EMA 200, along with the challenge of breaking the descending trendline. Success in breaching these levels could indicate a shift in sentiment and present opportunities for both bullish and bearish traders.
Forecast -0.3% vs Previous -0.5%
Trading foreign exchange on margin carries a high level of risk, and may not be suitable for all investors. Before deciding to trade foreign exchange you should carefully consider your investment objectives, level of experience, and risk appetite.
Nothing contained in this website should be construed as investment advice. Any reference to an investment's past or potential performance is not, and should not be construed as, a recommendation or as a guarantee of any specific outcome or profit.
