
As the USDCAD navigates through the forex landscape, traders find themselves at a critical juncture, closely monitoring key levels and indicators for potential market shifts.
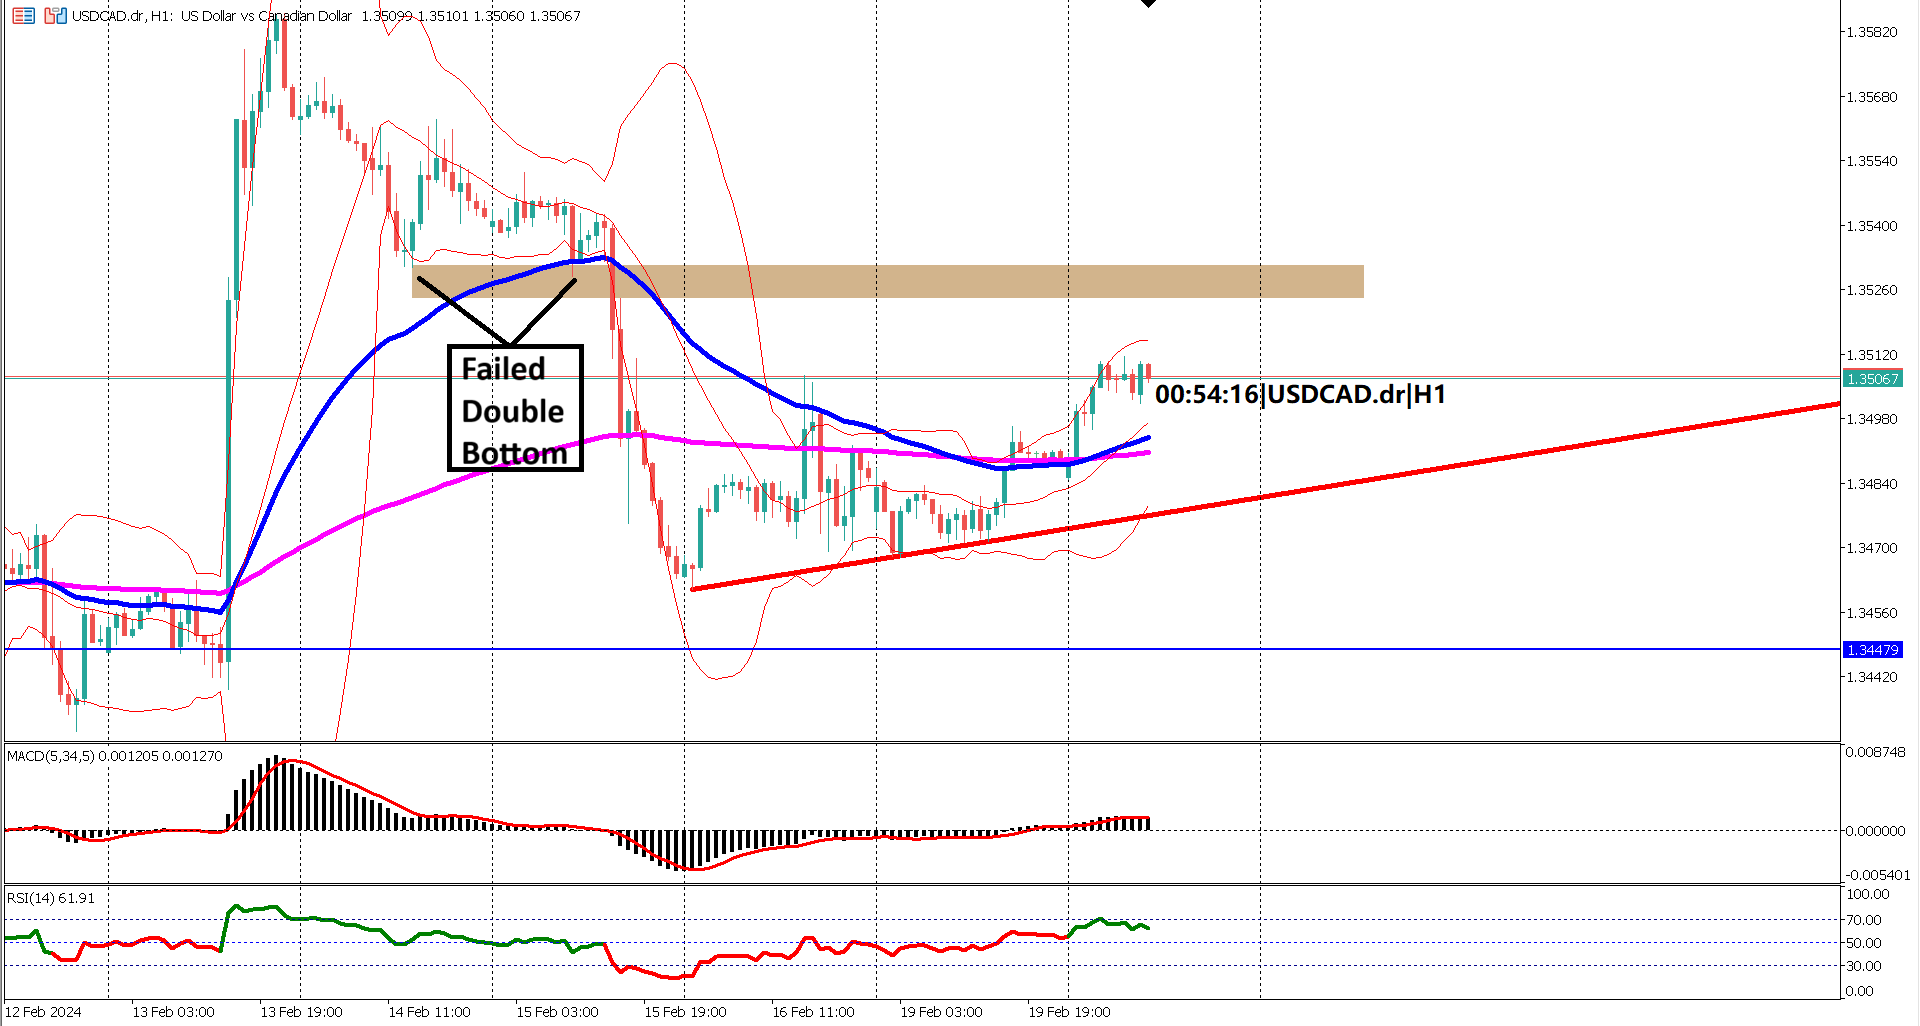
The currency pair appears to be undergoing a bearish correction, with its sights set on a pivotal resistance level at 1.35458. Traders are on high alert as prices recently breached the ascending bullish trendline, signaling a potential shift in market dynamics.
Following the break of the trendline, prices experienced an appreciative phase but found formidable resistance alongside the once-supportive trendline. The interaction between prices and the trendline holds the key to the pair's immediate future.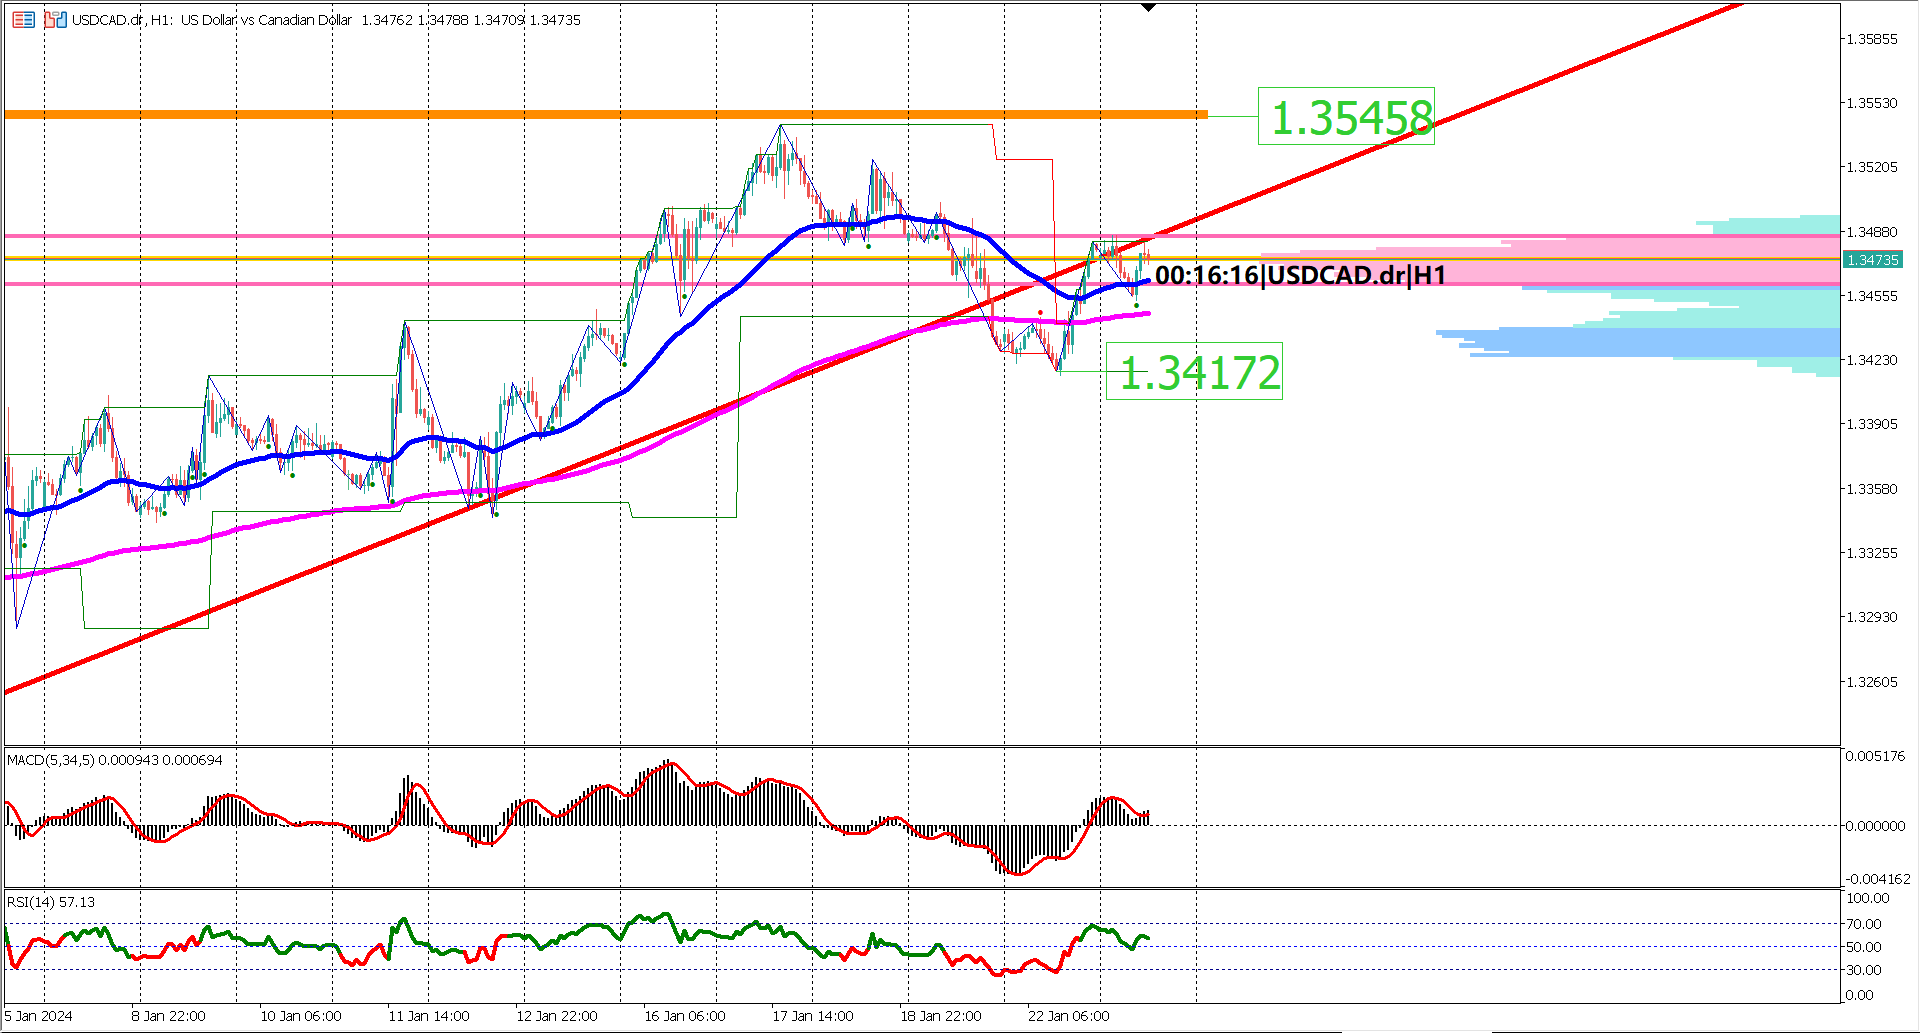
Should prices successfully reclaim the upper side of the ascending trendline, a continuation of the bullish momentum becomes a plausible scenario. Traders eyeing the coveted 1.35458 resistance anticipate a breakthrough, paving the way for further upward movement. However, failure to breach the trendline could usher in a period of sideways trading or even signal the onset of a bearish reversal.
For risk-aware traders, the key level of support at 1.34172 is of utmost significance. A breach below this critical swing low could trigger a sell-off, particularly if the Relative Strength Index (RSI) turns bearish by breaking below the 40% level. Traders are advised to remain vigilant, observing price action around this support level for potential shifts in market sentiment.
The Exponential Moving Averages (EMA) 50 and 200 present an intriguing scenario. With both lines narrowly separated, the potential for a death cross looms large, especially if prices continue their descent below the EMA 200. Traders closely monitor this EMA interplay for insights into the pair's evolving trend.
Delving into the oscillator indicators, both the Moving Average Convergence Divergence (MACD) and RSI currently portray a bullish trend. These signals add an additional layer of complexity to the analysis, requiring traders to weigh the bullish momentum against potential bearish cues from other indicators.
As traders navigate the twists and turns of the USDCAD journey, the interplay between key levels, trendlines, and technical indicators will determine the pair's trajectory. The forex landscape remains dynamic, and traders must stay informed and adaptable to capitalize on emerging opportunities.
Traders should remain diligent, adapting to evolving market conditions for strategic decision-making in the USDCAD arena.
Forecast 0.0% vs Previous -0.2%

Trading foreign exchange on margin carries a high level of risk, and may not be suitable for all investors. Before deciding to trade foreign exchange you should carefully consider your investment objectives, level of experience, and risk appetite.
Nothing contained in this website should be construed as investment advice. Any reference to an investment's past or potential performance is not, and should not be construed as, a recommendation or as a guarantee of any specific outcome or profit.