
As of Wednesday, Western Texas Intermediate (WTI), the US crude oil (USOIL) benchmark, is navigating a complex landscape, hovering around the $72 mark. The market sentiment is characterized by concerns over the efficacy of OPEC+ supply cuts and apprehensions about a deteriorating demand outlook in China, collectively applying downward pressure on WTI prices.
The focal point for the day is the impending release of the US Crude Oil inventories. Economists are anticipating a negative reading at -1.354 million barrels. A result lower than this forecast would be considered bullish for USOIL, potentially providing a lift amidst the prevailing uncertainties.
However, early Wednesday brought unwelcome news as Moody’s downgraded China’s sovereign credit rating from stable to negative. The rationale behind this downgrade includes escalating risks to growth and a burgeoning property sector crisis in China. This development signals increased default risks in recent years, and the pessimistic economic outlook in China casts a shadow on WTI's potential upside, given that China stands as the world's largest oil consumer.
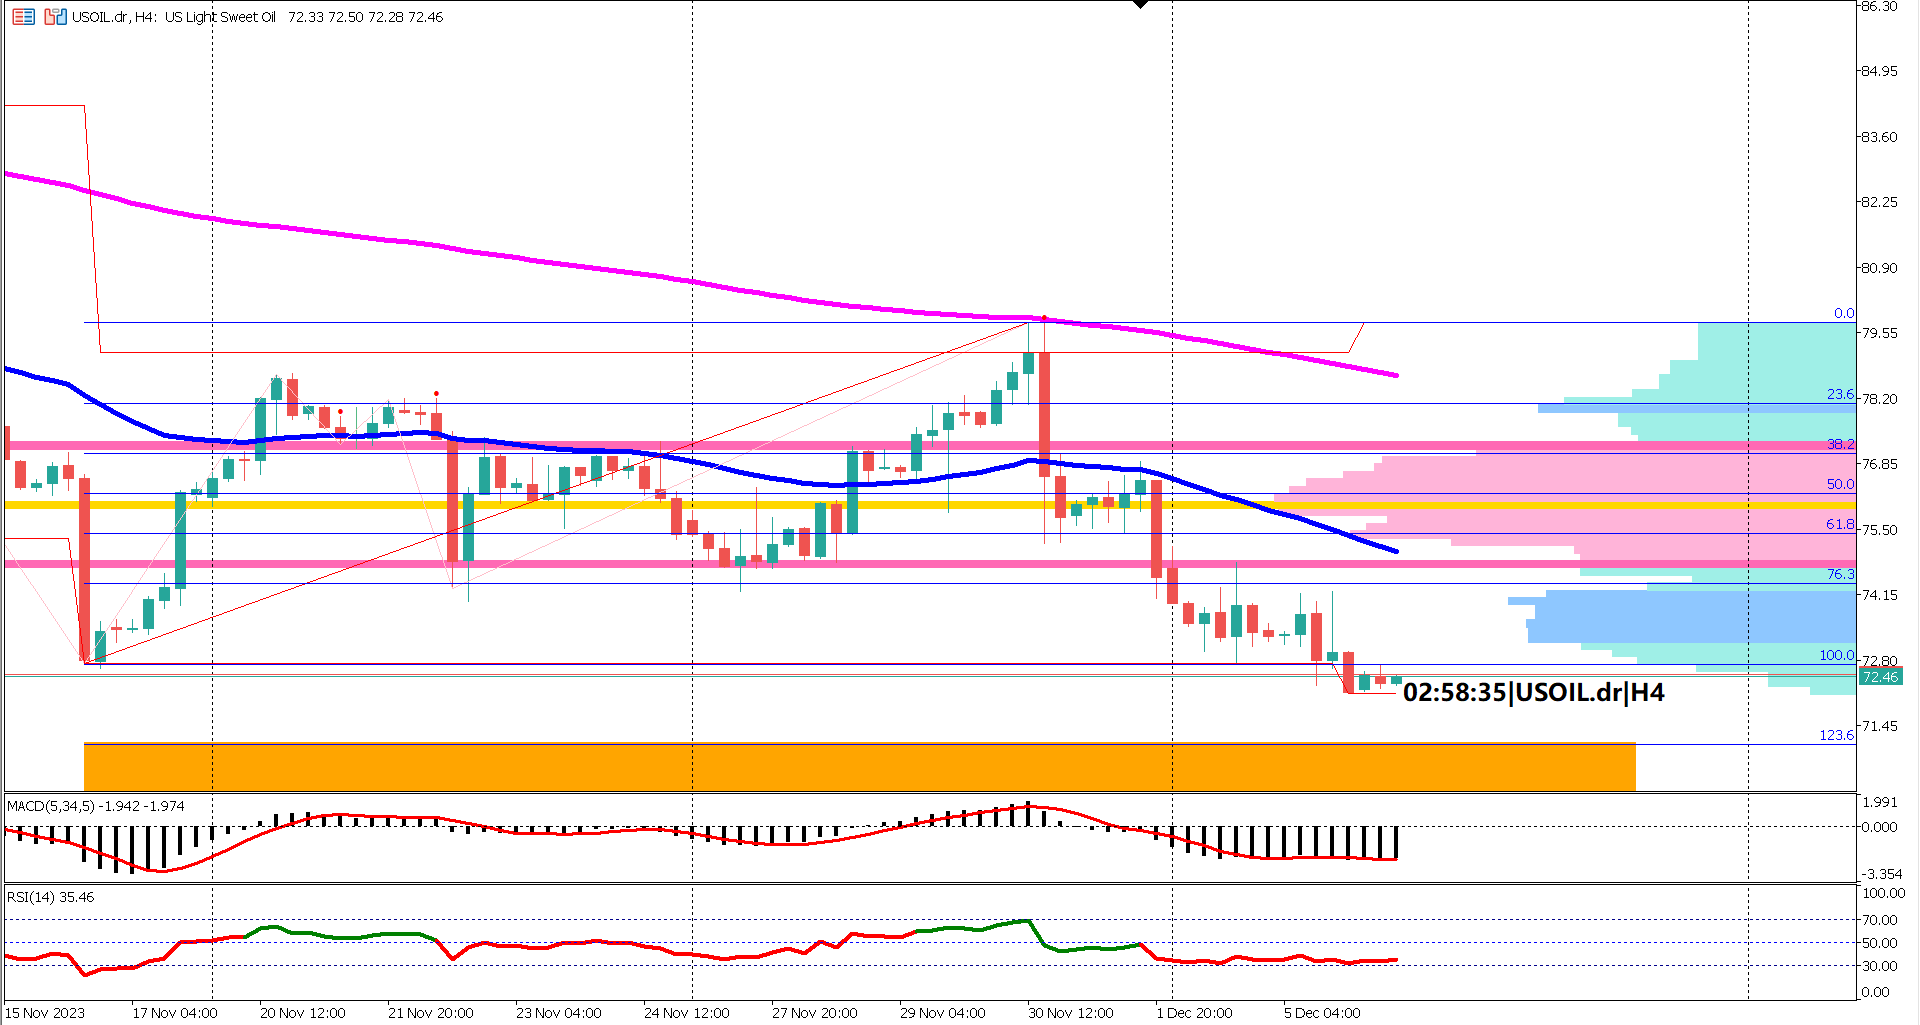
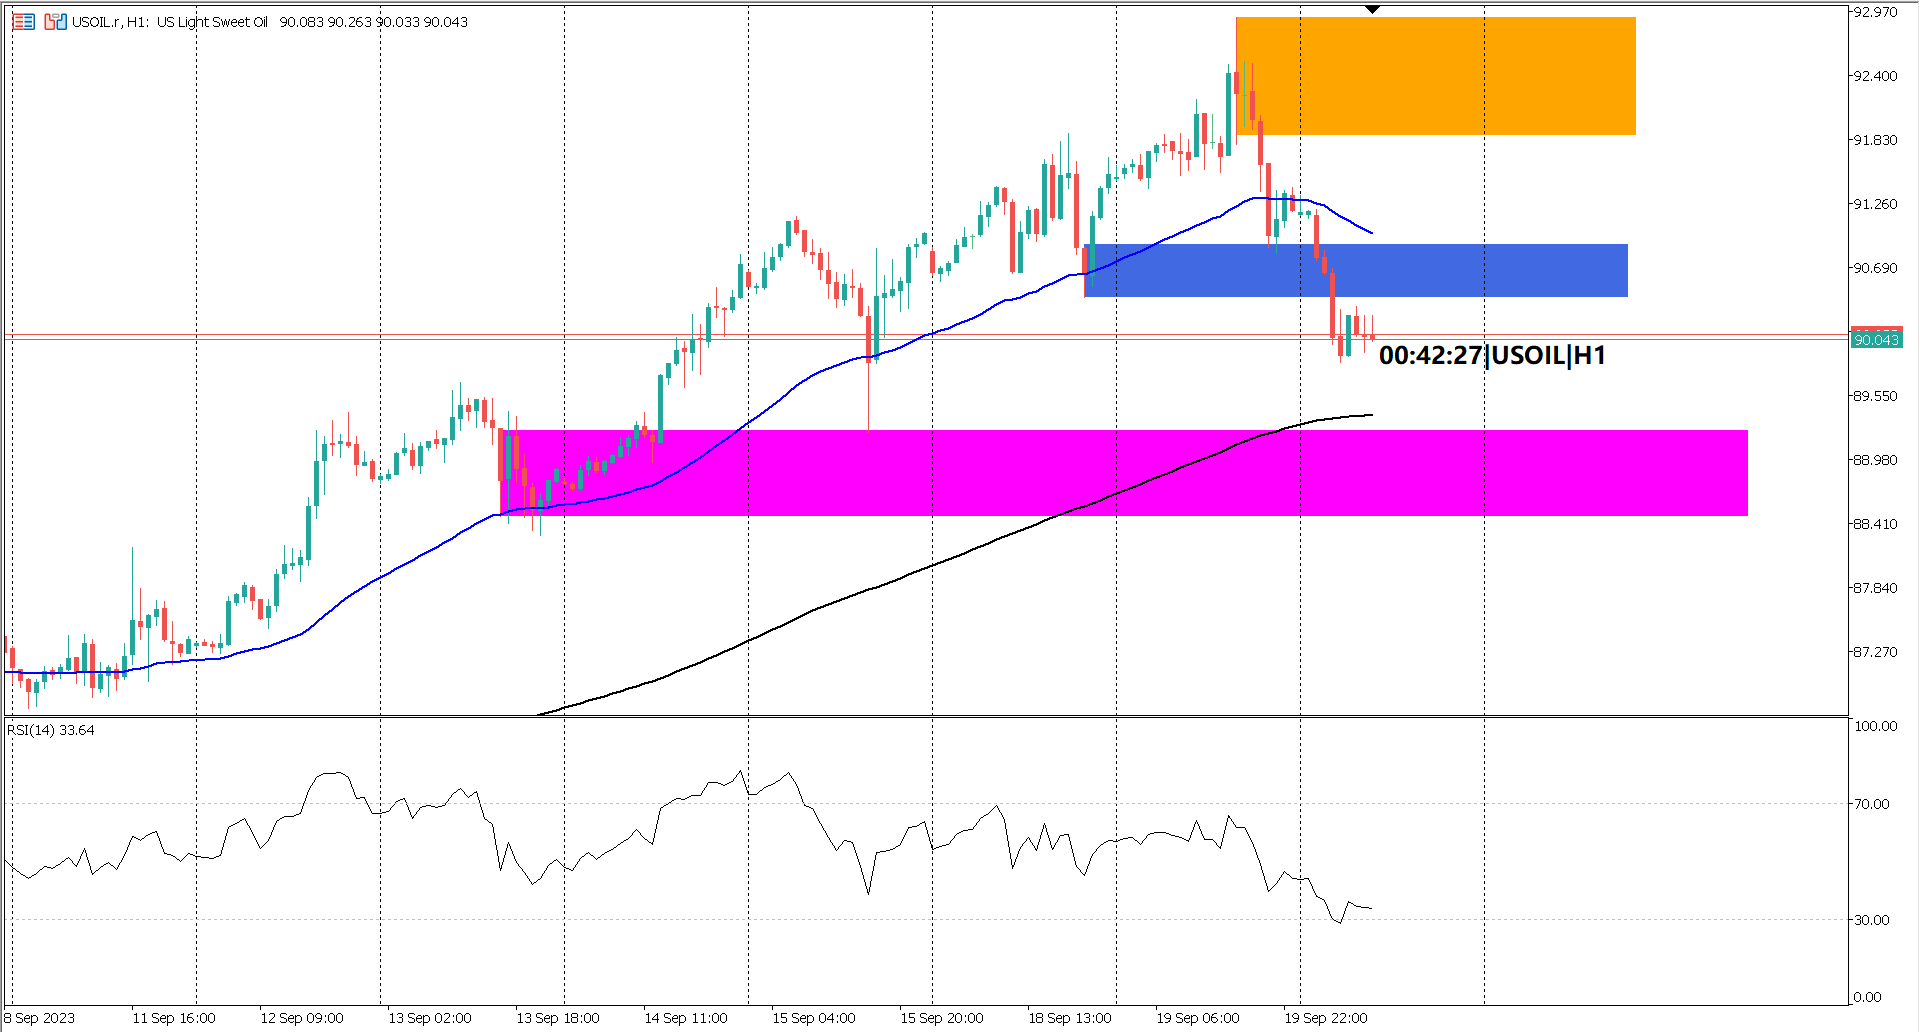
Examining the 4-hour time frame, USOIL has been trading within a tight range for the last three sessions, following a breach below a significant swing low at 72.73. This suggests that the downward momentum may not have concluded.
A Fibonacci retracement drawn from the swing low at 72.73 to the swing high at 79.77 reveals the potential for further decline, with Fibonacci extension levels spanning from 123.6% to 161.8%, highlighted in an orange rectangle.
From a technical perspective, the bearish momentum remains robust as the EMA 50 and EMA 200 continue to maintain their bearish alignment. Supporting this, oscillator indicators indicate the RSI crossed below 40% threshold and have been holding under 60% threshold for the last 20 periods. Furthermore, the MACD remains bearish with both the histogram and signal line below the 0 level.
Analyzing the recent candlestick patterns, the market exhibits a series of small-bodied bullish candles in the last 20 to 30 bars, contrasting with larger real-bodied bearish candles. This underscores a prevailing bearish pressure and weak bullish influence.
In summary, the intricate web of factors suggests that there may be further room for USOIL prices to decline, potentially revisiting the lower ranges around $68-$71ish.
Traders are advised to closely monitor key developments, particularly China's economic indicators and the upcoming US Crude Oil inventories release, as they hold the keys to USOIL's near-term trajectory amidst the current volatility.
Forecast 130K vs Previous 113K
Forecast 5.0% vs Previous 5.0%
Forecast -1.354M vs Previous 1.609M

Trading foreign exchange on margin carries a high level of risk, and may not be suitable for all investors. Before deciding to trade foreign exchange you should carefully consider your investment objectives, level of experience, and risk appetite.
Nothing contained in this website should be construed as investment advice. Any reference to an investment's past or potential performance is not, and should not be construed as, a recommendation or as a guarantee of any specific outcome or profit.