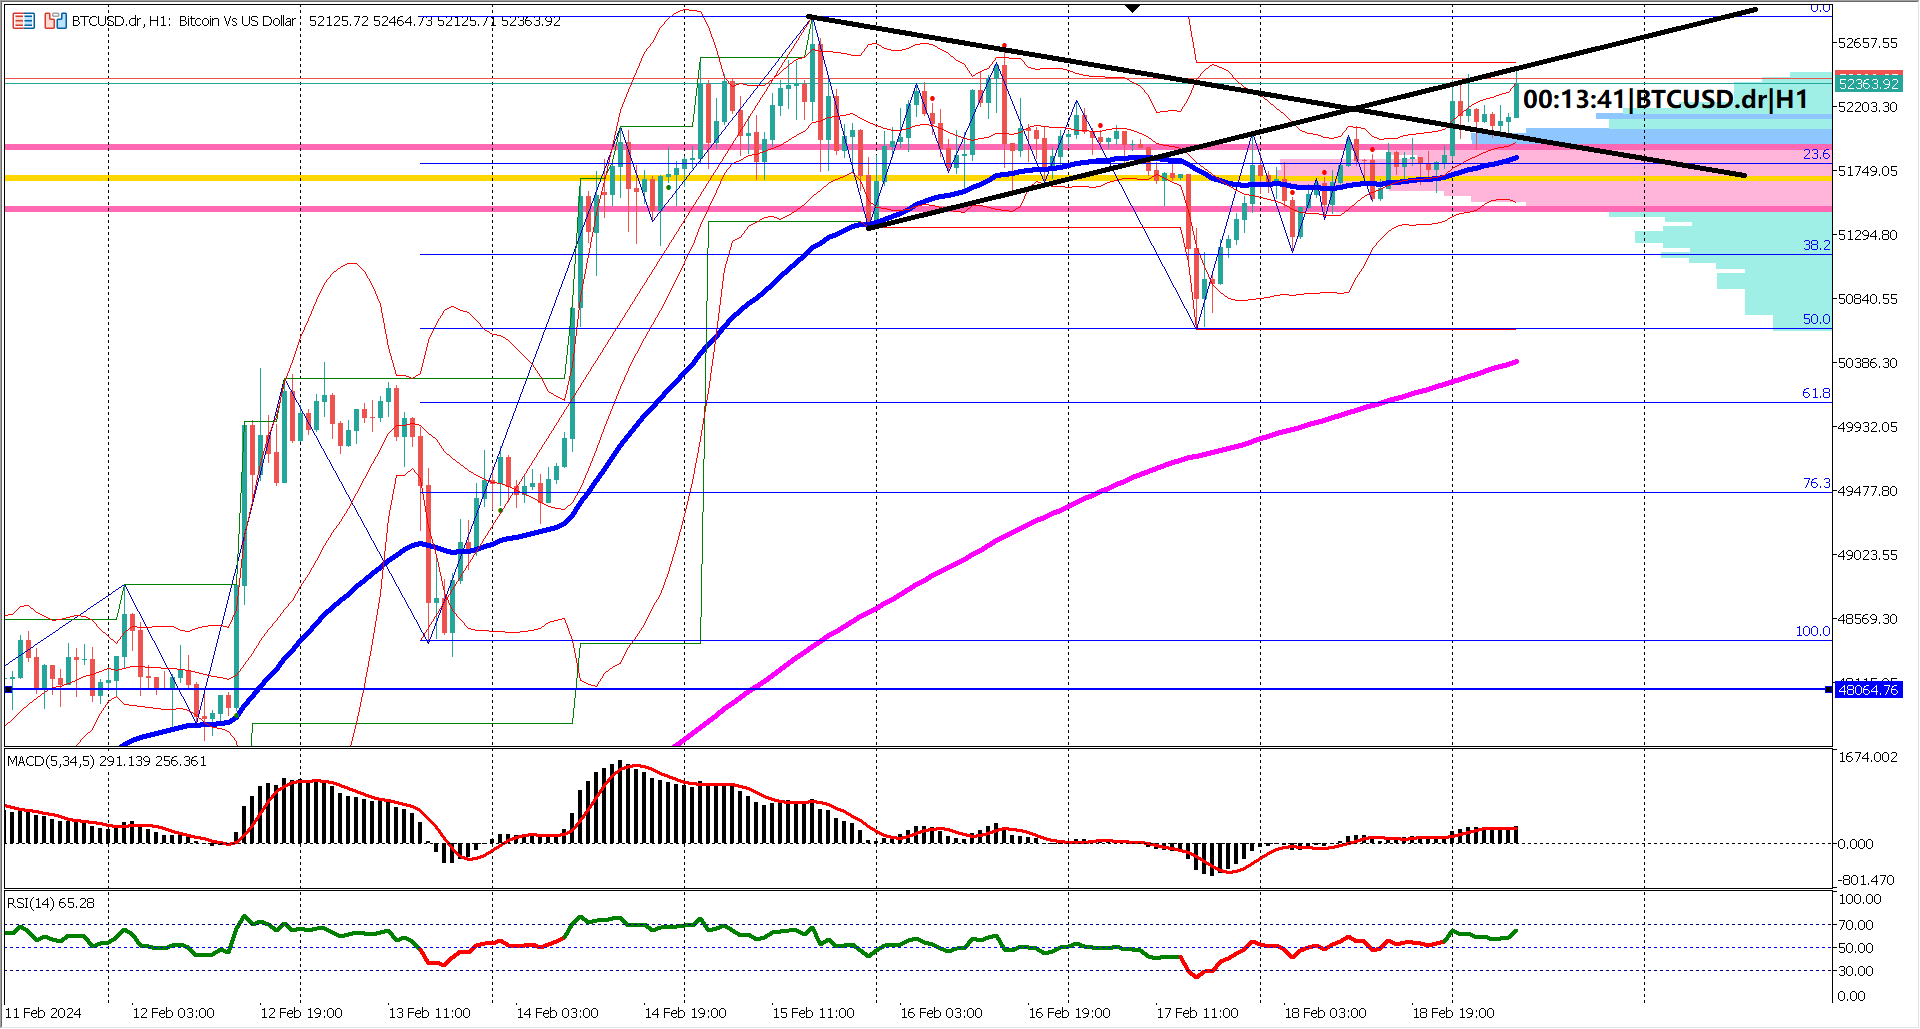
 Stellar Lumens (XLM) enthusiasts are closely monitoring the charts as the cryptocurrency charts an intriguing course following the formation of an inverse head and shoulders pattern. The neckline, represented by the red ascending trendline, has been decisively breached, marking a pivotal moment for XLMUSD traders.
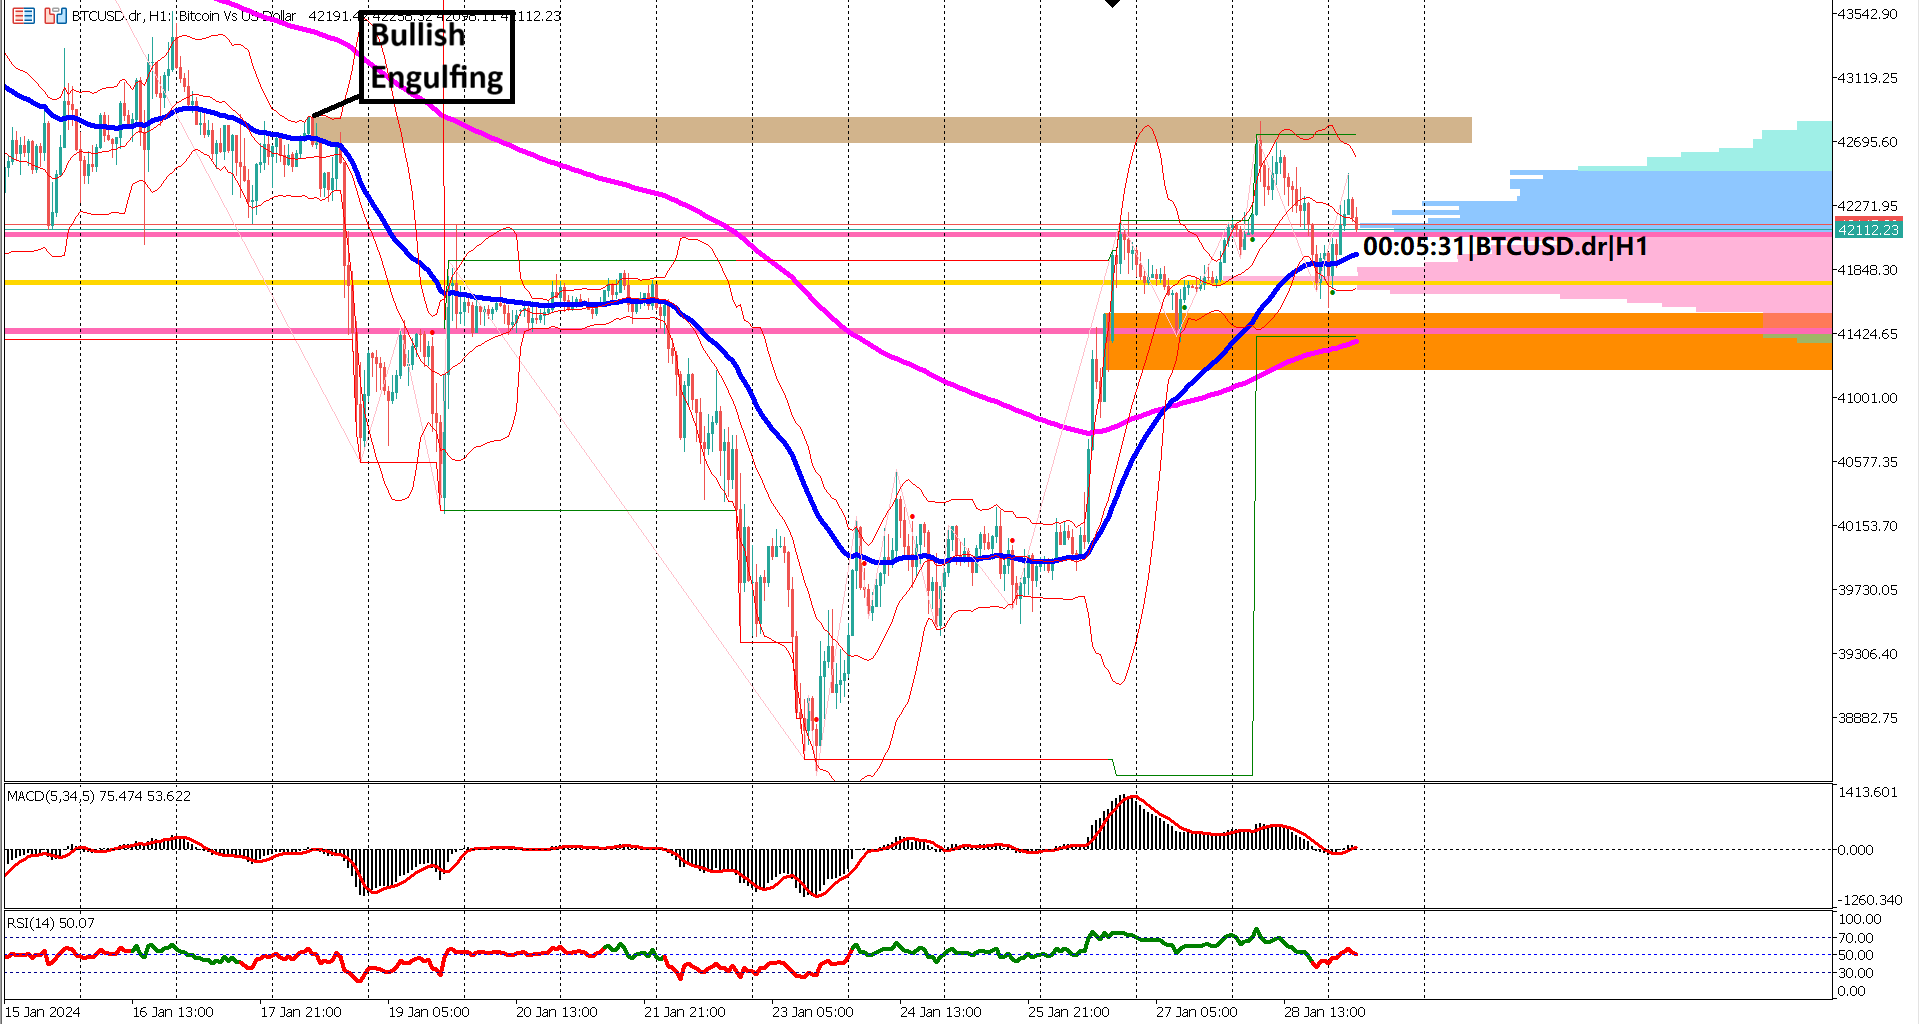
Despite the breakthrough, the journey is not without its challenges. Several hanging man candlesticks have made appearances at the edge of the neckline, generating false bearish reversal signals. It's important to note that this pattern is not a valid indicator of a reversal, particularly since the bullish trend is relatively new. Valid bearish reversal signals typically manifest at the top of a matured bullish trend, which is not the case here.
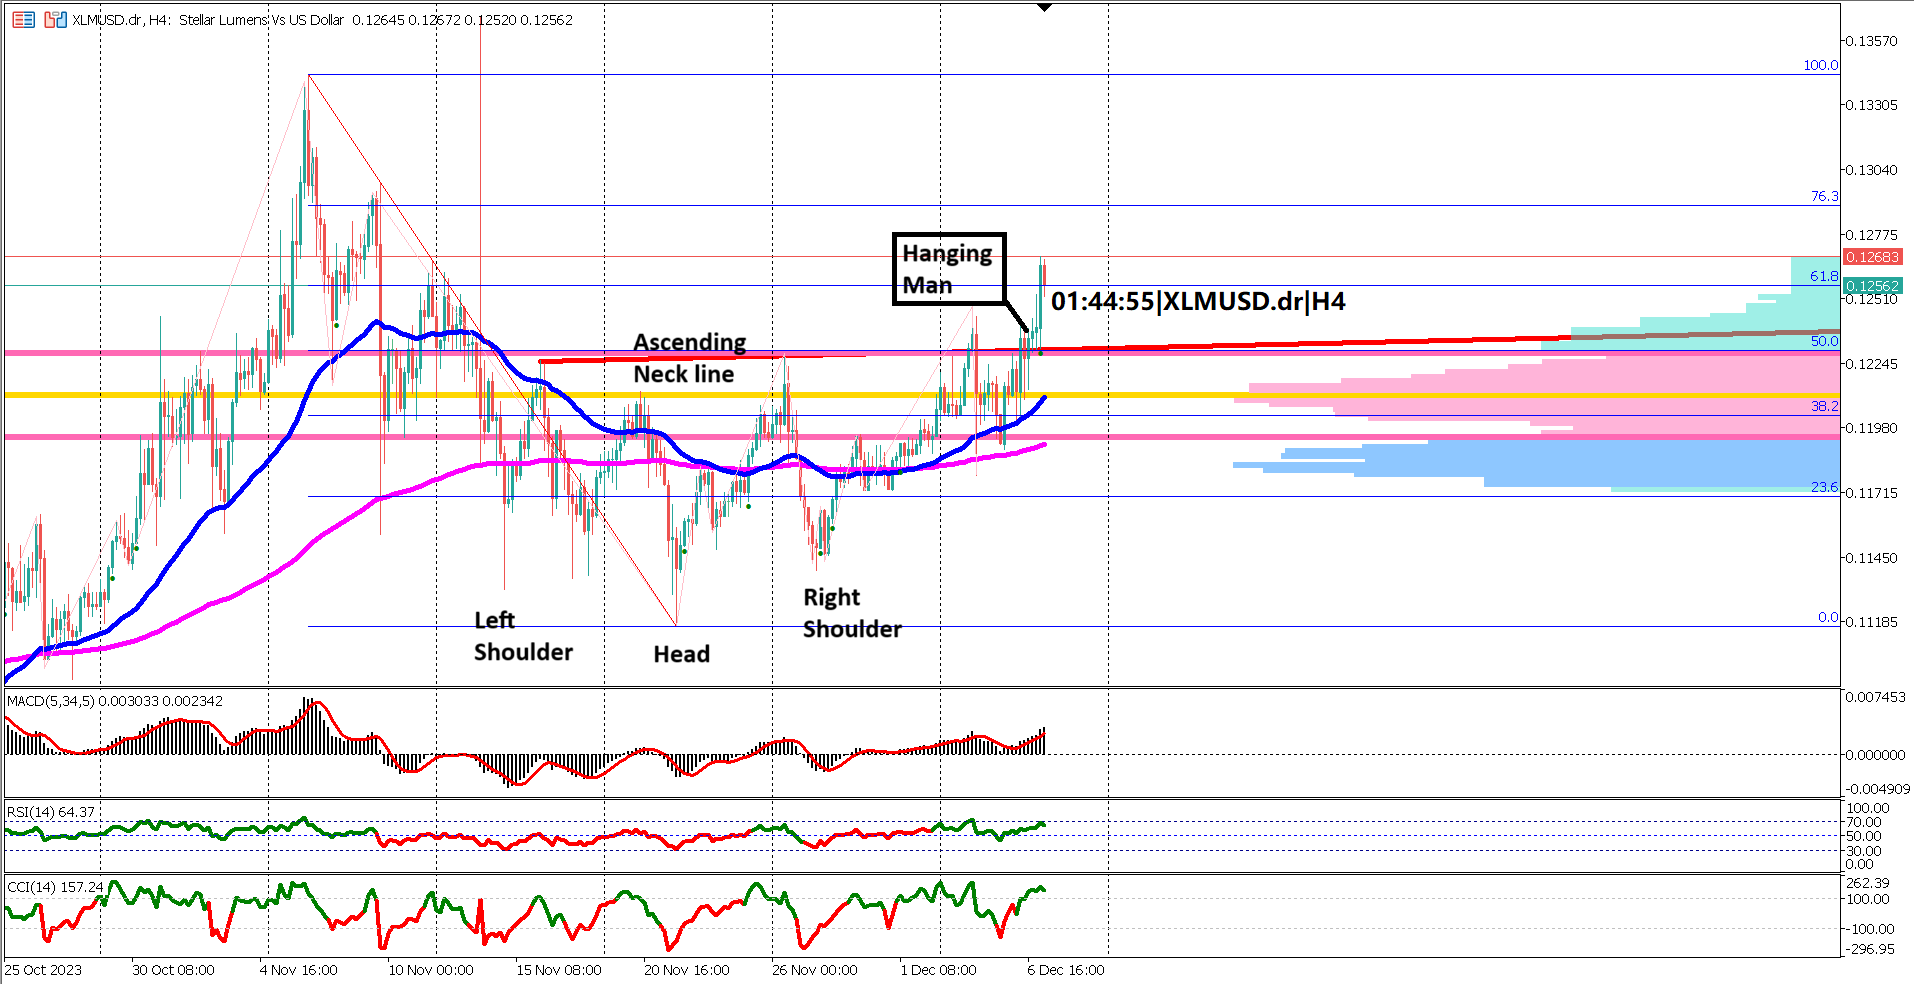
The ascent faces a minor hurdle at 0.1266, serving as a resistance level subsequent to the neckline breach. In the long term, the trend remains firmly bullish, while the short term adopts a bearish stance, poised to test the support of the neckline before embarking on its continued upward trajectory.
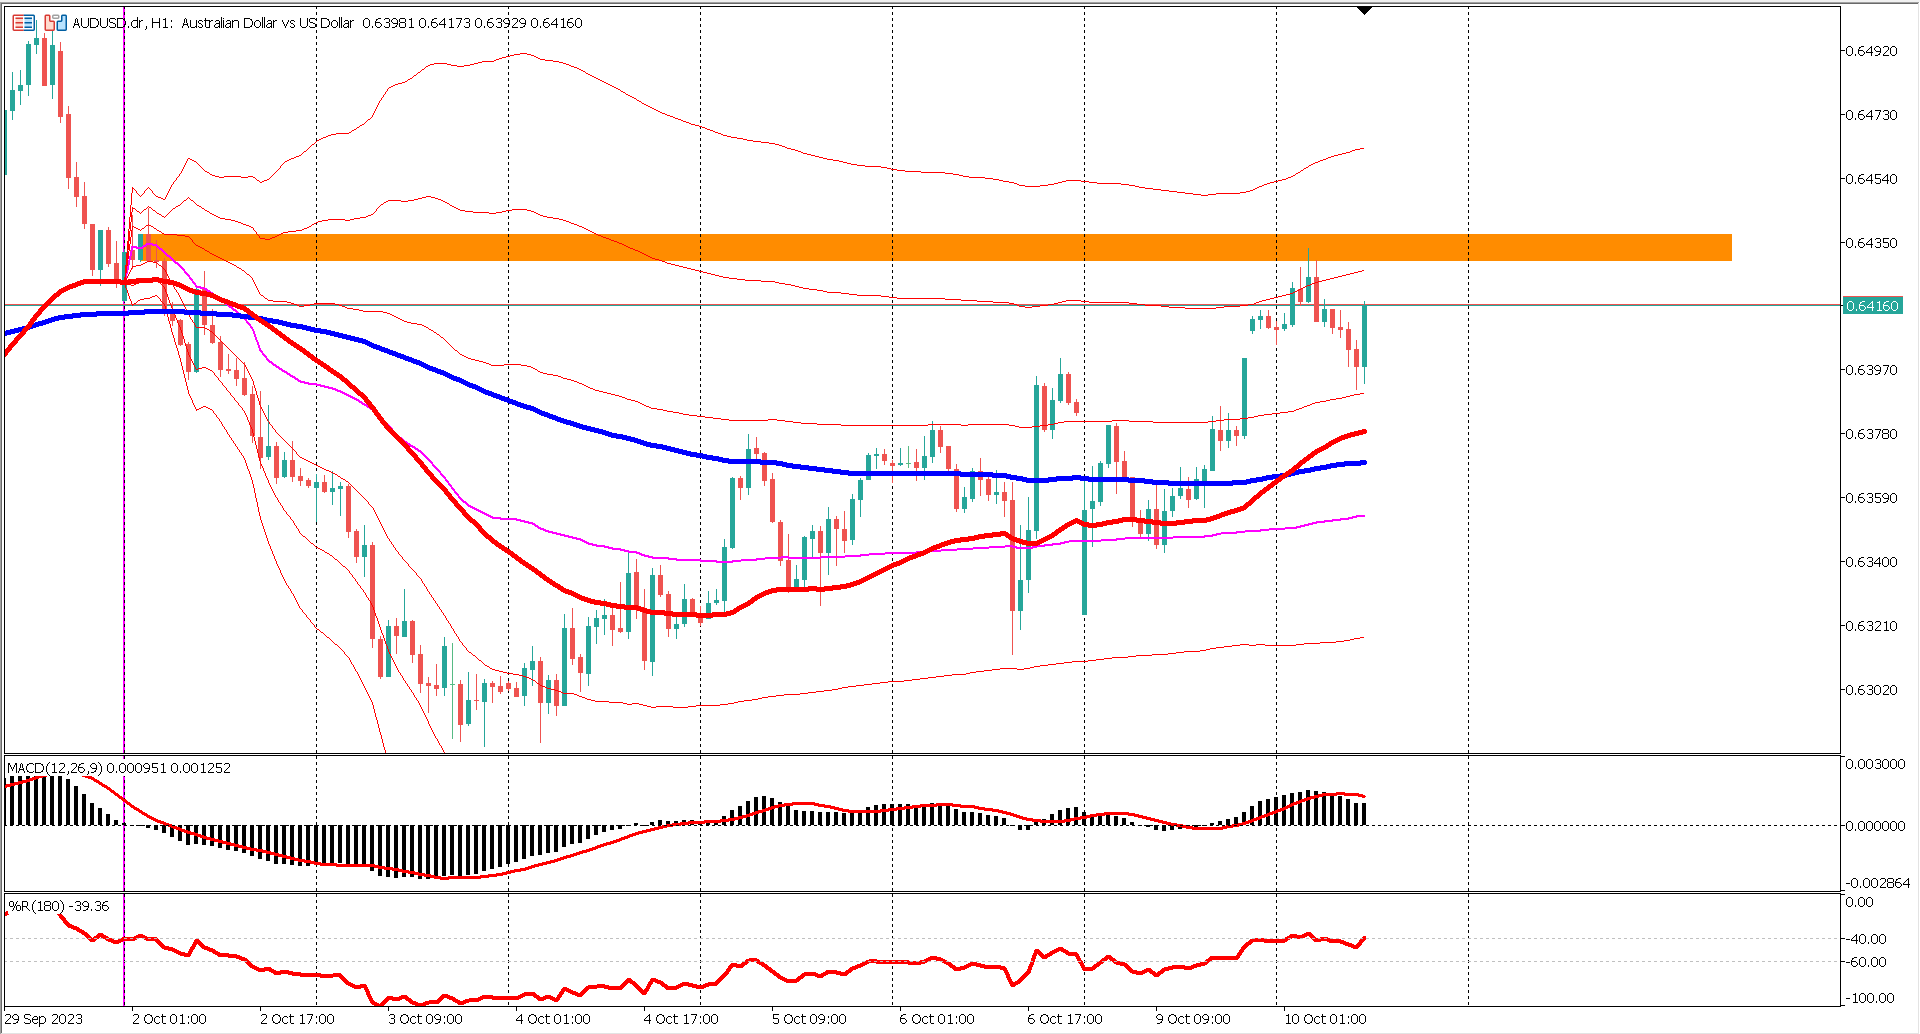
A significant development in favor of the bulls is the golden cross witnessed on the EMA 50 & EMA 200, where the EMA 50 crossed above the EMA 200—a clear indicator of bullish strength. The momentum is robust, resembling that of a young bull, as the expanding EMA 50 & EMA 200 signify an intensified momentum in the existing trend.
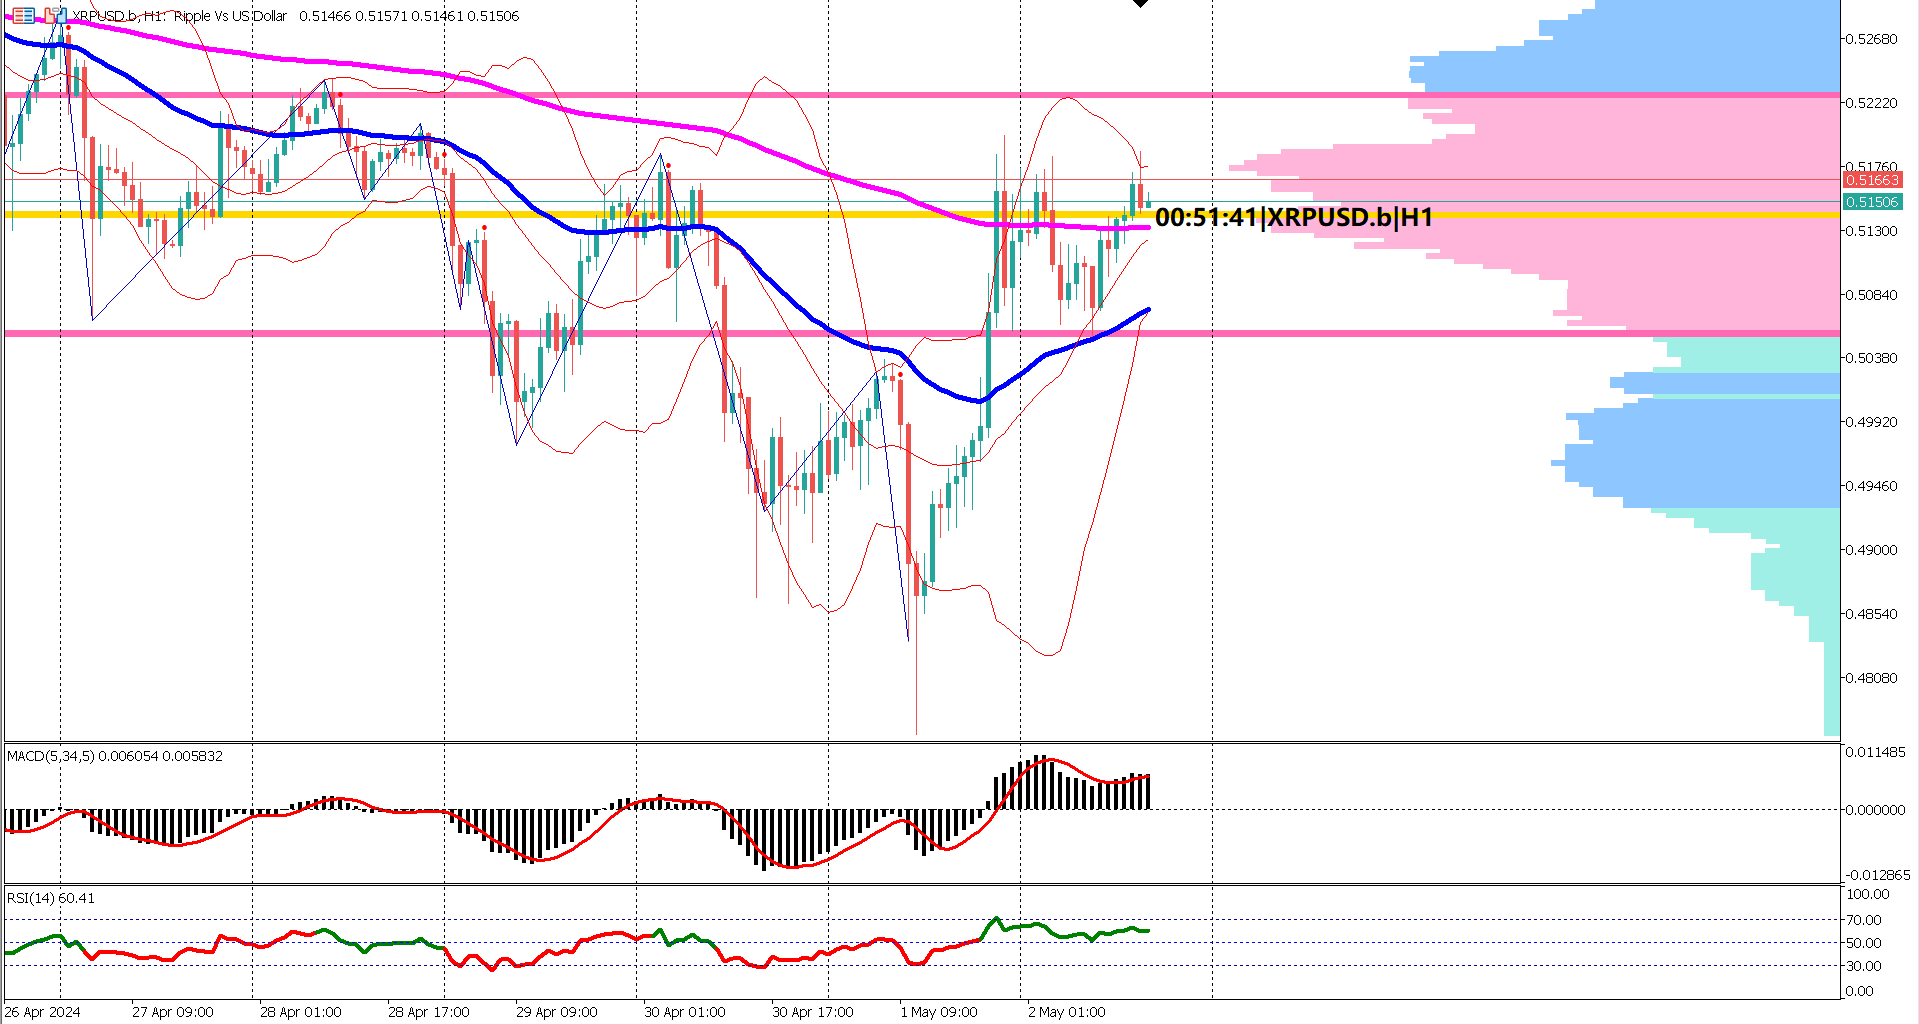
Analyzing the volume profile, the price comfortably resides above the upper range of the value area (pink bars), showcasing the aggressive buying behavior of the bulls in the XLM market.
The oscillators, including RSI, MACD, and CCI, collectively support the bullish narrative. The RSI maintains its bullish posture by consistently staying above the 40% level. The MACD's histogram and signal line above the 0 line, along with the ascending histogram progress, indicate a strengthening bullish momentum. Additionally, the CCI above 100 underscores the prevailing strength in the bullish momentum.
With these indicators aligning, signaling a robust bullish trend, the expectation is that the minor resistance at 0.1266 will likely be overcome by the advancing bulls. Traders are eyeing profit targets, determined by pulling a Fibonacci retracement from the recent swing high at 0.13430 to the swing low at 0.11166. The 123.6% and 161.8% projection values, estimated around 0.1400 - 0.1480, serve as potential profit targets as XLMUSD continues its journey through the cryptocurrency landscape.
Forecast 0.1% vs Previous 0.5%
Forecast -0.1% vs Previous 0.1%
Forecast 222k vs Previous 218k

Trading foreign exchange on margin carries a high level of risk, and may not be suitable for all investors. Before deciding to trade foreign exchange you should carefully consider your investment objectives, level of experience, and risk appetite.
Nothing contained in this website should be construed as investment advice. Any reference to an investment's past or potential performance is not, and should not be construed as, a recommendation or as a guarantee of any specific outcome or profit.