
USDCAD continues to extend its gains for the second consecutive day, trading around 1.3750 during early European hours on Friday. This sustained uptrend reflects a solid technical foundation and bullish sentiment in the market.

Technical Analysis on the 1-Hour Timeframe:
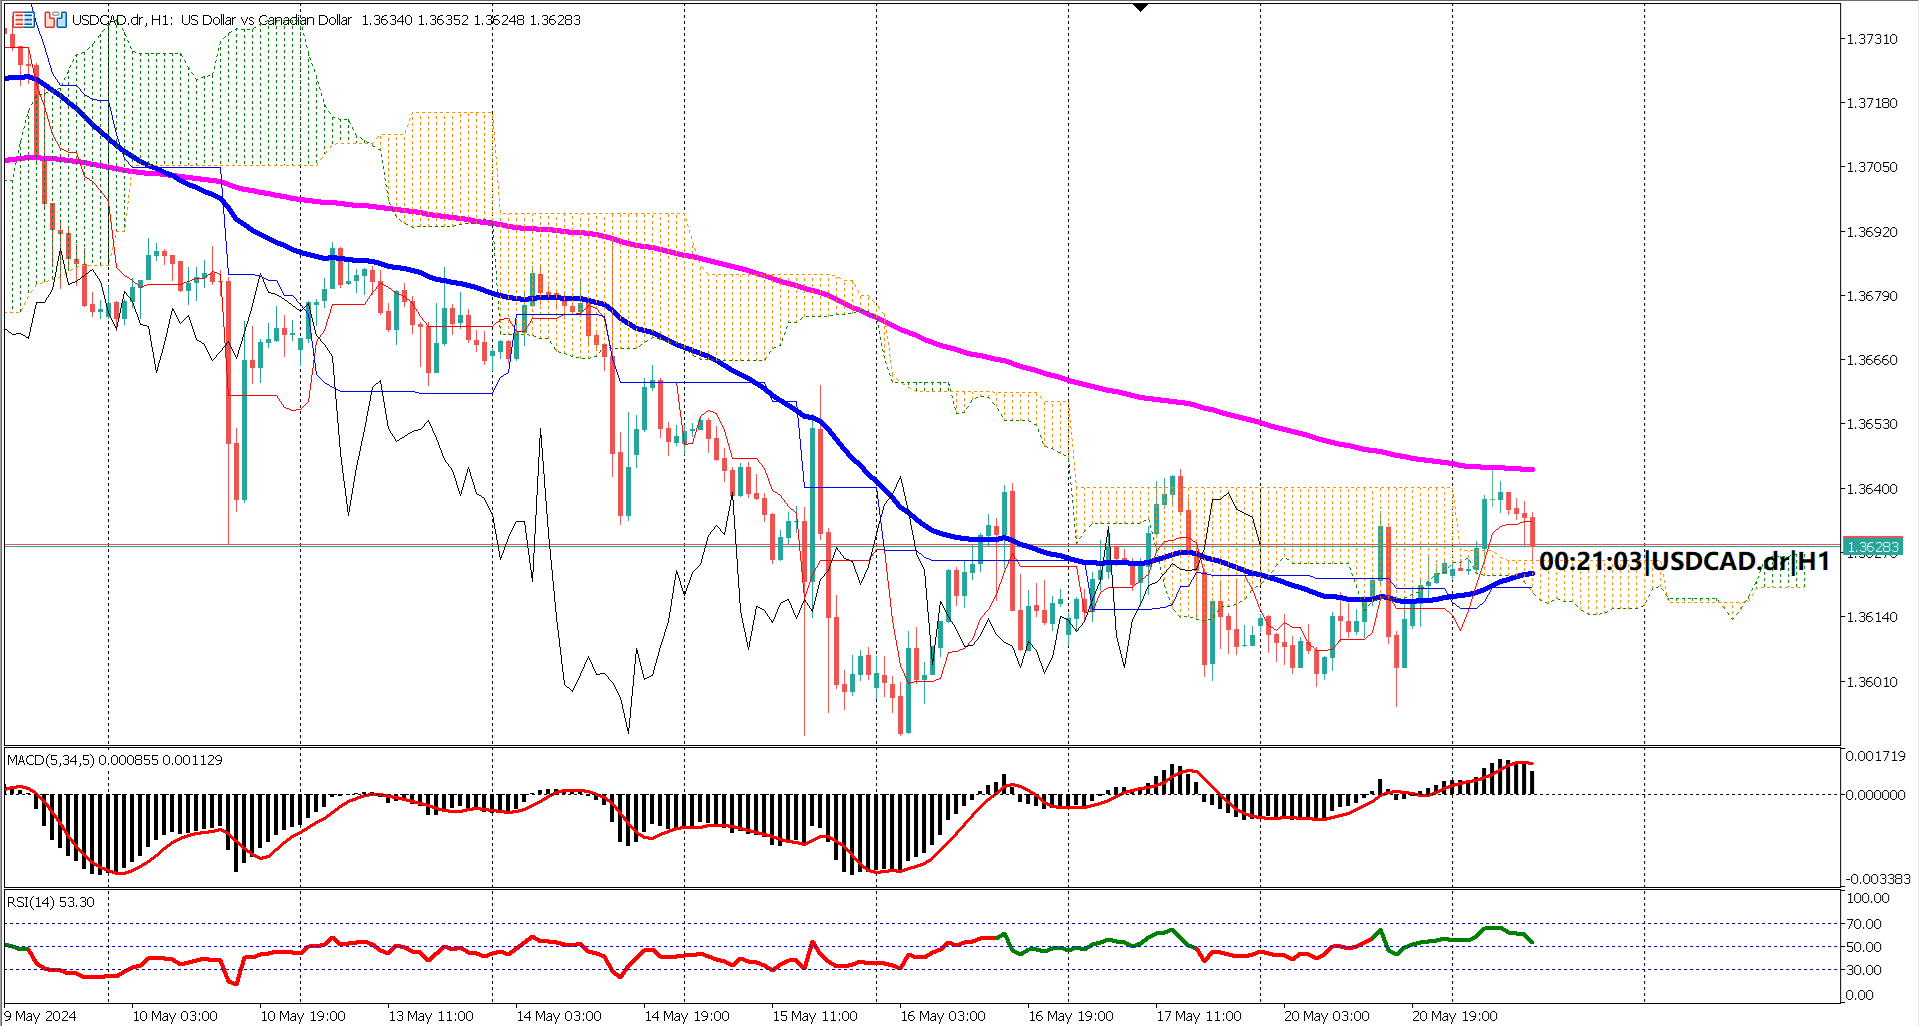
Ichimoku Cloud: During the Asian trading session, the market found significant support on the Ichimoku cloud, indicating a potential bullish continuation. While the Kijun-sen and Tenkan-sen lines briefly dipped below the cloud, the Chikou Span did not follow suit. This absence of a bearish reversal confirmation from the Ichimoku cloud suggests that the overall bullish momentum remains intact. Currently, the Kijun-sen and Tenkan-sen lines are returning above the cloud, reinforcing the ongoing bullish trend.
Exponential Moving Averages (EMA): The 50-period and 200-period EMAs have been narrowing following the FOMC meeting on Wednesday. The market's rebound prevented the 50-period EMA from approaching the 200-period EMA, averting a potential bearish signal. At present, the 200-period EMA serves as a crucial support level. If prices remain above this support, the bullish outlook for USDCAD is likely to strengthen further.
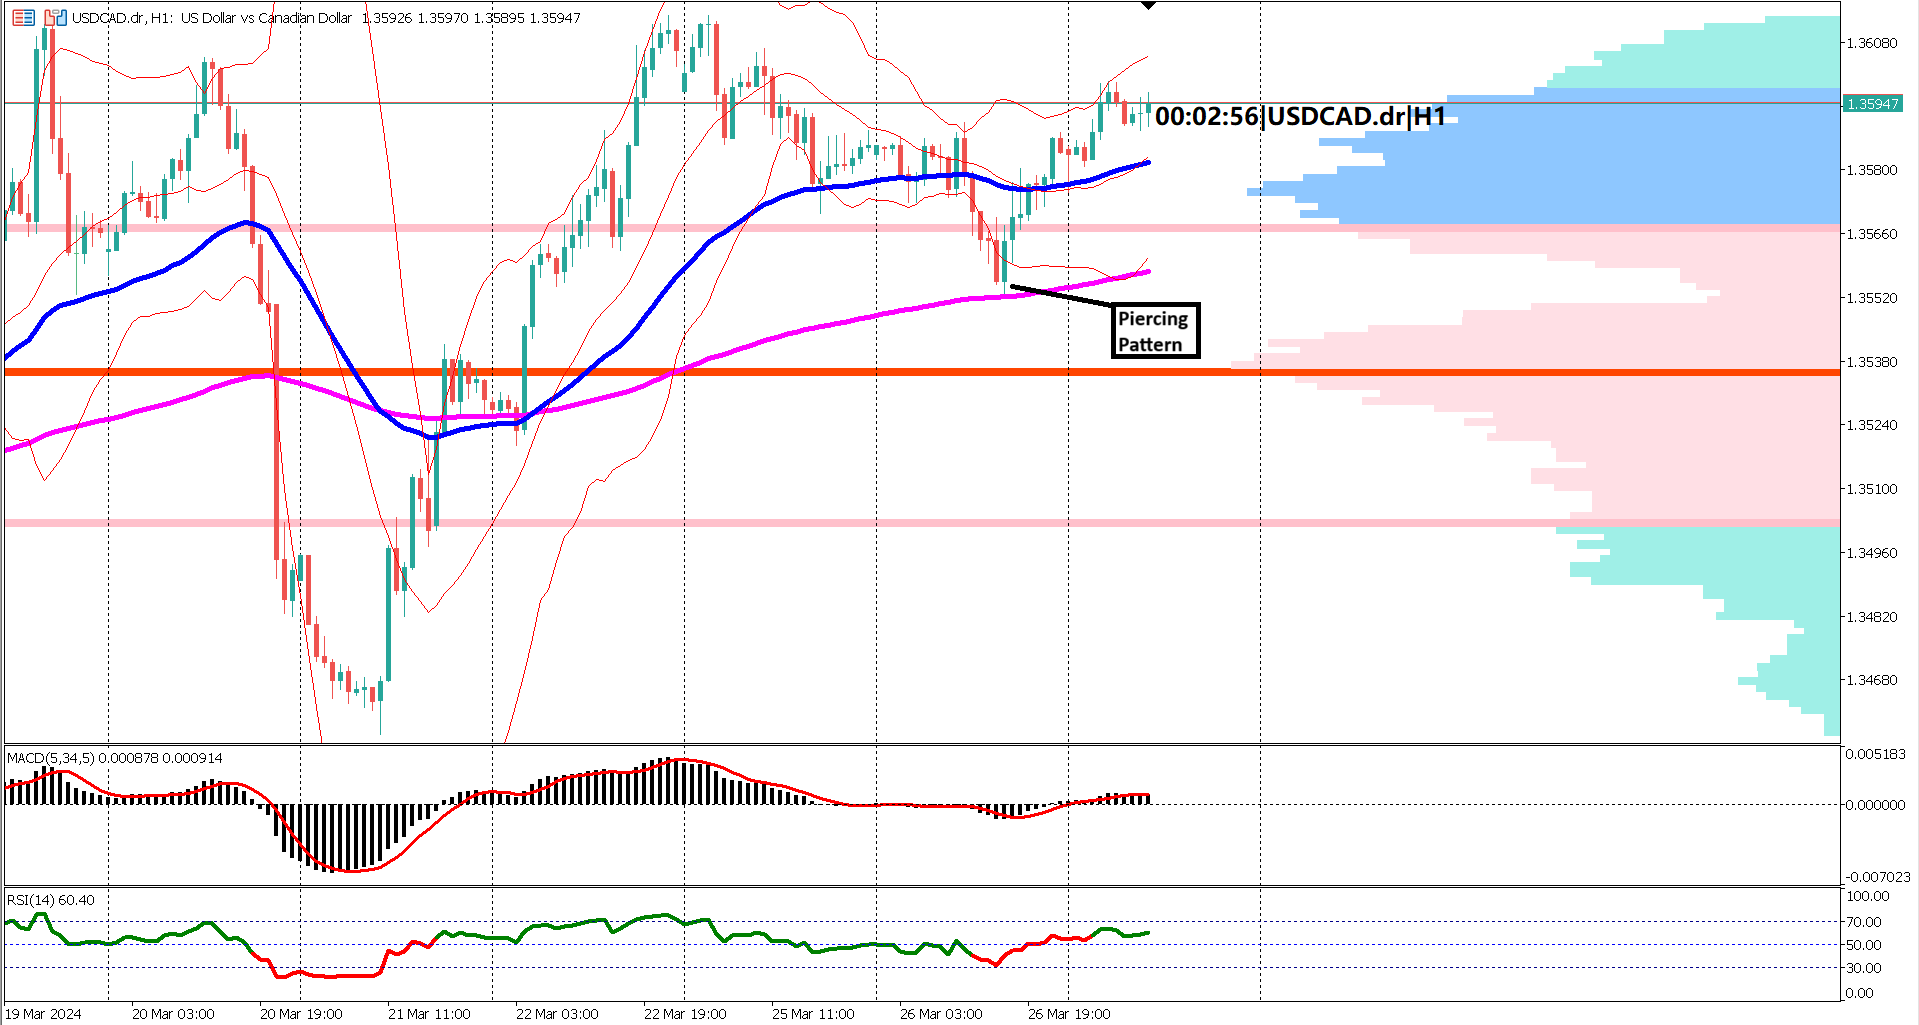
MACD and RSI Indicators: Both the MACD and RSI indicators are signaling bullish momentum. The MACD signal line is positioned above the zero line, indicating positive momentum. Similarly, the RSI has entered the bullish zone, crossing above the 60% level and maintaining its position without falling below 40%. These indicators corroborate the prevailing bullish sentiment in the market.
Market Position: USDCAD is trading above the value area, further suggesting that the market sentiment is bullish. The convergence of technical indicators—such as the Ichimoku cloud support, the narrowing EMAs, and the bullish signals from the MACD and RSI—all point to a continuation of the upward trend.
Conclusion: In summary, USDCAD exhibits strong bullish momentum supported by multiple technical indicators. The Ichimoku cloud, EMA dynamics, and positive signals from the MACD and RSI all align to suggest that the pair will likely continue its upward trajectory. Traders should monitor the key support levels, particularly the 200-period EMA, to gauge the sustainability of this bullish trend.
Forecast 225K vs Previous 229K
Forecast 225K vs Previous 229K

Trading foreign exchange on margin carries a high level of risk, and may not be suitable for all investors. Before deciding to trade foreign exchange you should carefully consider your investment objectives, level of experience, and risk appetite.
Nothing contained in this website should be construed as investment advice. Any reference to an investment's past or potential performance is not, and should not be construed as, a recommendation or as a guarantee of any specific outcome or profit.