The USDJPY currency pair has been under scrutiny recently, particularly in light of Japan's latest Gross Domestic Product (GDP) figures. The Japanese GDP for the recent quarter came in lower than the forecasted 3.4%, registering at 3.7%, which is also a decline from the previous GDP data of 3.9%. Despite this, market reactions have been relatively muted, with bullish sentiments persisting. This article delves into both the fundamental and technical aspects of USDJPY, offering insights for traders and investors alike.

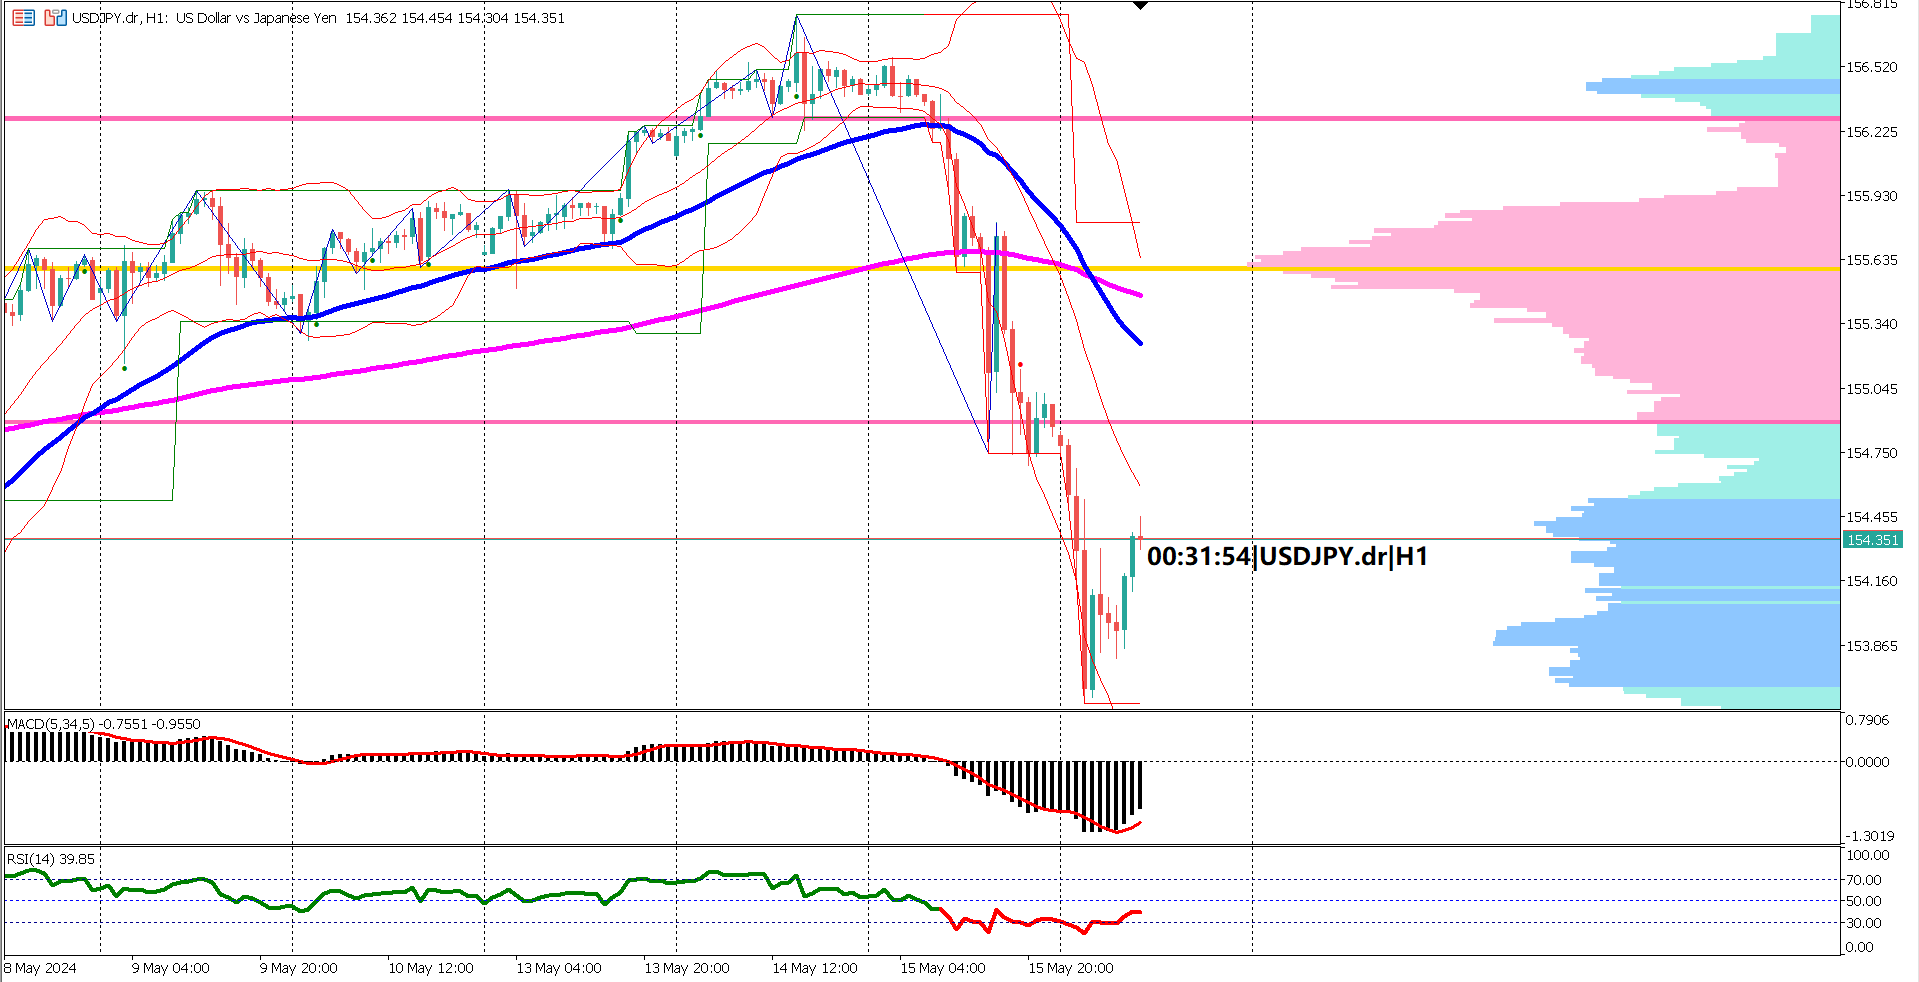
In the 1-hour time frame, the technical indicators are currently showing a bullish sentiment for USD/JPY. Notably, the 50-period Exponential Moving Average (EMA) is positioned above the 200-period EMA, and a golden cross—a bullish signal where a short-term moving average crosses above a long-term moving average—occurred today. This crossover typically signals the potential for upward momentum.
The Ichimoku Kinko Hyo, a comprehensive indicator combining various elements to provide support and resistance levels, trend direction, and momentum, further supports the bullish sentiment. The Tenkan-sen (conversion line), Kijun-sen (base line), and Chikou Span (lagging span) all align to suggest upward momentum. Following a substantial rally of over 200 pips from last week's low on Friday, the market may be poised for a pullback, a common occurrence after significant price movements.
Both the Stochastic Oscillator and the Relative Strength Index (RSI) are in bullish territory. However, the RSI recently exited the overbought zone, which could signal an impending pullback from today's high. The Moving Average Convergence Divergence (MACD) indicator adds to this sentiment, as its histogram has crossed below the signal line, indicating a potential weakening of the current bullish momentum.
Key support levels to monitor include the 50-period EMA, the 200-period EMA, and the Ichimoku cloud. A break below the lowest points of these key levels may suggest a bearish reversal. Traders should be vigilant of these supports, as a breach could indicate a shift in market sentiment from bullish to bearish.
In conclusion, while the Japanese GDP data may have fallen slightly short of expectations, both fundamental and technical analyses suggest that the USDJPY currency pair still has room for upward movement. Traders should remain vigilant for potential pullbacks but keep an eye on key support levels for signs of a reversal in market sentiment.
Actual -1.8% vs Forecast -2.0% vs Previous 0.4%

Trading foreign exchange on margin carries a high level of risk, and may not be suitable for all investors. Before deciding to trade foreign exchange you should carefully consider your investment objectives, level of experience, and risk appetite.
Nothing contained in this website should be construed as investment advice. Any reference to an investment's past or potential performance is not, and should not be construed as, a recommendation or as a guarantee of any specific outcome or profit.