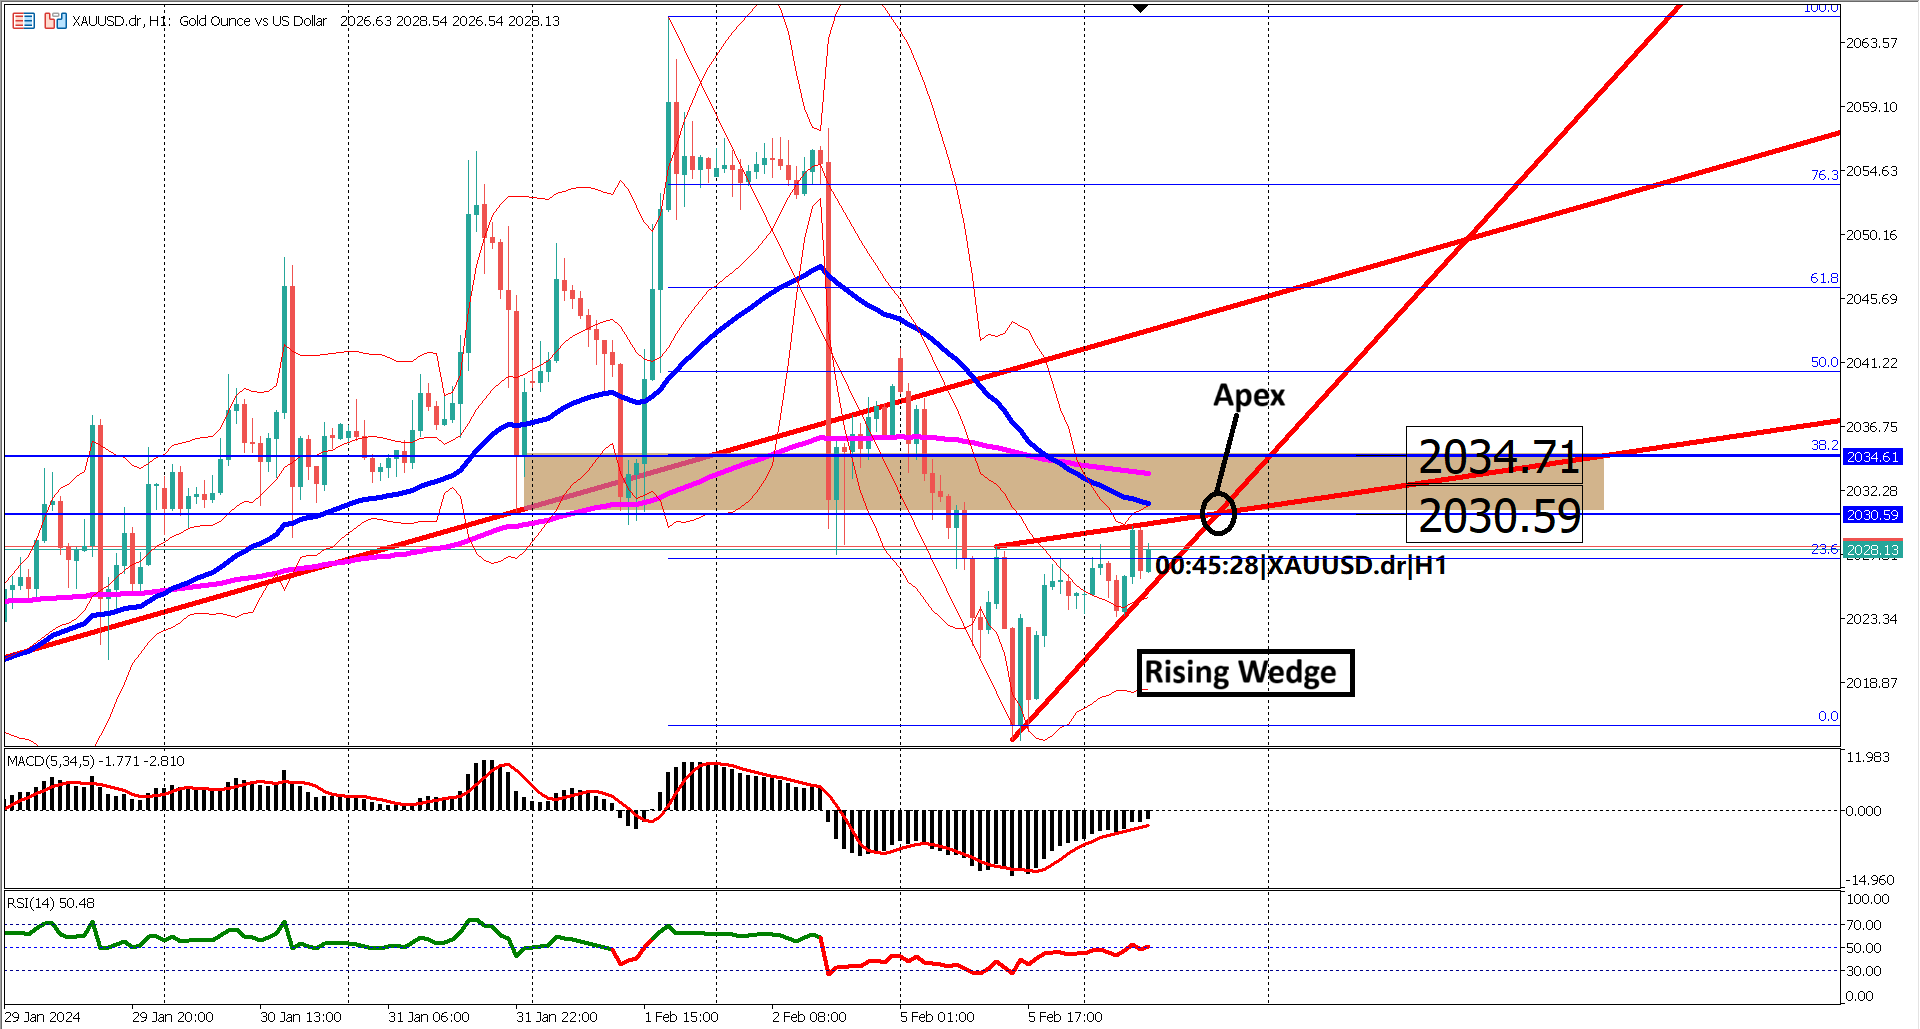

XAUUSD has paused its bearish trend, taking a break from pushing prices lower. The market has retraced to the 23.6% Fibonacci retracement level, with key resistance now observed at the EMA 200. This retracement indicates a temporary halt in the bearish momentum, providing traders with a moment to reassess the market conditions.
On the 1-hour time frame, the bearish momentum appears to be weakening, as evidenced by a sideways movement over the past two to three days. Additionally, the EMA 50 is bending and pointing towards the EMA 200, signaling a potential decrease in downward pressure. This convergence of the EMAs is often interpreted as a sign of diminishing momentum, suggesting that the bears may be losing their grip.
The MACD and RSI indicators have oscillated between bearish and bullish zones over the last two days, indicating a sideways trend. When the market moves sideways for an extended period, typically two days or more, oscillators like the MACD and RSI become less effective in gauging the overall trend direction. This fluctuation between zones reflects the market's indecisiveness and the lack of a clear directional bias.
In a sideways trending market, monitoring key levels of support and resistance becomes crucial for determining whether the trend will continue or reverse. For XAUUSD, the key support level to watch is the recent swing low at $2326.60. On the resistance side, the EMA 200 and the Ichimoku cloud serve as critical levels to observe. A break above these resistance levels could signal a bullish reversal, while a drop below the support level may indicate a continuation of the bearish trend.
Overall, while XAUUSD is currently in a sideways movement, traders should remain vigilant, closely watching the key support and resistance levels to anticipate potential market moves. The outcome of this consolidation period will be crucial in determining the next directional trend for XAUUSD.
Actual 0.1% vs Forecast 0.3% vs Previous -0.4%
Forecast 96.0 vs Previous 97.0

Trading foreign exchange on margin carries a high level of risk, and may not be suitable for all investors. Before deciding to trade foreign exchange you should carefully consider your investment objectives, level of experience, and risk appetite.
Nothing contained in this website should be construed as investment advice. Any reference to an investment's past or potential performance is not, and should not be construed as, a recommendation or as a guarantee of any specific outcome or profit.