
In the intricate tapestry of the global financial landscape, EURUSD faced a dichotomy in response to recent economic data. While the USD showcased strength with its GDP growth surpassing expectations at 5.2% compared to the projected 4.9%, Germany's Consumer Price Index (CPI) painted a contrasting picture. The month-on-month (MoM) and year-on-year (YoY) figures both disappointed, landing at -0.4% versus the expected -0.2%, and 3.2% versus the projected 3.5%, respectively. Despite this mixed bag of economic indicators, EURUSD managed to maintain composure, holding steady after the announcements.
As the financial stage shifts, today's focus turns to the European Union's release of Consumer Price Index (CPI) and Core CPI data. Economists harbor more reserved expectations for these crucial economic gauges, setting the scene for potential market reactions.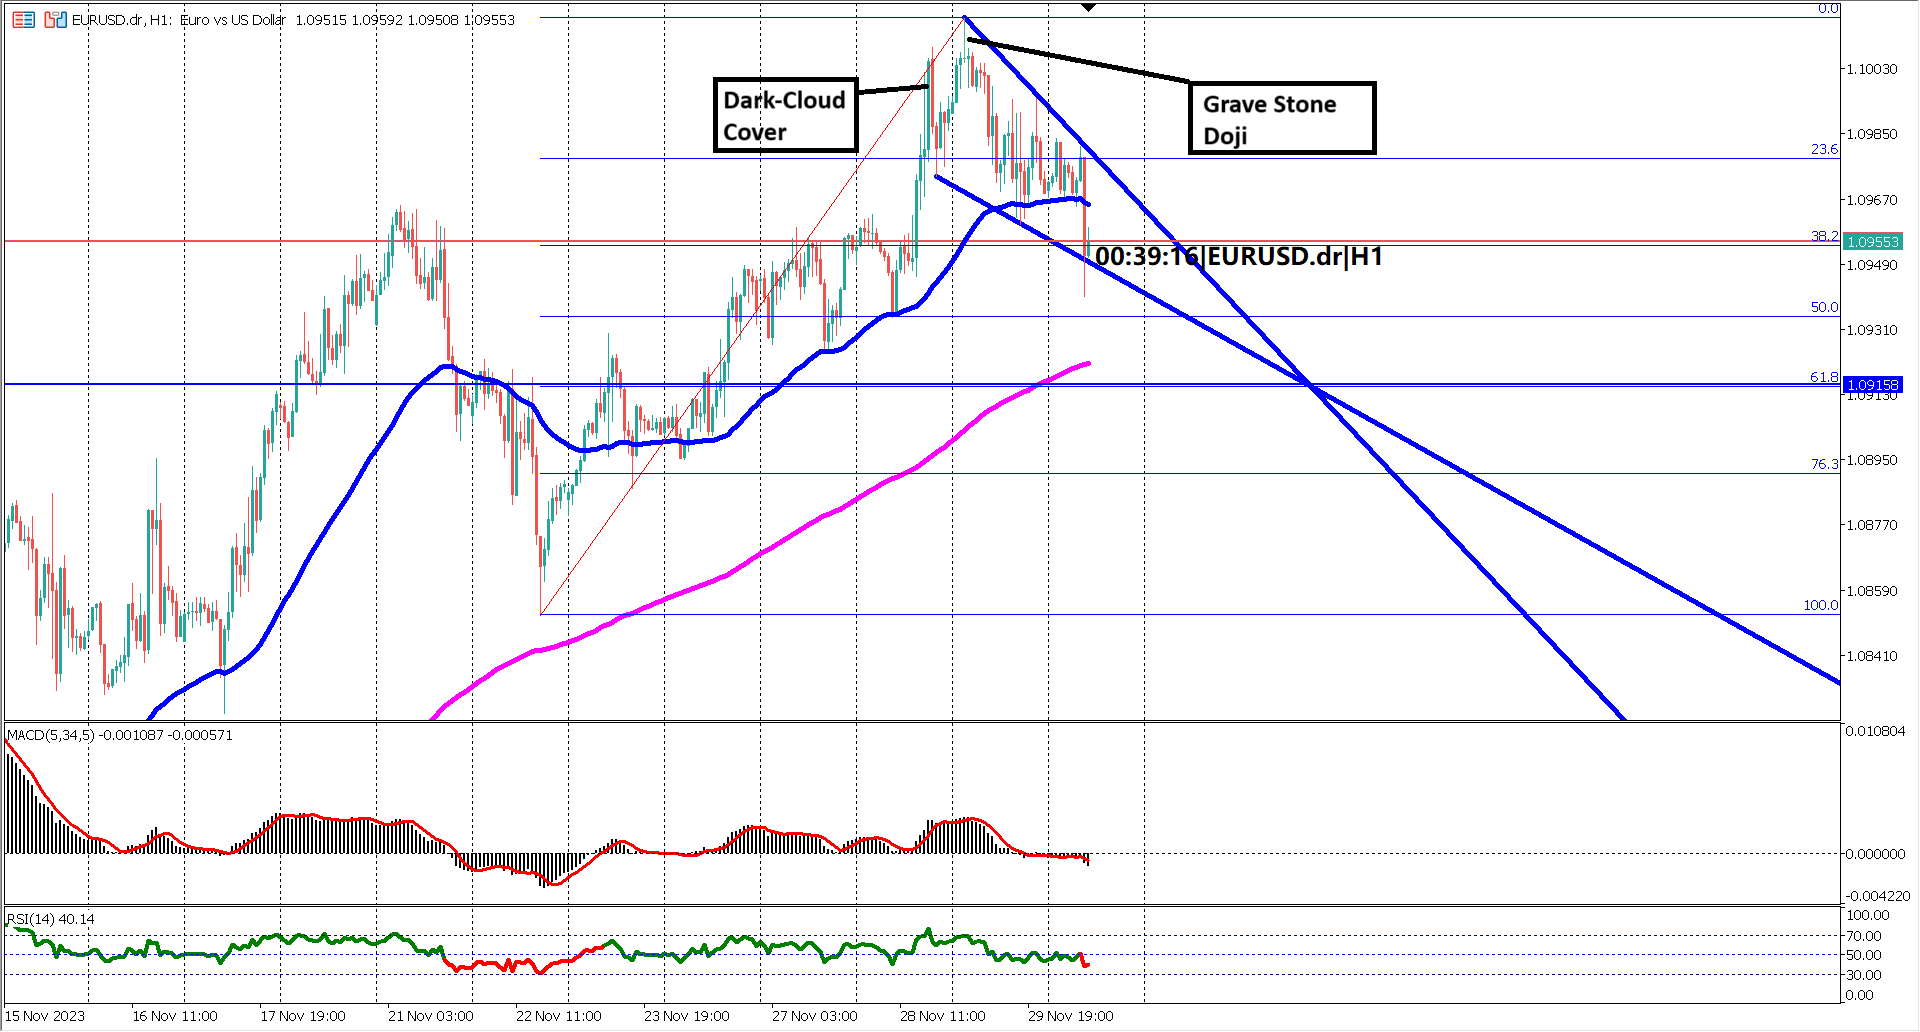
Zooming in on the 1-hour timeframe chart, intricate candlestick patterns have emerged, signaling potential shifts in market sentiment. The appearance of a dark cloud cover and grave stone doji at the zenith of the bullish trend indicates a loss of momentum, potentially setting the stage for either a reversal or a profound retracement.
Adding another layer to the technical analysis, a falling wedge pattern has etched itself onto the hourly chart. The Asian trading session witnessed EURUSD confined within a tight range. However, as the European-London trading session unfolded, the price experienced a downturn, testing the lower bounds of the falling wedge pattern. Notably, this descent managed to breach below the 38.2% Fibonacci retracement level, suggesting the potential initiation of a more profound corrective phase.
Key support emerges at the apex of the falling wedge trendline, intersecting with the golden ratio level of 61.8% Fibonacci retracement, at 1.09158. The confluence of these technical levels adds significance to this support zone. However, caution is advised, as the Relative Strength Index (RSI) has breached below the 40% level, signaling a potential conclusion to the bullish trend and the inception of a short-term bearish phase. These sentiments are echoed by the Moving Average Convergence Divergence (MACD) histogram and signal line, both crossing under the 0 line. Furthermore, the Exponential Moving Averages (EMA) 50 and EMA 200 are beginning to converge, hinting at a diminishing bullish momentum in the days ahead.
Against the backdrop of economic data and intricate technical signals, EURUSD faces a crucial juncture, where traders must navigate evolving market dynamics to uncover potential trading opportunities.
Forecast 2.7% vs Previous 2.9%
Forecast 3.9% vs Previous 4.2%
Forecast 3.5% vs Previous 3.7%
Forecast 0.2% vs Previous 0.3%

Trading foreign exchange on margin carries a high level of risk, and may not be suitable for all investors. Before deciding to trade foreign exchange you should carefully consider your investment objectives, level of experience, and risk appetite.
Nothing contained in this website should be construed as investment advice. Any reference to an investment's past or potential performance is not, and should not be construed as, a recommendation or as a guarantee of any specific outcome or profit.